Campaigns: on your mark, get set, go?
←
→
Page content transcription
If your browser does not render page correctly, please read the page content below
Emerging Markets Institute
Monthly perspective | April12, 2018
Campaigns: on your mark, get set, go?
SUMMARY
Globally, fears of a trade war have combined with concerns about the economic cycle (inflation and rates), affecting
stock markets.
In Mexico, stocks were affected but the peso and REITs strengthened on hopes of a NAFTA resolution before July
elections.
Foreseeable global risks: failure of US progrowth initiatives, trade wars, Europe, geopolítics, monetary policy,
Bitcoin.
In Mexico, main local risks are NAFTA renegotiation before elections and a negative result in July elections.
Investment scenarios for 2018 no change, with probabilities: positive (20%), negative (40%), middle (40%).
Overweight ILS duration 1 to 3 years, underweight stocks and REITs.
“The media, the polls and our legislatures fortunately have short attention spans” – John Gutfreund
Trade wars and election campaigns
Trump`s protectionist measures, his extraordinary personnel rotation, and the Facebook scandal roiled stock
markets, including Mexico. The peso strengthened against the US$, despite the official beginning of the campaign
for the July elections, and REITs rose, owing to hopes of a NAFTA resolution (Figure 1).
Figure 1. Inversiones: desempeño 31dic2017- 3abril2018 (% pesos). Source: Bloomberg, Franklin Templeton
1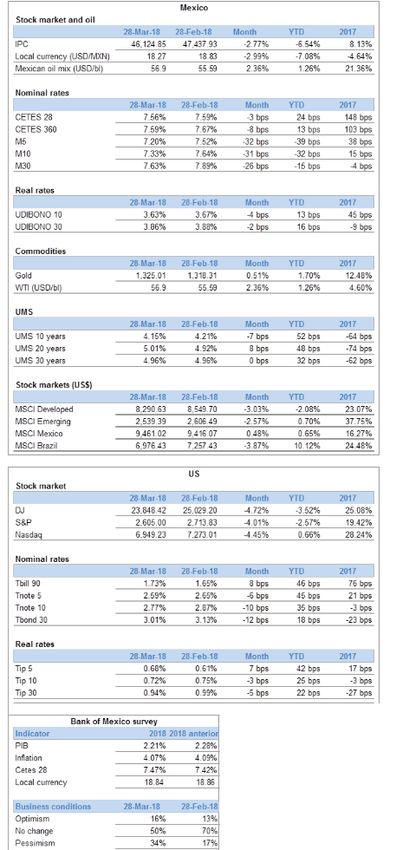
Monthly perspective                                                                                                         April 12, 2018

POLITICS                             Franklin Templeton Servicios de Asesoría Mexico
USA
Trade policy
After his announcement in March of tariffs on steel and aluminum, effective May 1 2018, Trump announced tariffs
up to 25% on imports from China worth up to US$60bn., with no clarity on which imports. At the beginning of April,
China responded with tariffs from 15% to 25% on 128 American products including fruit wine and pork. The US
published a preliminary list of more than 1,300 products that could be affected, including flat screens, weapons,
satellite, medical equipment, and batteries: in contrast to steel and aluminum, these measures are mainly covered
by WTO rules. China responded with measures affecting US exports valued at US$50bn. annually, focusing on soya
(the main US export to China), autos, chemicals and planes, all products from regions with Republican majorities, a
clear attempt to influence legislators.
Calling these tariffs “unjust”, Trump promised to look at new protectionist measures. Apparently China is considering
yen depreciation as a tool in a trade war against the US. Subsequently both countries claimed to be seeking to
avoid a full-scale trade war, and there were words of reassurance from Trump’s economic team, currently headed
by a new Chief Economic Advisor, Lawrence Kudlow, who replaced Gary Cohn, who had resigned on March 6 as
protest against protectionism.
Personnel turnover
Rex Tillerson, Secretary of State, and retired general H. R. MacMaster, National Security Adviser, were fired by
Trump in March. They were replaced by Mike Pompeo, Director of the CIA, and John Bolton, previously US
ambassador to the UN (under George W. Bush). Speculation is that the next to go will be Attorney General Jeff
Sessions, Defense Secretary James Mattis, and chief of staff John Kelly. Sessions’ departure would be a response
to the increasingly aggressive investigation of Trump, his family and team, and those of Mattis and Kelly to their
inability to adapt to Trump’s management style.

Politics
For congressional elections, due November 6 2018, according to polls, Republics still lag, although it is unclear
whether they will lose their majority in both Senate and House (Figure 2).

                    Figure 2. US congressional elections 2018: electoral preferences (3April18). Source: RealClearPolitics

GLOBAL
North Korea
At the beginning of March Trump accepted an invitation to meet with Kim Jong Un, President of North Korea, with
South Korean participation. In response, at the end of March Kim left his country for the first time since 2011, when
he became President, to visit Chinese leader Xi Jingpin. This simultaneous approach to the US and China is a tactic
the North Korean regime has used to survive as it advances its nuclear program.

                                                                                                                                    2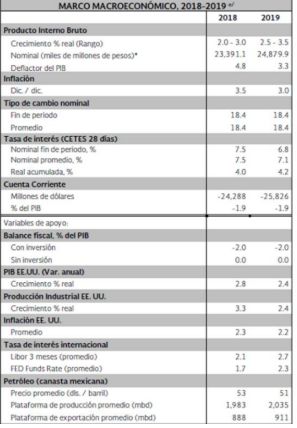
Monthly perspective                                                                                                          April 12, 2018

Russia                                Franklin Templeton Servicios de Asesoría Mexico
In March, Vladimir Putin, after 18 years in power, was reelected President, until 2024, with a majority of 77% and
voter participation of 70%. The US announced its most severe sanctions yet against Russian companies and
oligarchs for backing atrocities by the Syrian government against its citizens. In April, Trump announced the
possibility of airstrikes against the Syria government, explicitly criticizing Russia.

Brazil and Peru
In Brazil, Lula, candidate to return to the presidency in 2018 elections, was returned to jail with a 12 years sentence,
as his appeal against corruption charges failed. In Peru, Congress accepted the resignation of President Pedro
Pablo Kuczynski owing to charges against his lawyer and various ministers of buying opposition votes in exchange
for public works.

MEXICO
2018 elections
At the end of March, AMLO was in first place in the opinion polls (Figure 3). This big lead is due to his message
(rejection of corruption associated with traditional parties, rejection of education energy and telecoms reforms and
proposed cancellation of the new Mexico City airport Project (NAICM)), and his effective use of social media since
the beginning of the Peña administration. Combined with an important change in tone, towards moderation
compared with previous campaigns, AMLO seems to attract the population outside urban areas and millennials (less
than 30 years old) who comprise 29% of the electorate, and who have not experienced the political and economic
instability caused by the old PRI in the 1970s (Presidents Echeverría and López Portillo), with whom many older
generations identify him.
                    Figure 3. Average of most recent polls: voting intentions 2018 (28Mar18). Source: polling organizations

During the “precampaign”, Meade looked to distinguish himself from his predecessors and other candidates by
presenting a “7 of 7” declaration: in addition to the “3 of 3” declaration, of assets, conflict of interest and taxes, he
presented certificates from the property registry, an accountant’s opinion, a tax report, and notarized certificate proof
of the reality of his documentation. After Trump announced the deployment of 2500 to 3000 National Guard troops
along the Mexican frontier, President Peña Nieto replied with a speech approved by all candidates, improving
Meade´s popularity.

On April 1, the official campaigns began for President, 8 state governors (Chiapas, Guanajuato, Jalisco, Morelos,
Puebla, Tabasco, Veracruz and Yucatán), Mexico City Mayor, 500 deputies 128 senators and local elections in 30
states: a total of 3,326 electoral posts. For the first time, there are two independent presidential candidates, Margarita
Zavala and Jaime Rodriguez (“El Bronco”). There are important differences with the precampaign. First each party
can officially spend campaign funds: the coalitions comprising of PRI-PVEM-PANAL (Meade) and PAN-PRD-MC
(Anaya) have more money than Morena-PT-PS (AMLO) (Figure 4).
                                        Figure 4. Estimated campaign funds (pesos mn.). Source: INE

                                                                                                                                     3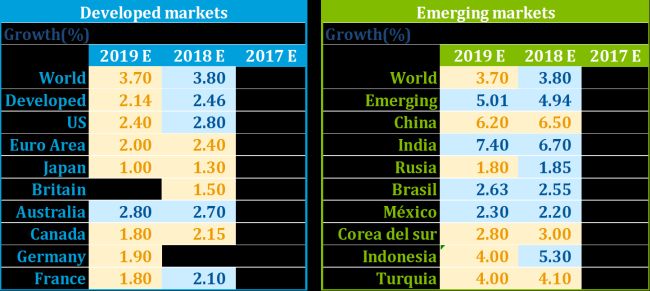
Monthly perspective                                                                                                      April 12, 2018

Second, PRI and PAN can make use       of their greater coverage and experience than Morena, which was founded in
                                   Franklin Templeton Servicios de Asesoría Mexico
as recently as 2014. Third, there will be three debates, in April, Mayo and June (Figure 5). Meade and Anaya are
considered better debaters than AMLO (Figure 5).
                                             Figure 5. Presidential debates 2018. Source: INE
                                                DEBATE             THEME                      TOPICS
                                               Mexico City       Politics and    Fighting corruption and impunity
                                                 22-Apr          government         Public security and violence
                                                                                 Democracy, pluralism and rights of
                                            Palacio de Minería
                                                                                        vulnerable groups
                                                 Tijuana                           Foreign trade and investment
                                                 20-May         Mexico in the      Frontier security and fighting
                                              Universidad          world                 Immigrants rights
                                           Autonomoa de Baja
                                           California, campus
                                                 Tijuana
                                                 Mérida                           Economic growth, poverty and
                                                  12-Jun       Economics and     Education, science and technology
                                          Museo del Mundo Maya development
                                                                                Sustainable development and climate
                                                                                              change

The main issue is whether the combination of greater expenditure, coverage and organization, ability in debates,
and better use of social media to convey a more conservative and less radical message will be sufficient for the PRI
and/or PAN-PRD coalition to catch up with AMLO and Morena. Among many scenarios are: use of tactical voting,
that when the campaigns end on June 27, undecided voters (estimated at 20%), backers of independent candidates
(4-6%) and backers of the coalition in third place in the polls, combine with the second place coalition against AMLO
and Morena; or a split vote between the presidency, with AMLO winning it, and Senate and Congress won by other
parties.

NAFTA negotiations
Negotiations have advanced owing to the attitude of the US, which apparently does not want to negotiate
simultaneously on two fronts, with Mexico after the elections, and China. At the beginning of April, Ildefonso Guajardo
suggested an 80% probability of definitive progress by the beginning of May.

ECONOMY
GLOBAL
Global growth is expected to grow in 2018, but a slowdown is expected for 2019 mainly in developed economies
(Figure 6).
                  Figure 6. Developed and emerging economies: estimated growth 2017- 2019 (April2018) Source: Bloomberg

FED
As expected, the FED raised its benchmark rate from 1.50% to 1.75% taking account of growth and employment
dynamics. Higher inflation is expected owing to wage increases caused by employment at record lows in 35 years,
increase in voluntary retirement, and vacancies in small companies at record levels since 1974 (Figure 7).
                                          Figure 7. US: Inflation and rates 2013-2018). Source: Bloomberg

                                                                                                                                 4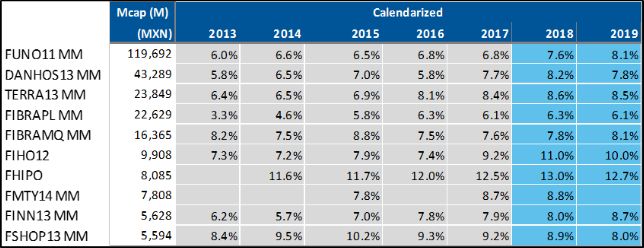
Monthly perspective                                                                                April 12, 2018

BITCOIN                              Franklin Templeton Servicios de Asesoría Mexico
With considerable volatility, Bitcoin has fallen below US$7,000, and with no serious effect either on other markets
or the economy. It is conceivable that the systemic danger is diminishing.
                                     Figure 8. Bitcoin: prices (US$ - Apr2018). Source: Bloomberg

MEXICO
Economic policy pre-criteria
The Treasury Ministry (SHCP) presented to Congress its economic policy pre-criteria (pre-Criterios de Política
Macroeconómica) for 2018 and 2019. Growth is estimated between 2-3% (2018) and 2.5-3.5% (2019), inflation 3.5
and 3, real interest rate 4% and 4.2%, average exchange rate to US$ of 18.4 pesos. Public sector financial
requirements are estimated at 2.5% of GDP, maintaining its downward trend (Figure 9).

                                      Figure 9. Economic policy pre-criteria Source: SHCP

Inflation
In March, consumer inflation fell from 5.34% to 5.04%, and producer inflation rose from 3.24% to 3.64% (Figure 10).
                                    Figure 10. Inflación anual (marzo 2018). Source: INEGI.

                                                                                                           5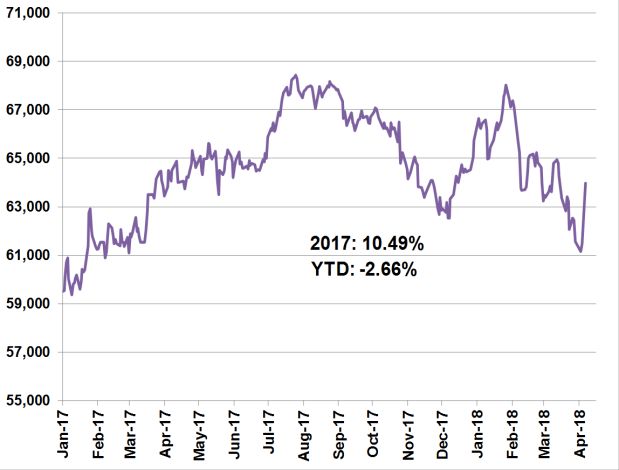
Monthly perspective April 12, 2018
RISKS AND SCENARIOS FOR 2018 Franklin Templeton Servicios de Asesoría Mexico
Considering foreseeable risks, we present 3 scenarios for 2018, where the objective is Mexican economic growth.
In the positive scenario, all risks turn out positive for Mexican growth, in the negative, all turn out negative, and in
the middle, they vary different (in nature, intensity and/or duration).
RISKS
Global
EEUU: Trump progrowth initiatives, trade wars
North America: NAFTA renegotiation
Europe: Brexit, Catalonia and elections (Italy)
Geopolítics: Middle East, Russia, China, North Korea
Global slowdown, monetary policy
Bitcoin
Mexican
Elections 2018
Security
Corruption
Oil price
Debt increase: credit rating
SCENARIOS
Positive (20%)
• US: tax reduction, deregulation and infrastructure Investment, absence of trade wars.
• NAFTA renegotiation “win-win”.
• Europe, China, Russia, Korea and Middle East: risks do not materialize.
• Global synchronous growth, successful monetary policy.
• Bitcoin crash does not affect economy.
• Mexico: corruption and security risks contained, positive elections.
Negative (40%)
US: progrowth policies fail, trade wars break out.
NAFTA renegotiation fails.
Europe (UK and EU) disintegrates, risks in China, Russia, Korea and Russia materialize.
Global slowdown due to politics, economic dynamics, or monetary policy.
Bitcoin crash affects economy.
Mexico: corruption and insecurity increase, negative elections.
Middle (40%)
US progrowth measures partially successful, mixed trade measures.
TLC renegotiation partially positive.
Europe, China, Russia, Korea and Middle East: risk materialize partially.
Global growth continues, less synchronized than 2017 and monetary policy partially successful.
Bitcoin crash partially affects economy.
Mexico: corruption and security partially contained, uncertain elections.
MARKETS
Investments in US$ and pesos: comparative performance
Despite peso depreciation, long term (2000-2018) peso denominated investments have outperformed US
investments denominated in US$, converted to pesos (Figure 12).
Figure 12. Investments in US$ and pesos: performance measured in pesos 2000-Apr2018. Source: Franklin Templeton
16
IPC
14
Rendimiento anualizado (%)
12 UMS
10 REAL S&P
US TREASURIES
UDIBONOS
8 GUBER
BONOS
FIX
6 FLOAT
CETES
FONDEO B
4
2
0
0 5 10 15
Desviación estándar anualizada (%)
6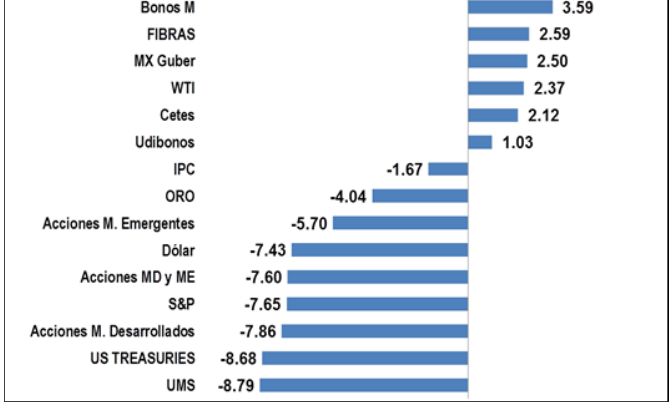
Monthly perspective April 12, 2018
US$ and peso Franklin Templeton Servicios de Asesoría Mexico
The peso has recovered owing to NAFTA optimism (Figures 12 and 13). One possibility is that markets are dividing
the period into two stages, NAFTA renegotiation, which looks positive, and the elections, which seem distant and
uncertain. Another possibility is that they do not think the election result will be negative either because AMLO will
do nothing negative, or because he will not win.
Figure 13. US$ index and peso 2005-Apr2018. Source: Bloomberg Figure 14. Peso vs. US$: 1980-Apr2018. Source: Franklin Templeton
1,300 0.105
1,250 22 40%
0.095
20 18.2
1,200
18 20%
0.085
1,150 16
15.1
Mexican Peso
Valuación Sub/Sobre
Dollar index
14
1,100 0.075 0%
12
$ / USD
1,050
10 -16.%
0.065
-17.2%
-20%
1,000 8
0.055 6 -30%
950
4 -40%
-40.5%
900 0.045 2
-54.8%
2005
2006
2007
2008
2009
2010
2011
2012
2013
2014
2015
2016
2017
2018
0 -60%
1980
1982
1984
1986
1988
1990
1992
1994
1996
1998
2000
2002
2004
2006
2008
2010
2012
2014
2016
2018
Dollar index Peso Mexican peso PPP theoretical value Under /over valuation
Debt
US rates fell during the month at the middle and short end, while short rates rose, flattening out the curve even more
(Figure 15). The Fed has hinted that inflation is increasing, and that this could imply a faster rate of normalization of
monetary policy. In March, the Fed reference rate rose from 1.50% to 1.75%.
Figure 15. US: yield curves (6Apr18). Source: Fed
6
5
4 3.01
YTM (%)
3
2.89
2.77
2 2.58
1
-
2008
2009
2010
2011
2012
2013
2014
2015
2016
2017
2018
Tnote 5 yr Tnote 10 yr Tnote 20 yr Tnote 30 yr
The market still expects rates to rise in practically all developed economies, with mixed movements in emerging
economies (Figure 16).
Figure 16. Developed and emerging economies: estimated nominal 10y rates end 2018 (6Apr2018). Source: Bloomberg, Franklin Templeton
Developed Emerging
local 10y yields (%) local 10y yields (%)
4Q18e Actual Aumento 4Q18e Actual Aumento
(bps) (bps)
US 3.16 2.84 32 China 3.84 3.72 12
Euro Area 0.99 0.52 48 India 7.49 7.47 2
Japan 0.09 0.03 6 Rusia 6.80 7.17 (37)
Britain 1.83 1.46 37 Brasil 10.25 9.80 45
Australia 3.07 2.72 35 México 7.70 7.34 36
Canada 2.66 2.28 38 Corea del sur 2.76 2.58 18
Germany 0.99 0.52 48 Indonesia 6.63 6.59 4
France 1.27 0.75 52 Turquia 11.77 13.02 (125)
7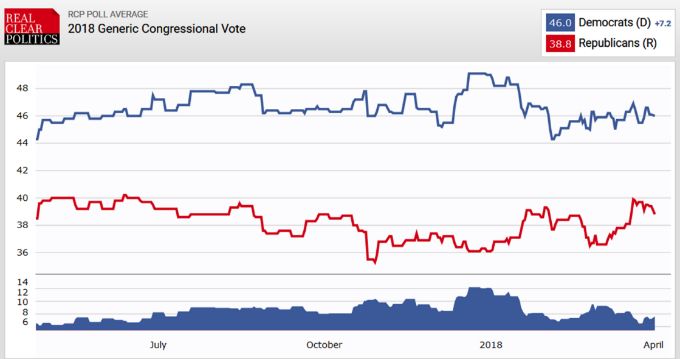
Monthly perspective                                                                                                                               April 12, 2018

Stocks                            Franklin Templeton Servicios de Asesoría Mexico
The year 2018 began well, but in addition to worries about the economic cycle there were fears of a trade war and
this was compounded by worries about tech stocks. The Facebook scandal, for permitting unauthorized use of
private information, was deepened by Trump’s attacks on Amazon, alleging that it evaded taxes and caused losses
to the US postal service. The underlying politics is that Jeff Bezos, Amazon CEO and founder is owner of The
Washington Post, which is not pro-Trump. Markets fear more regulation of the so-called FAANGs (Facebook,
Amazon, Apple, Netflix, Google) will limit the sector’s dynamism. The Mexican market followed global markets but
was helped in dollar performance, by peso appreciation (Figure 17).
                                                    Figure 17. Stock markets: 2018 (6April18 - US$). Source: Bloomberg

In Mexico and US, markets have been more volatile than 2017 but this is normal long term (Figures 18 and 19).
       Figure 18. Mexico: stocks (IRT pesos). 1Jan17-06April18. Source: Bloomberg    Figure 19. USA : stocks (S&P500 US$). 1Jan17-06Apr18. Source: Bloomberg

REITs
Due to novelty, inflation protection, and high dividends, REITs (Fibras) have outperformed stocks since 2011. Since
Trump’s election in November 2016, they have been hit by increased NAFTA uncertainty, political uncertainty in
Mexico and recently by fears of inflation and a trade war (Figures 19 and 20). They have recently recovered owing
to improved NAFTA prospects.
                                     Figure 20. REITS vs. Mexican stocks (IRT) Mar2011-6Apr18 (base 100 MXN$). Source: Bloomberg

                                                                                                                                                               8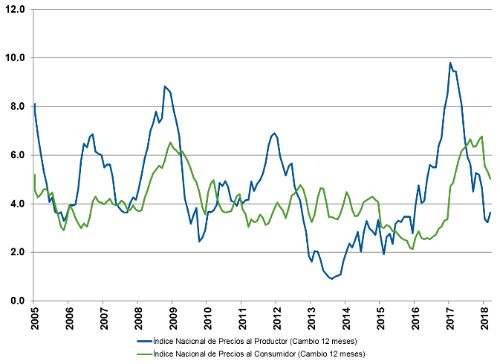
Monthly perspective                                                                                                      April 12, 2018

                              Figure 20. REITs: valuation and dividends (6Apr2018). Source: Franklin Templeton
                                   Franklin Templeton Servicios de Asesoría Mexico

The FIBRA E of the new Mexico City airport (“FNAIM”) issued $30bn. pesos mainly in Mexico, with an estimated
10% yield, and first distributions scheduled for 2021. Expected new issues, before July elections include ones
specializing in hotels (FSTAY), universities, sharing economy, and (FIBRAS E) prisons, hydraulic projects in
Southern Mexico.

Conclusion
The risk of external shocks (inflation and trade wars) combined with local risks (NAFTA and elections) could offer
windows of opportunity in financial markets. Overweight ILS for 1-3 year terms, underweight stocks and REITS.

                                                                                                                         Jorge Marmolejo
                                                                                                                         Ramsé Gutiérrez
                                                                                                                             Luis Gonzalí
                                                                                                                    Nadia Montes de Oca
                                                                                                                         Octavio Martínez
                                                                                                                 Editor: Timothy Heyman
                                                                                                                            April 12, 2018

                                                                                                                                 9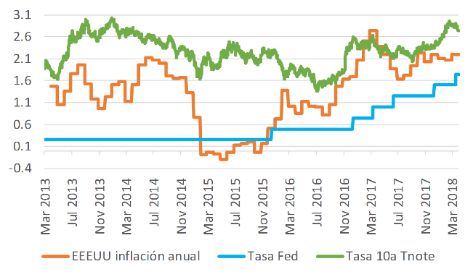
Monthly perspective April 12, 2018
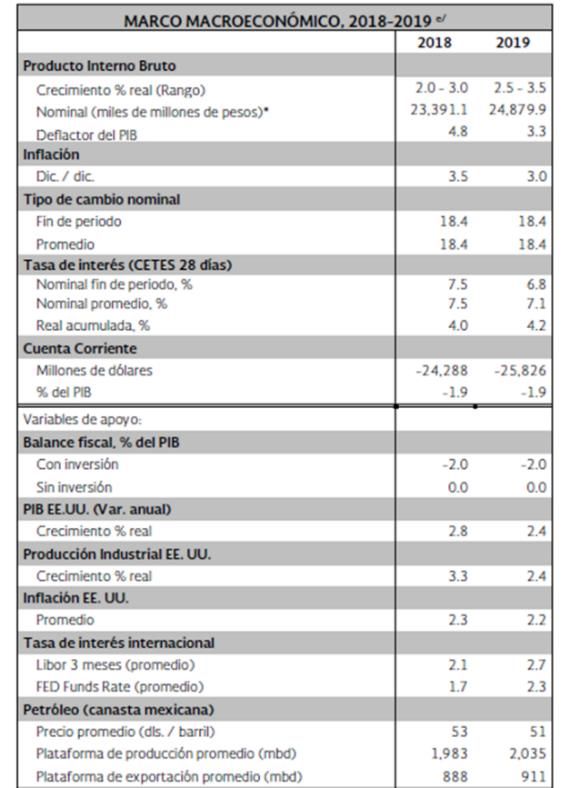
Main financial indicators: monthly at March 28, 2018
Main financial indicators: monthly at March 28, 2018
Franklin Templeton Servicios de Asesoría Mexico
During March, In Mexico, the IPC fell 2.77%. Nominal and real rates fell over all terms. The US$ fell 2.99% vs. the
peso. In the US, the DJ, S&P500 and Nasdaq fell. Nominal and real rates fell, except Tbills. In the Banxico business
climate poll, optimism rose to 16% (13% previous), no change fell to 50% (70%), and pessimism rose to 34% (17%).
Source: Bloomberg, Banco de Mexico
10Monthly perspective April 12, 2018
IMPORTANT LEGAL INFORMATION
Franklin Templeton Servicios de Asesoría Mexico
The material has been prepared by Franklin Templeton Servicios de Asesoría Mexico, S. de R.L. de C.V. (“FTSAM” or the “Company”) which
has the folio inscription number 30045-001-(14127)-15/04/2016 in the Public Register of Investment Advisors assigned by the National
Banking and Securities Commission (Comisión Nacional Bancaria y de Valores) in terms of the Securities Market Law (Ley del Mercado de
Valores). Registry does not imply compliance with the regulations applicable to the services that are provided, nor the precision or veracity
of the information provided. The content of this document is for information purposes only. Past Performance is not a guarantee of future
returns.
The material has been prepared by FTSAM solely for use in this document, and is intended to be of general interest only and does not
constitute legal or tax advice nor is it an offer for shares or invitation to apply for shares of any kind. Nothing in this document should be
construed as investment advice. This document may contain information obtained from various sources, and while it may be considered
reliable, the Company makes no warranty or any statement on its fidelity, accuracy, scope or coverage, as the Company has not verified,
validated or audited independently such information. The information is partial and, therefore, cannot be called complete. You agree to keep
the contents of this document strictly private and confidential and it shall not be disclosed, copied, reproduced or redistributed (in whole or in
part) to any person without the prior written consent of the Company.
This document may contain "forward looking statements" and results may vary from those expressed or implied are included in this document.
Such forward-looking statements can be identified, among other words, by the use of terminology such as "expect", "anticipate", "believe",
"continue", "could", "estimate", "predict", "try" "plan", "predict", "should" or other forward-looking terminology, or by the negative of these words
or comparable terminology, including without limitation the plural form of these words. All forward-looking statements relate to the Company's
current expectation regarding future events and are subject to a number of factors that could cause actual results to differ materially from
those in respect of the forward-looking statements. One must be cautious of such statements and should not place undue reliance on any
forward-looking statements.
This document includes no representation or warranty (express or implied) so it should not support the accuracy, fairness or completeness of
the information presented or contained in this document. Neither the Company nor any of its affiliates, employees, advisers or representatives
accepts any liability for any loss or damage caused by the information presented or contained in this document.
The information presented or contained in this document is current as of the date indicated and is subject to change without notice and its
accuracy is not guaranteed. The information contained herein and the views, if any, expressed therein are issued on the date hereof and,
therefore, are conditioned and / or subject to probable changes due to changes in applicable law, as well as the conditions and circumstances
that may or may not be provided in this document, in addition to over time and other similar situations. Neither the Company, nor its affiliates,
agents, employees nor advisers assume any responsibility or obligation to inform you or any other person regarding any changes to the
information or opinions expressed herein resulting from matters, circumstances or events that may arise in the future or that may be brought
to our attention after the date herein. This document should not be construed as legal, tax, investment or any other type of advice.
This document does not constitute an offer or invitation to purchase or subscribe shares or other securities and no part of this document or
any information, opinion or statement contained herein shall be the basis of, or be referred to in connection with any contract or commitment.
Any decision to purchase securities in any offering of securities should be made solely on the basis of information contained in the prospectus
of the securities offered. By reading this document, you agree to be subject to the above limitations.
*Timothy Heyman, President of FTSAM, founded Heyman y Asociados in 1985. In 2013, Franklin Templeton established FTSAM and merged
it with Heyman y Asociados.
Copyright © 2017. Franklin Templeton Investments. All rights reserved. Valid only in the United States of Mexico.
11You can also read