CAMBODIA ECONOMIC UPDATE - RECENT ECONOMIC DEVELOPMENTS AND OUTLOOK SPECIAL FOCUS - World Bank Documents
←
→
Page content transcription
If your browser does not render page correctly, please read the page content below

Public Disclosure Authorized

                               CAMBODIA ECONOMIC UPDATE
Public Disclosure Authorized
Public Disclosure Authorized

                               RECENT ECONOMIC DEVELOPMENTS
Public Disclosure Authorized

                               AND OUTLOOK

                               SPECIAL FOCUS
                               Upgrading Cambodia in Global Value Chains

                               NOVEMBER 2019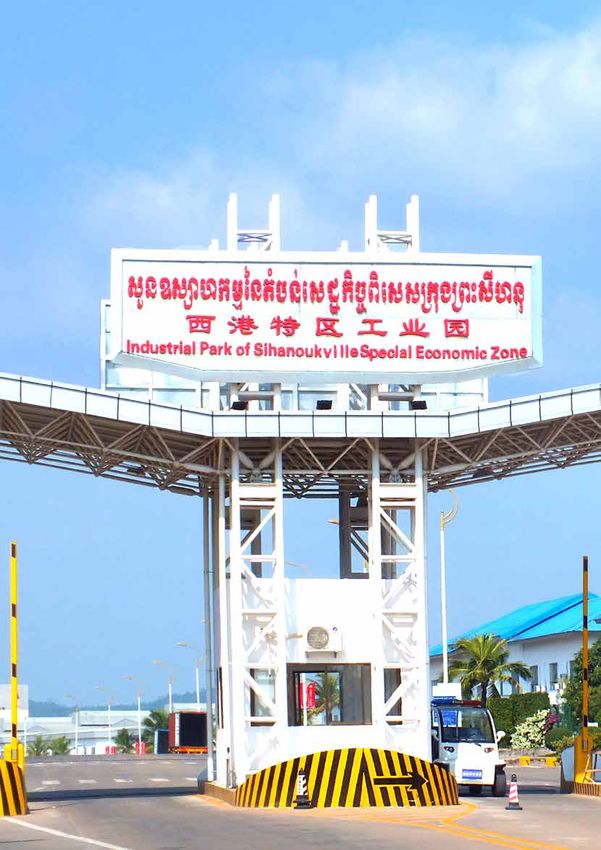
Cover photo: WDR
© Graphic Roots

CAMBODIA
ECONOMIC
UPDATE
  NOVEMBER 2019

Recent economic
developments and
outlook
TABLE OF CONTENTS

TABLE OF CONTENTS

     ACKNOWLEDGEMENTS������������������������������������������������������������������������������������������������������1

     ABBREVIATIONS������������������������������������������������������������������������������������������������������������������ 2

     EXECUTIVE SUMMARY������������������������������������������������������������������������������������������������������� 3

     RECENT ECONOMIC DEVELOPMENTS AND OUTLOOK������������������������������������������ 9
           Recent developments�������������������������������������������������������������������������������������������������������� 9
                 While slightly easing, growth remains robust����������������������������������������������������������������������������������������������9
                 The share of Cambodia’s exports to the US market is increasing���������������������������������������������������������12
                 While private investment rose, approved FDI eased��������������������������������������������������������������������������������12
                 Capital inflows have fueled rising domestic investment and consumption �����������������������������������������13
                 The current account deficit widened, but remained fully financed by FDI ����������������������������������������13
                 Vibrant construction activity continued, although FDI inflows eased �������������������������������������������������13
                 While visitor arrivals continued to increase, tourists visiting Angkor Wat temple declined ��������������14
                 Almost half of arrivals from China came for business purposes ���������������������������������������������������������16
                 Slower cultivation is due to less favorable weather conditions���������������������������������������������������������������16
                 Cambodia continued to make inroads into poverty reduction���������������������������������������������������������������19
                 Rural students performed less well, while maternal and child malnutrition remains
                 severe among the poor����������������������������������������������������������������������������������������������������������������������������������19
                 Inflation was subdued mainly on the back of easing food and petroleum prices�������������������������������20
                 The easing of foreign currency deposits slowed broad money growth������������������������������������������������21
                 The policy to promote the use of local currency is showing encouraging results�������������������������������21
                 The exchange rate remained broadly stable�����������������������������������������������������������������������������������������������23
                 Interest rates on riel-denominated loans declined, thanks to the promotion of local currency ������23
                 Credit growth accelerated and outstanding loans exceeded 100 percent of GDP������������������������������23
                 The construction and real estate sector received the largest share of bank credit������������������������������23
                 Cambodia has maintained adequate foreign reserve buffers, according to
                 the Financial Stability Review�����������������������������������������������������������������������������������������������������������������������24
                 Strong revenue collection has happened across-the-board���������������������������������������������������������������������25
                 Expenditure performance remained prudent��������������������������������������������������������������������������������������������26
                 The overall fiscal deficit is expected to remain steady at two-year lows ���������������������������������������������26

iv    CAMBODIA ECONOMIC UPDATE | NOVEMBER 2019
TABLE OF CONTENTS

            China is the largest creditor, accounting for half of Cambodia’s outstanding debt����������������������������28
            The European Union and the United States remain Cambodia’s largest export markets �����������������28
      Outlook�����������������������������������������������������������������������������������������������������������������������������29
            With slower global demand, the growth outlook is projected to ease ��������������������������������������������������29
      Risks���������������������������������������������������������������������������������������������������������������������������������30
            Risks are rising due to possible EBA withdrawal, a China slowdown, and
            a prolonged construction and property boom �����������������������������������������������������������������������������������������30
      Policy approaches to managing rising risks��������������������������������������������������������������������30

SPECIAL FOCUS: Upgrading Cambodia in Global Value Chains����������������������������������������33
      1. Introduction������������������������������������������������������������������������������������������������������������������33
      2. Lots of participation�����������������������������������������������������������������������������������������������������33
      3. Little progression ���������������������������������������������������������������������������������������������������������37
            Cambodia rapidly engaged in limited manufacturing tasks…�����������������������������������������������������������������37
            …with little diversifying or upgrading since����������������������������������������������������������������������������������������������38
      4. Moving to the next stage of participation��������������������������������������������������������������������42
            Economic fundamentals and policy choices determine participation���������������������������������������������������42
            More sophisticated polices support more sophisticated participation��������������������������������������������������43
            Deep trade agreements help�������������������������������������������������������������������������������������������������������������������������45
            Own protectionism is costly�������������������������������������������������������������������������������������������������������������������������46
            Human capital is vital������������������������������������������������������������������������������������������������������������������������������������46
      5. Technological change and the future of GVCs������������������������������������������������������������50

CONCLUSION����������������������������������������������������������������������������������������������������������������������� 51

ANNEX 1: Additional figures�������������������������������������������������������������������������������������������������52

ANNEX 2: Cambodia’s Key Indicators����������������������������������������������������������������������������������53

REFERENCES�����������������������������������������������������������������������������������������������������������������������54

ADDITIONAL REFERENCES���������������������������������������������������������������������������������������������54

                                                                                        CAMBODIA ECONOMIC UPDATE | NOVEMBER 2019                                       v
ACKNOWLEDGEMENTS

ACKNOWLEDGEMENTS

The 2019 April Cambodia Economic Update (CEU) was prepared by Sodeth Ly, with contribution from
Claire Honore Hollweg. Other contributors include Ekaterine Vashakmadze, Marong Chea, Linna Ky,
Kimsun Tong, and Runsinarith Phim. Saroeun Bou and Socheat Ath helped with the press release, logistic
support, web display, and dissemination events.
The team worked under the overall guidance of Deepak Mishra. The team is grateful for the advice and
comments provided by Gevorg Sargsyan and Inguna Dobraja. Several colleagues provided comments on
the draft version including Aaditya Mattoo, Andrew Mason, and Ergys Islamaj.
The team is grateful to the Cambodian authorities, particularly the Ministry of Economy and Finance
and the National Bank of Cambodia for their cooperation and support. The report also benefited from
the advice, comments and views of various stakeholders in Cambodia, including its enthusiastic readers
and critics.
The CEU, produced biannually, provides up-to-date information on macroeconomic developments in
Cambodia. It is distributed and discussed widely including among Cambodian authorities, development
partners, the private sector, think tanks, civil society organizations and academia.
For information about the World Bank and its activities in Cambodia, please visit our website at www.
worldbank.org/cambodia.
To be included in the email distribution list of the CEU and related publications, please contact Socheat
Ath (sath@worldbank.org). For questions on the content of this publication, please contact Saroeun Bou
(sbou@worldbank.org).
The findings, interpretations, and conclusions expressed in this report do not necessarily reflect the views
of the Executive Directors of the World Bank or the governments they represent. The World Bank does
not guarantee the accuracy of the data included in this work. The boundaries, colors, denominations, and
other information shown on any map in this work do not imply any judgment on the part of the World
Bank concerning the legal status of any territory or the endorsement or acceptance of such boundaries.

1   CAMBODIA ECONOMIC UPDATE | NOVEMBER 2019
ABBREVIATIONS

ABBREVIATIONS

AFTA         ASEAN Free Trade Agreement
ASEAN        Association of Southeast Asian Nations
Brexit       Withdrawal of the United Kingdom from the European Union
CEU          Cambodia Economic Update
CR           Cambodian riel
DSA          debt sustainability analysis
EAP          East Asia and Pacific
EBA          Everything But Arms
EC           European Commission
EMDEs        emerging markets and developing economies
EU           European Union
FCD          foreign currency deposit
GDP          gross domestic product
GVC          global value chain
HCI          Human Capital Index
IMF          International Monetary Fund
ILO          International Labor Organization
LPCO         Liquidity-Providing Collateralized Operation
MFA          multifiber agreement
NCD          negotiable certificate of deposit
NPL          nonperforming loan
OECD         Organisation for Economic Co-operation and Development
PISA         program for international student assessment
PPP          Public-private partnership
RMS          Revenue Mobilization Strategy
SDR          Special Drawing Rights
SME          small and medium-sized enterprise
UK           United Kingdom
UN           United Nations
US           United States
US$          United States dollar
VAT          value-added tax
WBG          World Bank Group
WDI          World Development Indicator
y/y or yoy   year-on-year

                                     CAMBODIA ECONOMIC UPDATE | NOVEMBER 2019       2
EXECUTIVE SUMMARY

EXECUTIVE SUMMARY

Recent developments                                    wage agriculture income were the main drivers
                                                       of poverty reduction in Cambodia during the
Cambodia’s economy continues to show
                                                       period 2009-17. In urban areas, declining non-
signs of robust growth, underpinned by solid
                                                       labor income increased poverty between 2009
export performance and strong domestic
                                                       and 2013, before rising and helping to reduce
demand. Key macroeconomic data for the first
                                                       poverty during 2013-17. Non-labor incomes were
six-months, however, indicate a slight deceleration
                                                       rising throughout the rural areas, contributing to
of economic activity this year, compared to a
                                                       poverty reduction in both subperiods. Remittance,
strong growth performance of 7.5 percent in
                                                       a subcomponent of non-labor income, continued
2018. Garment and footwear exports, accounting
                                                       to reduce poverty rates in both urban and rural
for about 70 percent of total merchandise exports,
                                                       areas. The share of remittances to total household
grew at 17.7 percent in 2018, but eased slightly to
                                                       income increased from 3 percent in 2009 to 12
15.3 percent (y/y) in June 2019.
                                                       percent in 2017 – among the poorest households.
Bustling construction activity has continued,          The contribution of transfer to poverty reduction
reflecting a sustained appetite for investment.        was very small, reflecting the weak public social
As a result, steel imports skyrocketed, rising 63.5    protection programs.
percent (y/y) in volume terms in June 2019,
                                                       The financial sector is playing an increasingly
up from 27.7 percent in 2018. During the first
                                                       important role in the economy. Bank credit
half of 2019, although the reported value of
                                                       growth accelerated to 28.3 percent (y/y) by
newly approved investment projects accelerated,
                                                       mid-2019, up from 24.2 percent in December
foreign direct investment (FDI) inflows, of which
                                                       2018. Reflecting the tapering of capital inflows,
about 40 percent originated from China, eased. The
                                                       growth in foreign currency deposits slowed down
tourism sector remained resilient; international
                                                       to 21.7 percent (y/y) by mid-2019, compared
arrival growth increased to 11.2 percent (y/y) in
                                                       with 25.8 percent in December 2018. However,
June 2019, compared with 10.7 percent in 2018,
                                                       accumulation of gross international reserves
with almost 40 percent of foreign visitors coming
                                                       accelerated, partly underpinned by initial success
from China.
                                                       in expansion of the use of local currency. Gross
Rising domestic consumption fueled by a                international reserves reached US$11.3 billion
surge in FDI inflows in recent years drove             (more than five months of import coverage) or
import growth. Imports of petroleum products           24.7 percent (y/y) in mid-2019, up from US$10.1
and motor vehicles rose by 91.0 percent and 18.5       billion or 15.8 percent (y/y) at the end of 2018.
percent, respectively. Thanks mainly to depressed
                                                       Fiscal performance continued to be
domestic food and oil prices, inflation continued
                                                       characterized        by     impressive    revenue
to be subdued, declining slightly to 1.4 percent
                                                       performance, due largely to continued
(y/y) in mid-2019, down from 1.6 percent in
                                                       improvements in customs and tax administration
2018. While being softly pegged at around 4,000
                                                       and bustling economic activity. Total revenue
riel per US dollar, the local currency depreciated
                                                       (including grants) reached 23.6 percent of GDP
slightly to 4,089 riel per US dollar in August 2019,
                                                       in 2018 and is projected to remain sustained at the
up from 4,018 riel per US dollar in December
                                                       same level in 2019. Despite continued pressures
2018, likely due to slower capital inflows.
                                                       from a rising public wage bill, government outlays
Growth in labor income was the key driver              are expected to remain contained at 24.2 percent
of poverty reduction in Cambodia. Income               of GDP in 2019. As a result, the overall fiscal
decompositions show that wage and non-                 deficit is anticipated to remain almost unchanged

3   CAMBODIA ECONOMIC UPDATE | NOVEMBER 2019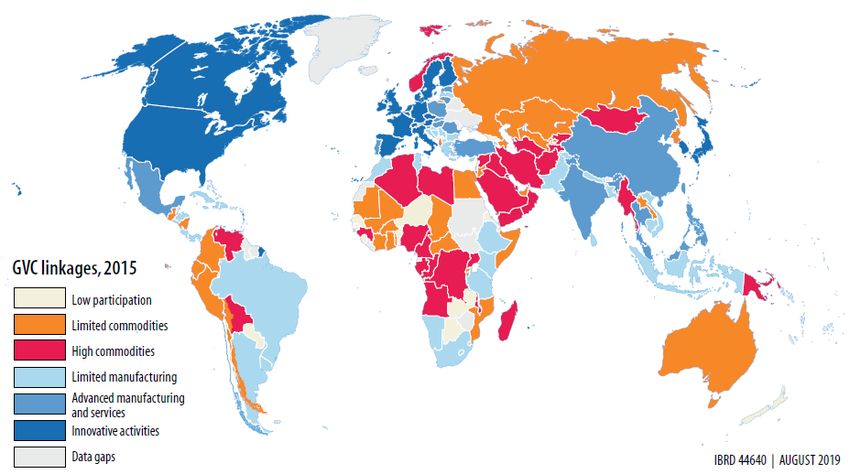
EXECUTIVE SUMMARY

at 0.6 percent of GDP in 2019, thanks to                                   to the EU and on the flow of FDI and tourists
continued strong revenue performance.                                      from China. Recently, high-frequency indicators
                                                                           have suggested a further moderation in economic
Outlook                                                                    activity in China. In addition, a prolonged
Cambodia’s exports are expected to moderate                                construction and property boom and the increase
with the easing of global demand, while                                    of credit provided to the construction and real
investment decelerates with sluggish capital                               estate sectors alongside rising indebtedness—
inflows due to slower projected growth in China.                           where combined bank and microfinance credit
The economy is therefore projected to ease                                 now accounts for over 100 percent of GDP—
gradually in the short to medium term. Growth                              also present a downside risk for Cambodia.
is expected to decelerate to 7.0 percent in 2019,                          The National Bank of Cambodia’s latest
down from 7.5 percent in 2018. The easing of                               financial stability review2 discussed potential
exports and continued strong growth in imports                             macroprudential policies both on the supply
will result in a widening of the country’s current                         and demand sides, while emphasizing
account deficit to 9.8 percent of GDP in 2019,                             the importance of effective interagency
up from 9.4 percent of GDP in 2018, but remain                             coordination. For a supply-side macroprudential
fully financed by foreign direct investment.                               policy, an example of a widely used tool in other
A relatively large fiscal stimulus to be financed                          countries is a sectoral capital requirement measure,
by government savings could be introduced                                  where higher risk weights could be imposed
in 2020 to mitigate the negative impacts of the                            on loans to construction and real estate-related
potential withdrawal of Everything But Arms                                sectors. To mitigate potential risks of speculation
(EBA). In February 2019, the European Union                                and to safeguard sound lending practices, demand-
(EU) launched the process that could lead to the                           side macroprudential measures have been under
temporary withdrawal of Cambodia’s preferential                            consideration. Equally important, fiscal policy
access to the EU market through the EBA initiative                         could be used to deal with potential vulnerabilities
in 2020.                                                                   in the real estate sector. For instance, last year,
                                                                           Singapore introduced property cooling measures
Poverty reduction is expected to continue.                                 by raising the rates of the Buyer’s Stamp Duty
Economic growth, particularly growth in labor                              currently levied on all purchases of properties,
income in the form of higher wage income,                                  except on its citizens and permanent residents
continues. Labor income has now become the                                 who are purchasing their first home.
main driver of poverty reduction. However, most
of the poor have wage incomes and low-paying                               Cambodia’s remarkable participation in global
jobs, signaling that low skills and productivity                           value chains (GVCs) began in the 1990s following
remain to be challenges. Inequality is on the rise                         the arrival of the export-oriented garment and
in both urban and rural areas, with the largest                            footwear industry. GVC participation grew faster
increase in the rural areas.                                               in Cambodia than in other regional countries such
                                                                           as Malaysia, Thailand and Vietnam as well as other
Risks and challenges                                                       developing countries such as Bangladesh and Sri
                                                                           Lanka, although from a low base. The recent years
Downside risks, arising from domestic and
                                                                           however are marked by stagnation. Unlike other
external factors, have intensified.1 A possible
                                                                           countries in the region, Cambodia has not been able
withdrawal of the EBA initiative, as well as a
                                                                           to transition to the next stage of GVC participation
sharp slowdown in the Chinese economy (a
                                                                           of advanced manufacturing and services. Instead,
potential outcome of continued U.S.-China trade
                                                                           there has been little diversification into other value
tensions), could substantially dampen growth
                                                                           chains, but also little upgrading within existing
prospects, given Cambodia’s reliance on exports
                                                                           value chains.
1
    EBA withdrawal (and fiscal stimulus) is not factored in.
2
    https://www.nbc.org.kh/download_files/publication/fsr_eng/FSR-for-publication-final-22Apr2019.pdf

                                                                               CAMBODIA ECONOMIC UPDATE | NOVEMBER 2019          4
EXECUTIVE SUMMARY

FDI inflows, a large pool of low-skill and             facilitate trade by lowering logistics costs and
low-wage labor, and preferential access to key         supporting businesses with a six-day reduction in
exports markets are behind Cambodia’s rapid            the number of publicly observed holidays in 2020.
integration into limited manufacturing GVCs.
                                                       Human capital accumulation is vital for
Global experience shows that transitioning to
                                                       countries’ integration in more complex GVCs.
limited manufacturing GVCs from primary
                                                       Countries that are human-capital abundant
product specialization typically requires FDI,
                                                       tends to export products that are more human-
competitive labor costs, addressing business
                                                       capital intensive. Cambodia’s export basket
climate constraints, assuring basic political
                                                       not only contains products that employ fewer
stability and rule of law, and timely access to
                                                       skilled workers than the products exported by
imported inputs. Advanced manufacturing GVCs
                                                       comparator countries, but Cambodia has also
typically require a more educated workforce and
                                                       seen less progression towards more skill intensive
improvements in managerial practices and technical
                                                       products over the past decade than comparator
skills. Improved access to finance for domestic
                                                       countries.
firms, more advanced logistics, competitive energy
costs, access to more sophisticated services inputs,   To move to the next stage of participation, a
and enhanced contract enforcement are needed           much more sophisticated policy mix is
for these advanced manufacturing and services          needed. First, expand and deepen trade
sectors. Policy predictability, in addition to         agreements to go beyond issues of market access
macroeconomic stability, becomes an increasingly       and national treatment. Second, lower barriers to
important dimension of governance. Improving           trade and connect to markets to expand
the country’s external competitiveness through         Cambodia’s small domestic market size and gain
increased productivity in the presence of rising       access to the inputs needed for production. Third,
wages is therefore imperative. Cambodia’s ranking      continue improving the education and skills of
in the ease of doing business index continued to       Cambodia’s labor force. Fourth, harness the digital
slip, declining to 144th in 2019, down from 127th      economy to support firms to integrate into GVCs
in 2016, when the country’s ranking improved,          through digital platforms as well as connect value
compared with its 135th ranking in 2015. The           chain participants.
authorities recently introduced measures to

5   CAMBODIA ECONOMIC UPDATE | NOVEMBER 2019
CAMBODIA’S RECENT DEVELOPMENTS AT A GLANCE
Real growth is projected to decelerate… … as key exports eased…
Real growth (percent) Garment and footwear exports (y/y, percent change)
7�6 30
7�5 25
7�5
7�4 7�4 20
7�3
7�3 15
7�2 7�1 10
7�1
7�1 5
7�0 7�0 7�0
7�0 7�0 0
6�9 -5
6�8 -10
6�7 -15
p
9/
Jul-17
Sep-17
Nov-17
Mar-17
May-17
Mar-18
Jul-18
Sep-18
Nov-18
Mar-19
Jan-17
Jan-18
May-18
Jan-19
May-19
11 12 13 14 15 16 17 18 1
20 20 20 20 20 20 20 20 20
… construction sector expansion, however …underpinned by accommodative broad money
continued…Construction materials and steel Broad money (y/y, percent change)
imports (y/y, percent change)
30
Other materials Steel imports
100
Cement imports Cooling equipment 25
80
60 20
40 15
20
10
0
-20 5
-40 0
Dec-13 Dec-14 Dec-15 Dec-16 Dec-17 Dec-18 Jun-19
Feb-18
Feb-19
May-18
Jun-18
Jul-18
Aug-18
Sep-18
Oct-18
May-19
Nov-18
Dec-18
Jun-19
Jan-18
Mar-18
Jan-19
Mar-19
Apr-18
Apr-19
…with increased lending to the construction sector Government deposit (savings) increased further
Contribution to credit growth of lending to the Government deposit at the banking system
construction and real estate sector (percentage points) (percent of GDP)
20
12
18
10
16
8 14
6 12
4 10
2 8
0 6
-2 4
-4 2
0
Oct-12
Jul-14
Feb-15
Aug-11
Sep-15
Nov-16
Aug-18
Jan-11
Jan-18
Dec-13
Apr-16
Jun-10
Mar-12
May-13
Jun-17
Mar-19
Jun-05
Jun-06
Jun-07
Jun-08
Jun-09
Jun-10
Jun-11
Jun-12
Jun-13
Jun-14
Jun-15
Jun-16
Jun-17
Jun-18
Jun-19
Sources: Cambodian authorities and World Bank staff estimates and projections.
Note: p = projection.Section I Recent Economic Developments and Outlook
Recent Economic Developments and Outlook

Recent Economic Developments and Outlook
Recent developments                                                        a sharp deceleration of industrial activity has
                                                                           been observed in July. Growth moderated to 6.3
While slightly easing, growth remains robust
                                                                           percent year-on-year in the first half of 2019 from
Growth continues to remain robust in 2019,                                 6.8 percent in the first half of 2018, reflecting
underpinned by strong performance in the                                   weaker exports and private investment growth.
garment, construction and tourism sectors.                                 Most other major regional economies experienced
Key macroeconomic data for the first six                                   growth slowdowns. Activity in the smaller regional
months, however, indicate a slight deceleration                            economies, however, remained robust.
of economic activity this year, compared with
                                                                           There was a slight deceleration of Cambodia’s
a better-than-expected growth performance of
                                                                           garment and footwear exports, which grew at
7.5 percent in 2018 (figure 1). While economic
                                                                           15.3 percent in June 2019, compared with 2018’s
growth is projected to ease to 7.0 percent in 2019,
                                                                           17.7 percent y/y uptick (figure 2). Disaggregating
Cambodia is likely to remain the fastest-growing
                                                                           the export data shows that while garment exports
economy in the developing East Asia and Pacific
                                                                           slightly eased to 14.7 percent y/y, down from 17.6
(EAP) region.
                                                                           percent in 2018, footwear exports accelerated,
Growth in developing EAP slowed in the first                               reaching 20.0 percent y/y in June 2019, compared
half of 2019.3 Regional growth declined from                               to 19.2 percent in 2018. As a result, the share
6.5 percent year-on-year (y/y) in the first half of                        of footwear products in the total garment and
2018 compared to 6.0 percent y/y in the first half                         footwear exports rose gradually to 12.0 percent in
of 2019, reflecting a broad-based deceleration                             June 2019, compared to only 11 percent in 2018
(see box 1). Intensifying trade disputes with the                          and 10.8 percent in 2017. The deceleration was
United States weighed down on China’s economic                             the result of slow external demand. In the first of
growth, which continues to soften amid a                                   half of 2019, US retail sales, gauging US domestic
planned rebalancing of the economy towards                                 demand, eased. The retail trade (excluding
a consumption-led growth. China’s economic                                 automobiles) monthly sales for companies in the
growth slowed in the first half of 2019, and                               retail trade and food services sectors, decelerated

Figure 1: Contribution to real growth                                      Figure 2: Garment and footwear exports
(percent)                                                                  (US$ million)

             Agriculture                    Indus-garment & footwear                     Garment exports
             Indus-construction             Indus-others                   1,200         Footwear exports                       30
             Serv-hotels & rests            Serv-others                                  Total (YTD, y/y percent change, RHS)
             Taxes less subsidies           GDP growth                                                                          25
                                                                           1,000
    8                                                                                                                           20
           7�1        7�0           7�0       7�0          7�5
                                                                     7�0    800                                                 15
    6                                                                                                                           10
                                                                            600
                                                                                                                                5
    4
                                                                            400                                                 0
                                                                                                                                -5
    2                                                                       200
                                                                                                                                -10

    0                                                                          0                                                -15
                                                                                    Jul-16

                                                                                    Jul-17

                                                                                    Jul-18
                                                                                   Jan-16

                                                                                   Oct-16
                                                                                   Jan-17

                                                                                   Oct-17

                                                                                   Oct-18
                                                                                   Jan-19
                                                                                   Apr-16

                                                                                   Apr-17

                                                                                   Jan-18
                                                                                   Apr-18

                                                                                   Apr-19

        2014       2015       2016         2017     2018         2019/p

Source: Cambodian authorities.                                             Source: Cambodian authorities.
Note: p = projection.                                                      Note: RHS = Right-hand scale.

3
        World Bank 2019d.

9        CAMBODIA ECONOMIC UPDATE | NOVEMBER 2019
Recent Economic Developments and Outlook
Box 1.
Global and Regional Outlook and Risks1
Global growth is expected to remain subdued over is contributing to heightened policy uncertainty, which
the forecast horizon. The global economic growth rate is expected to dent confidence and investment. Barring a
is projected to slow to 2.5 percent in 2019, reflecting a renewed escalation of trade tensions, global trade growth is
broad-based weakness in advanced economies and major projected to weaken from 4.1 percent in 2018 to 1.9 percent
emerging market and developing economies (EMDEs). in 2019, and then recover modestly to 2.2 percent in 2020.
Global growth is projected to remain flat in 2020 before (figure B1.2). This forecast is predicated on policy support
strengthening insignificantly to 2.6 percent in 2021 (figure measures implemented in major economies and firmer
B1.1). Growth in advanced economies is projected to domestic demand in some EMDEs. This modest rebound
moderate from 2.2 percent in 2018 to 1.5 percent on notwithstanding, global trade is expected to be weaker than
average during 2019–21, reflecting a sharp deceleration in previously envisaged over the forecast horizon, reflecting
trade, investment, and manufacturing. Growth in EMDEs a softer outlook for global investment and evidence of a
is projected to slow to 3.7 percent in 2019 before recovering lower income elasticity of trade.
to 4.2 percent in 2020 as earlier headwinds in some
Global financing conditions are expected to remain
countries ease. This forecast in predicated on the waning
volatile, even if generally more supportive. This reflects
impact of earlier financial pressures currently weighing on
more accommodative monetary policy stances adopted
activity in some large EMDEs and no major deterioration
by the major central banks in the near term due to the
in the global environment (for example, Argentina, Brazil,
deteriorating global growth prospects. Despite the recent
Russia, and Turkey) and no major deterioration in the global
recovery of EMDE markets from the 2018 correction
environment.2
episode, there is still a considerable risk of “monetary
Global economic conditions are expected to remain shocks” associated with the global policy uncertainty.
challenging over the forecast period. The increase in Financial market volatility will continue to have the
tariffs by China and the United States that were announced strongest impact on countries with high vulnerabilities,
over during 2019 will have more severe effects than the weak growth prospects, and elevated policy uncertainty.
tariff hikes implemented in 2018. Beyond economic losses The eventual rise of advanced-economy yields will have
for the affected exporters, the re-escalation of trade tensions a negative impact on capital flows to EMDEs. Policy
Figure B1.1: Real GDP growth Figure B1.2: Global trade volume growth
(percent) (percent)
World 2000-18 average
Advanced economies 6
Emerging and developing economies
12 EAP
10 4
8
6
4
2 2
0
-2
-4
0
2021f
2009
2010
2018
2019-20f
2007-08
2011-17
2019f
2016
2017
2018
2020
2021
Source: World Bank. Source: World Bank
Notes: Working assumptions. Updated global projections Notes: Working assumptions. Updated global projections
will be published in Global Economic Prospects, January will be published in Global Economic Prospects, January
2020 (forthcoming). 2020 (forthcoming).
1
This box was prepared by Ekaterine Vashakmadze, PG.
2
These are working assumptions, which will be finalized and published in the June 2019 Global Economic Prospects, World Bank.
CAMBODIA ECONOMIC UPDATE | NOVEMBER 2019 10Recent Economic Developments and Outlook
uncertainty, geopolitical risks, and security concerns could in the region is projected to remain robust in the near term,
also continue to adversely impact EMDE capital inflows. underlying potential growth—which has fallen considerably
over the past decade, in large part reflecting slowing
Modest declines are forecast for global commodity prices.
potential growth in China—is likely to decline further over
Oil prices are expected to average US$60 per barrel
the long term, largely owing to deteriorating demographic
in 2019 and 2020, with high uncertainty around the
trends, especially in China, Thailand, and Vietnam.
outlook. Overall, metals prices are expected to decline
slightly in 2019 and 2020, reflecting a weaker outlook for Risks continue to be firmly on the downside. There is
global metals demand. Agricultural prices are expected to considerable uncertainty around the outlook for the global
remain broadly flat in 2020 (figure B1.3). economy. The balance of risks remains firmly on the downside
and has recently intensified, reflecting the re-escalation of
Growth in the region is projected to slow from 6.3
trade tensions amid heightened global uncertainty. Although
percent in 2018 to 5.8 percent on average in 2019-20,
unlikely in the near term, the simultaneous occurrence of a
and to ease further to 5.6 percent by 2021. This outlook
sharper-than-expected slowdown in China, the Euro Area,
assumes no further escalation of trade tensions between
and the United States could trigger a significant downturn in
China and the United States, slightly lower commodity
global activity. The further escalation of trade tensions could
prices, and supportive global financing conditions, especially
be highly disruptive to global activity amid the presence of
in the near term. The baseline also assumes that the fiscal
complex value chains. The risk of severe and broad-based
and monetary policy support in China and the other major
financial stress adversely affecting the outlook for EMDEs
regional economies would partly mitigate the impact of
remains high amid elevated debt levels in many countries.
heightened policy uncertainty and weak global demand on
Policy uncertainty and geopolitical risks remain high, and
the regional growth. Growth in China is projected to slow
could negatively impact confidence and investment in
to 6.1 percent in 2019 and ease further to 5.9 percent in
both affected countries and globally. Policy uncertainty is
2020 and 5.8 percent in 2021 amid continued domestic and
particularly elevated in a number of European countries,
external headwinds (figure B1.4). Growth in the rest of the
including the United Kingdom as it transitions out of the
region is projected to decline to 4.9 percent in 2019 and
European Union.
stabilize at 5 percent on average in 2020-21. While growth
Figure B1.3: World commodity price forecast Figure B1.4: Regional growth
(Index=nominal U.S. dollars, 2010=100) (percent)
2018 2019f 2020f
130 8
7
110
6
90 5
4
70
3
50 2
1
30 0
Lao
China
Vietnam
Mongolia
Thailand
10
Myanmar
Cambodia
Malaysia
1980
1985
1990
1995
2000
2005
2010
2015
2020
Source: World Bank. Source: World Bank.
Notes: Working assumptions. Updated global projections Notes: Working assumptions. Updated global projections
will be published in Global Economic Prospects, January will be published in Global Economic Prospects, January
2020 (forthcoming). 2020 (forthcoming).
11 CAMBODIA ECONOMIC UPDATE | NOVEMBER 2019Recent Economic Developments and Outlook
to 1.6 percent y/y in June 2019, compared to 5.9 market flattened, growing at 1.7 percent y/y in
percent in 2018 (figure 3).4 June 2019, down from 5.3 percent in January. The
share of Cambodia’s exports to the EU is expected
The share of Cambodia’s exports to the US
to shrink further, if EBA suspension occurs next
market is increasing
year. Boosted by the U.S. duty-free access granted
While the EU had been the most important on June 30, 2016,6 investment projects in the
market for Cambodia’s garment and footwear production of travel goods (luggage, backpacks,
exports during the past several years, the share handbags, and wallets) has skyrocketed. Approved
of the US market has expanded rapidly since foreign direct investment projects in the travel
2018, reaching 31 percent by June 2019, overtaking goods sector rose to US$202.5 million in the first
the EU market (excluding the UK), which shrunk eight months of 2019, up from US$50 million in
to only 30 percent during the same period (figure 4). 2018. The total number of factories producing
The recent expansion of the U.S. market share may travel goods reached 105 factories in August 2019,
have contributed in part by trade diversion resulting up from 67 factories in 2018.7
from the US-China trade war. As bilateral China-
While private investment rose, approved FDI
U.S. trade of tariff-affected products has declined,5
eased
Chinese and U.S. imports of such products from
other destinations have grown. Developing East Foreign direct investment (FDI) commitments
Asian exporters also benefited: Vietnam and (approved FDI projects) has slowed in the first
Malaysia feature among the top five beneficiaries half of 2019, compared to 2018. During the
in Chinese and U.S. markets, respectively, while first six months of 2019, the value of approved
Cambodia (from the United States) and Mongolia investment (domestic and FDI) projects increased
(from China) enjoyed relatively small gains in to US$4.6 billion or about a 60 percent y/y
absolute terms but significant gains relative to increase. During the same period, approved FDI
their GDP. While remaining solid, Cambodia’s inflows eased to US$1.0 billion, compared with
garment and footwear exports to the U.S. market US$2.4 billion in 2018. FDI commitments going to
eased, expanding at 38.7 percent y/y in June 2019, the agriculture and food processing (non-garment)
down from 51.6 percent y/y in January. During industries, and wholesale and retail sectors eased.8
the same period, the country’s exports to the EU In the real sector, private investment continued to
Figure 3: U.S. retail sales and Cambodia’s Figure 4: Garment and footwear exports by
exports to the United States main destination
(y/y, percent change) (YTD, percent of total)
Garment exports to the US US market EU (excl UK) market UK market
US retail sales (RHS)
100 12
35
80 10
30
60 8
25
40 6
20
20 4
15
0 2
10
-20 0
5
-40 -2
0
Dec-11
Dec-12
Dec-13
Dec-14
Dec-15
Dec-16
Dec-17
Dec-18
Jun-11
Jun-12
Jun-13
Jun-14
Jun-15
Jun-16
Jun-17
Jun-18
Jun-19
Dec-16 Dec-17 Dec-18 Jun-19
Source: Cambodian authorities and United States Census Bureau. Source: Cambodian authorities.
Note: U.S. retail sales excluding auto and parts dealers. Note: YTD = year-to-date.
4
Retail Trade, ex Auto: U.S. Total, Not Seasonally Adjusted Sales, US Census Bureau.
5
World Bank 2019d.
6
For more detail, see https://kh.usembassy.gov/duty-free-access-travel-goods-made-cambodia/
7
Monthly report (August 2019), Ministry of Industry and Handicraft.
8
Annual Report, 2018, the National Bank of Cambodia
CAMBODIA ECONOMIC UPDATE | NOVEMBER 2019 12Recent Economic Developments and Outlook
flow to the construction, real estate, and tourism import growth. Imports of steel skyrocketed to
sectors, which together accounted for about three- 63.5 percent y/y in volume terms, up from 27.7
quarters of total (approved) investment during the percent in 2018, while other construction materials
first six months of 2019. The construction boom rose by 87.1 percent y/y (figure 6).
has also fueled growing supporting industries,
The current account deficit widened, but
factors, and small and medium sized enterprises
remained fully financed by FDI
mostly owned by Chinese investors to manufacture
and supply building material, furniture, metal, and The easing of exports and continued strong
plastic products. growth in imports will result in a widening
of the country’s current account deficit to 9.8
Capital inflows have fueled rising domestic
percent of GDP in 2019, up from 9.4 percent
investment and consumption
of GDP in 2018, which remains fully financed by
A surge in capital inflows that Cambodia FDI. Although merchandise exports eased, net
experienced in the past several years has services exports rose, largely boosted by travel
underpinned domestic investment and service receipts resulting mainly from tourism
consumption. Cambodia is among the most receipts. Current transfers were supported by
successful countries in attracting FDI with FDI workers’ remittances (net), estimated to reach
inflows accounting for an average of 11.9 percent about US$1.0 billion in 2018. Continued FDI
of GDP a year during the post-global financial crisis. inflows financed the current account deficit. FDI
With continued upbeat consumer and investor inflows and the injection of local currency allowed
confidence, domestic demand has sustained the central bank to continue to accumulate more
and been met by a surge in imports. During the international reserves, which reached US$11.3
first six months of 2019, imports of petroleum billion by June 2019, or 24.7 percent y/y, covering
products and motor vehicles rose by 91.0 percent more than five months of prospective imports.
and 18.5 percent, respectively (figure 5). To meet
continued strong domestic demand, consumption Vibrant construction activity continued,
although FDI inflows eased
goods imports such as foodstuff, electronics and
medicines also increased, rising by 27 percent, 87.5 During the first six months of 2019, approved
percent, and 14.7 percent, respectively. Similarly, residential and commercial development
bustling construction activity driven by upbeat projects amounted to US$3.4 billion, or a
investor confidence fueled construction materials whopping 56.5 percent y/y increase. In addition
Figure 5: Imports of durable goods and Figure 6: Construction materials and steel
petroleum products accelerated imports skyrocketed
(y/y, percent change) (y/y, percent change)
140
Passenger cars Diesel 100 Other materials Steel imports
120 Gasoline Motocycles Cement imports Cooling equipment
100 80
80 60
60
40
40
20 20
0 0
-20
-20
-40
-60 -40
Dec-13 Dec-14 Dec-15 Dec-16 Dec-17 Dec-18 Jun-19 Dec-13 Dec-14 Dec-15 Dec-16 Dec-17 Dec-18 Jun-19
Source: Cambodian authorities. Source: Cambodian authorities.
13 CAMBODIA ECONOMIC UPDATE | NOVEMBER 2019Recent Economic Developments and Outlook
to the two largest cities of Phnom Penh and Siem Visitors from the Republic of Korea declined by
Reap, international gateway cities such as the 20 percent (reflecting also a drop in South Korean
seaside town of Sihanoukville, the Cambodia- investment in Cambodia), and the country is now
Vietnam and Cambodia-Thailand economic ranked fifth, accounting for 4.2 percent of total
corridors of Bavet and Poi Pet have also been international arrivals. Arrivals from Japan ranks
experiencing construction booms. The most rapid sixth, accounting for 3.0 percent, with a 3 percent
increase in construction activity has been in the y/y increase. As a result, Cambodia’s tourism
provincial capital of Sihanoukville which received sector continues to be dependent on tourists
US$1.0 billion of approved construction projects from Asia and Pacific which cover 82 percent of
during the first six months of 2019, compared to international arrivals, while those from Europe
US$1.08 billion in investment for the entire 2018. and the Americas capture only 12.4 percent and
As a result, Sihanoukville is being transformed into 5.7 percent, respectively.
an industrial boomtown with bustling investment,
The coastal regions are rapidly emerging
trade and tourism activity, supported by a nearby
visitor destinations, especially the provincial
international airport and the country’s largest
town of Sihanoukville. During the first six months
seaport. An expressway linking it to the capital
of 2019, international arrivals to Sihanoukville
city of Phnom Penh is under construction.9
skyrocketed, and the bustling town received about
While visitor arrivals continued to increase, 300,000 visitors, or a huge 357.5 percent y/y
tourists visiting Angkor Wat temple declined increase (see box 2). As a share of international
visitors to Cambodia, foreign tourists visiting
Driven largely by rising numbers of Chinese
Phnom Penh (and surroundings) rose to 50
visitors, international arrivals accelerated to
percent in 2019, up from 46 percent in 2018, due
11.2 percent y/y, up from 10.7 percent in 2018
to a rising share of visitors coming to Cambodia
(figure 7). Similar to the rising share of Chinese
for business purposes.
FDI inflows, Chinese visitors account for almost
40 percent of total international arrivals or However, tourists visiting Angkor Wat temple
1.3 million tourists during the first six months declined by 8.3 percent y/y during the first
of 2019. Arrivals from Vietnam, Lao PDR, 6 months of 2019. Foreign tourists arriving at
and Thailand remained the next three largest, Siem Reap International Airport declined for the
capturing 12.0 percent, 6.1 percent, and 5.2 first time since the 2008/09 global financial crisis.
percent of total international arrivals, respectively. Arrivals at Siem Reap dipped by 5.5 percent in
Figure 7: Tourist arrivals to Cambodia, Figure 8: International arrivals to Siem Reap
Thailand, and Vietnam Airport
(y/y, percent change) (YTD, y/y, percent change)
Thailand Cambodia Vietnam
60
35
50
30
25 40
20 30
15 20
10 10
5
0
0
-10
-5
-10 -20
-30
Jun-19
Dec-10
Dec-11
Dec-12
Dec-13
Dec-14
Dec-15
Dec-16
Dec-17
Dec-18
Nov-06
May-09
Nov-11
May-14
Jan-06
Sep-07
Jul-08
Jan-11
Sep-12
Jul-13
Jan-16
Nov-16
Sep-17
Jul-18
May-19
Mar-10
Mar-15
Source: Cambodian authorities. Source: Cambodian authorities.
Note: YTD = year-to-date.
9
For more on the Phnom Penh - Sihanoukville expressway, see http://www.mpwt.gov.kh/kh/public-works/expressways
CAMBODIA ECONOMIC UPDATE | NOVEMBER 2019 14Box 2.
Tourist attraction destinations: the emergence of Sihanoukville and the decline of Siem Reap
While the Angkor temple complex and Phnom Penh significant resources for tourism that are diverse and well
are still the main destinations, Sihanoukville has placed to be a pillar for socioeconomic development, the
recently emerged as a key attraction site. During the first country was ranked low, at 98th in 2019 on the travel and
six months of 2019, international arrivals to Sihanoukville tourism competitiveness index, compared to its neighbors,
skyrocketed, and the rapidly growing town received about namely Lao PDR (97th), Vietnam (63rd) and Thailand (31st).
300,000 visitors (figure S2.1) or a whopping 357.5 percent This may indicate that the tourism sector needs boosting.
y/y increase. The Sihanoukville International Airport
Repeat visits by foreign tourists to Cambodia improved
welcomed over 650,000 passengers (inbound and outbound)
slightly, rising from 16.2 percent in 2013 to 21.3 percent
in 2018 and has experienced an intensive acceleration of its
in 2018 (but remained nowhere near Thailand, whose repeat
growth with triple-digit figures every year since 2016 with
visits are for 60 to 70 percent2). However, there are some
the opening of new international routes, especially to and
worrying trends. For example, length of stays remains short
from Chinese cities, and between Sihanoukville and regional
and have not changed much—5.4 days in 2013 to 6.4 days
metropolises like Kuala Lumpur and Ho Chi Minh City.
in 2018;—value captured per tourist has declined—from
The extension of the airport’s runway to 3,300 meters is
US$809 in 2013 to US$552 in 2018;—low-end businesses
launched, while studies are underway for the building of
have mushroomed; and there are signs of degradation of
a new passenger terminal scheduled to be commissioned
the key assets at the Angkor temples. In addition, during
in mid-2022.1 The surge in international arrivals to
the post-global financial crisis period, Cambodia’s tourist
Sihanoukville, however, appears to be fueled particularly by
arrivals growth decelerated, averaging 12 percent a year,
an investment boom, with bustling construction activity.
compared to 20 percent per year in the pre-global financial
Figure B2.1: International arrivals to Cambodia’s crisis period. Recently, Cambodia’s tourist arrivals have
main airports become increasingly dependent on Chinese visitors, which
Phnom Penh Siem Reap Sihanoukville captured 32.6 percent of total arrivals with the y/y growth
2,500,000 rate surging to 67.2 percent in 2018.
2,000,000 A 2017 study provided substantial anecdotal
1,500,000
evidence that there is little formal integration by
tourism enterprises along the vertical value chain.3
1,000,000 Destination management companies operating or owning
500,000 accommodation and transport companies do not exist,
and at most, tourism enterprises have two outlets (Phnom
-
Jan-Jun 2016 Jan-Jun 2017 Jan-Jun 2018 Jan-Jun 2019
Penh and Siam Reap), often managed as a single entity.
This reflects the way Cambodia is being offered to visitors,
Source: Cambodian authorities. with limited overland travel and product development by
In contrast, international arrivals by air to Cambodia’s operators around established destinations. Insufficient
most visited attraction site of Siem Reap declined. Since transport infrastructure and weak environmental services
early this year, the number of tourists visiting Siem Reap hold back sustainable and more inclusive tourism growth,
has started to decline for the first time since the 2008/09 as many secondary destinations are unable to attract private
global financial crisis. By mid-2019, tourist arrivals to Siem investment in quality tourist service infrastructure. This calls
Reap, where the (World Heritage) Angkor temple complex for immediate action to address the major constraints which
is located, dipped by 5.5 percent y/y, although total tourist appear to be insufficient public and private funding, weak
arrivals by air to the three main airports grew by 17.4 coordination among tourism industry stakeholders, and
percent (total international arrivals to the country grew by low capacity to design and implement effective destination
11.2 percent). While Cambodia is endowed with globally marketing campaigns.
1
See https://corp.cambodia-airports.aero/en/press-release/cambodia-airports-won-award-marketing-sihanoukville-airlines
2
See https://www.travstore.com/how-to-construct-itinerary-for-repeat-travelers-to-bangkok/
3
See Selected Issue section on maximizing tourism potential, October 2017 Cambodia Economic Update
15 CAMBODIA ECONOMIC UPDATE | NOVEMBER 2019Recent Economic Developments and Outlook
the year to June 2019, compared to increases of countries—Cambodia, Vietnam and Thailand.
6.5 percent and 20.8 percent in 2018 and 2017, During the same period, Thailand and Vietnam
respectively (figure 8). As a share of international received 19.7 and 8.5 million tourists, respectively.
visitors arriving by air to Cambodia, tourists Investing more toward the provision of sufficient
coming to Siem Reap declined to 40.4 percent and well-functioning public tourism infrastructure,
in 2019, compared to 47.3 percent in 2018 and while improving cooperation between commercial
55.0 percent in 2017. While it is a bit too earlier and public entities, is likely needed to tap into this
to draw any conclusions, the declining number growing tourism market located at Cambodia’s
of foreign visitors to Angkor Wat may indicate doorstep. For instance, a large investment plan
that the temple in Siem Reap, which had been (2016-20) of US$24.0 billion (of which the state
the country’s largest tourist attraction site, can budget accounts for 8 to 10 percent) is being
no longer continue to attract tourists without implemented by Vietnam to build and upgrade
additional products. In this regard, the authorities tourism and transport infrastructure in provinces
are studying the tourism master plan for Siem with key tourist landmarks.10
Reap province and have identified new potential
Slower cultivation is due to less favorable
tourism products, particularly in Kulen Mountain,
weather conditions
the Tonle Sap area, and the areas located within
the temples of Angkor. However, it is likely that Official statistics indicate that this year’s
additional investment in tourism infrastructure, cultivation of rainy season rice and
services, and products will be needed. supplemental and industrial crops was slower
than last year.11 By July 2019, rainyseason rice
Almost half of arrivals from China came for
cultivation reached 2.1 million hectares, which is
business purposes
0.13 million hectares below 2018’s cultivated area.
In the first half of 2019, 42 percent of arrivals This amounts to 81.8 percent of the authorities’
from China came to Cambodia for business target. However, the authorities are committed to
purposes, compared to only a quarter in 2018. boosting agriculture cultivation to meet this year’s
Visitors coming to Cambodia for business targets by providing agriculture extension services
purposes increased to 21.0 percent in June 2019, focusing on arable land areas ready for cultivation.
up from 11.1 percent in December 2018 (figure Specifically, several measures have reportedly been
9). This indicates that Cambodia is increasingly introduced in this regard. They include training for
attractive to (Chinese) investors, with their rising extension officials and farmers, seed production,
share of the total international arrivals. This is research and development, contract farming
consistent with the rising share of FDI inflows expansion including markets for agricultural
from China that has supported the construction products. Rice production continues to play an
boom, as well as newly flourishing trade and important role in Cambodia’s agriculture sector
investment activities established by Chinese as it accounts for about half of agriculture GDP,
small and medium-sized enterprises focusing of which rainy season rice production covers 75
primarily on building material, furniture, office percent and dry season rice production covers the
equipment and household appliance products rest.
serving the newly constructed properties.
Rice production for 2018 increased to 10.8
Substantial untapped potential in tourism million metric tons or 3.5 percent y/y (figure
remains. During the first six months of 2019, 10). This was 0.37 million metric tons higher
Cambodia received 3.34 million foreign tourists, than production in 2017, even though it was
but this accounts for a mere 10.5 percent of affected by midseason drought and floods in
total international arrivals to the three regional some parts of the country. Of the 0.37 million
10
Decision No. 201/QD-TTg of January 22, 2013, approving the master plan on development of Vietnam’s tourism through 2020, with a vision toward
2030.
11
July 2019 report on agriculture, fisheries and forestry, dated August 16, 2019, Ministry of Agriculture, Fisheries and Forestry.
CAMBODIA ECONOMIC UPDATE | NOVEMBER 2019 16Recent Economic Developments and Outlook
ton increase, 0.21 million tons was a result of There is untapped potential that could be
increased yield and 0.16 million tons a result of exploited to diversify agriculture products as
land expansion (figure 11). Thus, in 2018, the well as to expand livestock production, given
improvements in yields reflect better or more increased market demand for animal products
efficient use of agricultural inputs. Yields of wet as household incomes rise. Rising income and
and dry season rice production increased by 1.7 urbanization and a rapid expansion of the
percent and 1.0 percent, respectively. However, tourism sector have led to rising demand for
annual rice production growth halved, expanding animal products. Domestically, this is reflected
at 4.1 percent after the global financial crisis, in the elevated (and past rapid increases in the)
compared with 8.3 percent before global financial consumer price indexes for animal products
crisis. Cambodia exports only about 17 percent such as beef, poultry, fish and seafoods, while
of its rice surplus in the form of milled rice. Its consumer price indexes for cereals such as rice
production of cassava (13.5 million tons) has have remained subdued (figure 12). This is also
until recently been exported unprocessed.12 This true for exports due to expansion of the Asian
indicates that much could be gained in terms of and Chinese middle class. However, during the last
value added if the country were able to process decade or so, diversification toward production
its main agriculture commodities—rice and of animal products (and aquaculture) has been
cassava—before export, although diversification slow with a decline in livestock production for
to other agricultural products such as bananas and both family and commercial farms, despite rising
mangos for export shows some promising signs. demand and prices (table 1). Therefore, a well
Agricultural gross value added (at constant prices) targeted national policy to promote agricultural
decelerated to 1.2 percent in 2018, contributing diversification could play a crucial role to boost
only 0.24 percentage points to real GDP growth private and public investment and the expansion
in 2018.13 Rubber and cassava production also of animal products, underpinned by a favorable
expanded last year, rising by 16.6 percent and 2.6 trade and export regulatory environment.
percent, respectively.
Figure 9: Air and business visitor arrivals to Figure 10: Annual rice production
Cambodia (million metric tons)
(y/y, percent change)
40 Business visitors (percent of total arrivals) Wet season Dry season
Arrivals by air to S�Reap (y/y) y/y percent change, RHS
35
Arrival by air to P�Penh (y/y) 12 10
30
10 8
25
20 8 6
15
6 4
10
5 4 2
0 2 0
-5
0 -2
-10
2013 2014 2015 2016 2017 2018 Jun-19
Source: Cambodian authorities. Source: Cambodian authorities.
Note: RHS = Right-hand scale.
12
A Hong Kong-based holding group is investing in building cassava processing plants.
13
Annual report, 2018 achievements and 2019 targets, Ministry of Agriculture, Forestry and Fisheries, March 2018.
17 CAMBODIA ECONOMIC UPDATE | NOVEMBER 2019You can also read