Bus Service Improvement Plan for The Greater Nottingham (Robin Hood) Area - Developed by Nottingham City Council, Nottinghamshire County Council ...
←
→
Page content transcription
If your browser does not render page correctly, please read the page content below
Bus Service Improvement Plan for
The Greater Nottingham
(Robin Hood) Area
Developed by Nottingham City Council,
Nottinghamshire County Council, and the Bus Partnership Group

October 2021
Contents

Section 1 - Overview									 3

Section 2 - Current bus offer to passengers				    10

Section 3 - Headline targets								               40

Section 4 - Delivery										                     43

Section 5 - Reporting									                     54

Section 6 - Overview table 								                55

Appendix A - Contracted Services Expenditure			    60

Appendix B - Parking Data 								                 62

Appendix C - Organograms of Transport Services		   66

Appendix D - Bus Passenger Charter					            68

                                                        2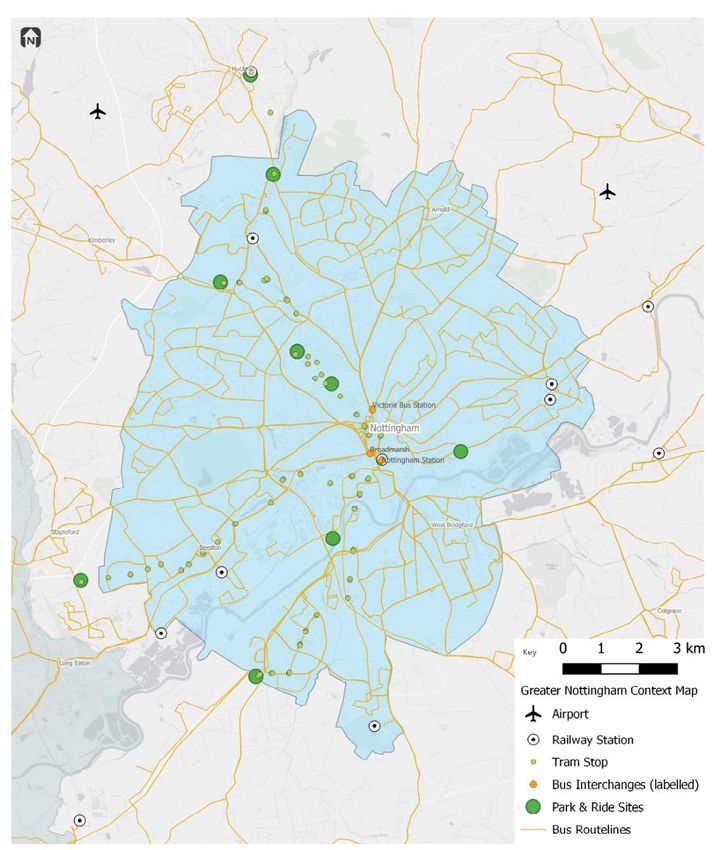
Section 1 – Overview

Introduction

In Greater Nottingham, we like to keep moving forward and despite a network that currently delivers
much of the ambition of National Bus Strategy and objectives of the Bus Service Improvement Plan
initiative, our journey is one of continuous improvement. We do not take previous success for granted
and are acutely aware of the existential threat that the Covid-19 pandemic has dealt the bus network
locally and the potential that this BSIP has to support the recovery of bus from Covid-19. With this in
mind a detailed analysis of the current network has been undertaken to identify areas which need to be
targeted for improvement locally.

Nottingham has the largest economy in the East Midlands and as one of the UK’s Core Cities is a
key driver of national prosperity. Nottingham is also a modern European city with a well-recognised
international brand from Robin Hood to Raleigh Bikes, which has been built on the city’s historical and
industrial heritage.

Today, Nottingham has a reputation for being at the cutting edge of scientific innovation, thanks to the
presence of two world-class universities and our emerging expertise in areas such as life-science. The
city is also known for its vibrant cultural scene, world class sporting venues and growing creative and
digital economy. Sir Paul Smith, the internationally renowned fashion designer, and one of the city’s
most famous sons, retains a significant manufacturing base in the city for his global fashion empire.

A successful Advance Quality Partnership Scheme (AQPS), one of the first to be implemented in the
United Kingdom, has operated in Nottingham City Centre for a number of years. This has delivered
award-winning high-quality bus services, advanced digital information systems, a longstanding
commitment to comprehensive bus priority and operation of multi-operator smart ticketing via the Robin
Hood scheme. Coupled with early adoption of stringent emission standards for buses and agreed
standards of customer service. Pre-pandemic the partnership delivered some of the highest bus usage
per head of population outside of London, supporting growth of the combined bus and tram network
locally.

Despite the strong position in Greater Nottingham, there is much more that can be achieved. Therefore,
the opportunities presented by the National Bus Strategy are welcomed. The existing strong partnership
between the Councils and the bus operators is well placed to develop a Bus Service Improvement Plan
and use an Enhanced Partnership to facilitate the delivery of further improvements. These should help
overcome the set-backs of lost patronage suffered during the pandemic and continue the virtuous cycle
of growth and development already occurring pre-COVID.

                                                                                                           3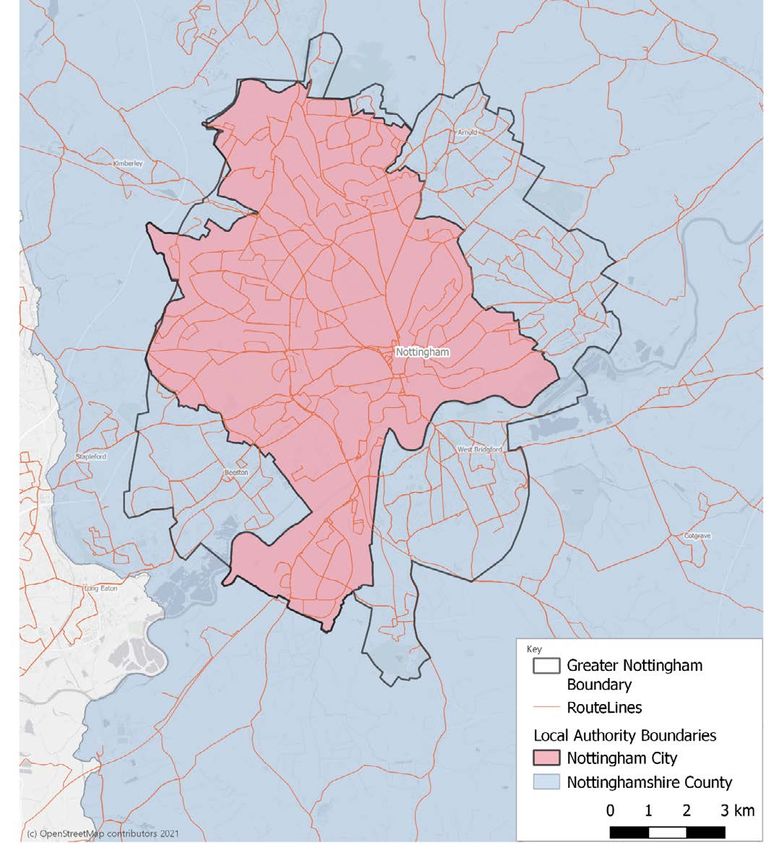
Section 1 – Overview

Overview of the Greater Nottingham Area
Nottingham’s Bus Service Improvement Plan (BSIP) will cover the geography of the existing Robin
Hood Ticketing Area and incorporate the entire Nottingham City Council Local Transport Authority Area
alongside a number of urban areas that sit within the Nottinghamshire County Council Local Transport
Authority Area, as illustrated in the map below.

                                                                                                        4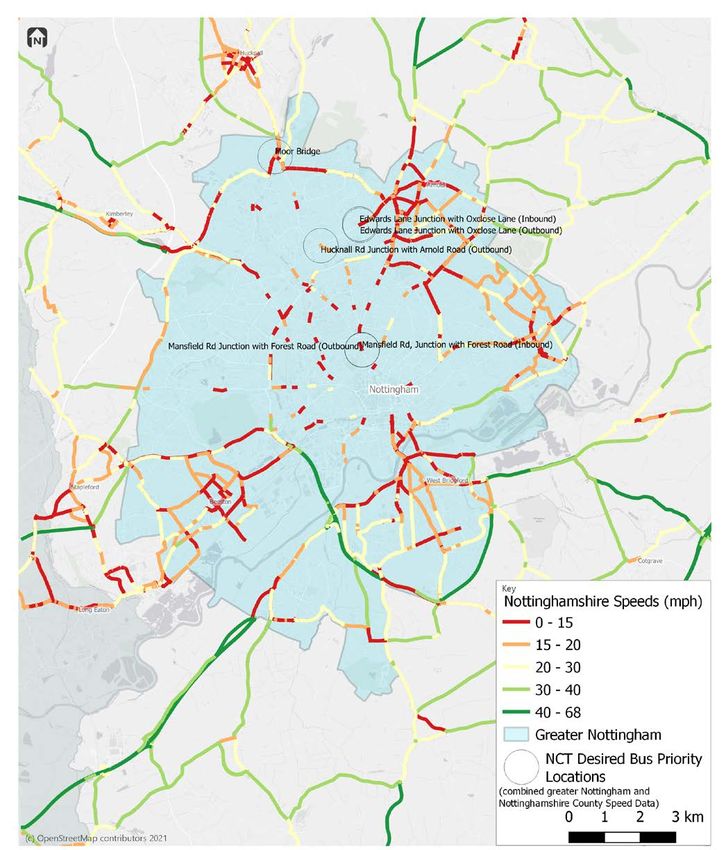
Section 1 – Overview

Around 97% of Nottingham’s current bus network is operated by commercial services, with Nottingham
City Transport (the dominant urban operator) having a market share in patronage terms of 85% (71%
of mileage operated), trentbarton (18% of mileage operated) (the key inter-urban operator) and others
including Stagecoach, Marshalls, CT4N and Centrebus operate the remaining 12% of commercial bus
services. The remaining 3% of the network is run under tendered contracts, with financial support,
service specification and fares determined by the City and County Councils under the linkbus and
NottsConnect brands. The Easylink dial-a-ride service is also supported by the two local transport
authorities.

There is a limited suburban rail network but the bus network is complemented by a fully integrated tram
system with 3 routes which prior to the pandemic carried just under 20 million passengers a year. The
local public transport network is supported by two bus and 6 tram-based park and ride sites. With a
new bus park and ride site and expanded existing tram site to the north of the city planned as part of
the transforming cities programme. The alignment of the BSIP against the Robin Hood Ticketing Area
ensures that the Greater Nottingham conurbation is incorporated in one plan, covering the “Robin Hood
Network” and ensures that the logical travel to work area for urban bus services is packaged together
in an Improvement Plan that reflects how the current bus network operates and how passengers use
the bus system locally.

The area covered by the BSIP outside of the city of Nottingham falls wholly within Nottinghamshire and
Nottinghamshire County Council has been integral to its development and ensuring compatibility and
coordination with the BSIP being produced for the rest of Nottinghamshire.

Demographics
The population of greater Nottingham is estimated as 505,207 (based on a 2019 estimate from Nomis).
Nottingham City ranks 11th most deprived out of 317 districts in England. Of the total population
of Nottingham City 13% of people are over the age of 65, which is 5% lower than the UK national
average, which is not too surprising given the city -focus. 30% of the population are aged 18 to 29;
full-time university students comprise around 1 in 8 of the population. Despite its young age-structure,
Nottingham has a higher than average rate of people with a limiting long-term illness or disability.

As of September 2021, Nottingham City has 15,982 unemployed people, with the highest affected age
group being 25-49. The unemployment rate is 6.9% compared to the national average of 4.6%.
In terms of car ownership, 56.3% of households have access to a car or van compared to nationally,
where just under three quarters of households have access to a car or van.

In terms of car ownership, 56.3% of households have access to a car or van compared to nationally,
where just under three quarters of households have access to a car or van.

                                                                                                           5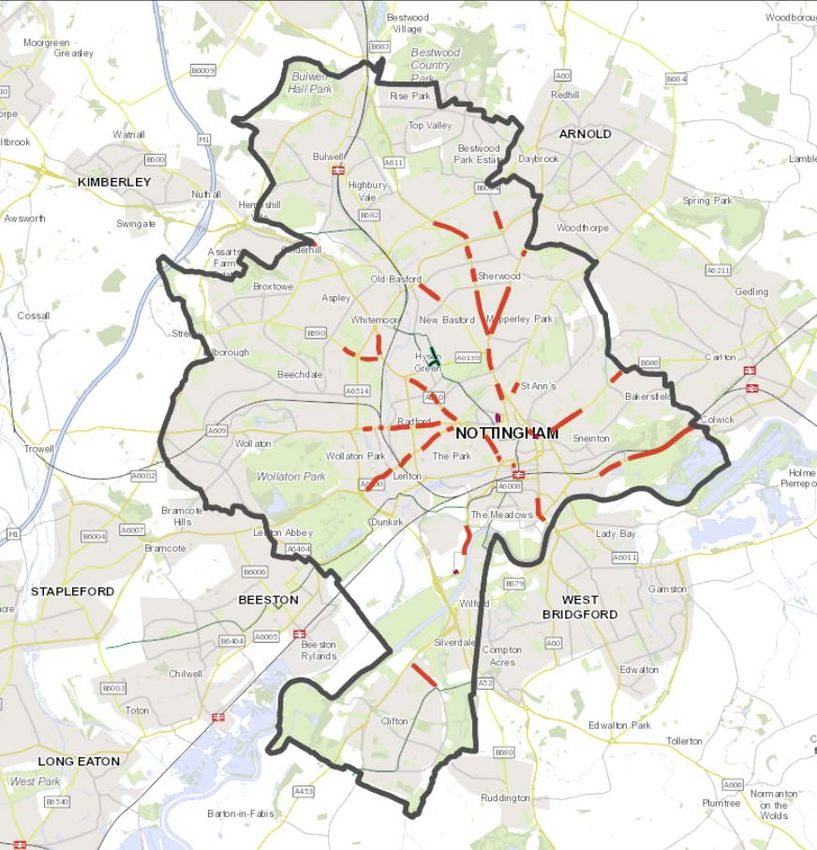
Section 1 – Overview

Of the total population in the districts of Gedling, Broxtowe, and Rushcliffe (county area) 8.69% are
elderly which is comparable to the national average. There are also 3,946 unemployed people and the
unemployment rate is 2.2% which is slightly less than the national average . Regarding Car ownership
there are 63.8% of households with access to a car or van which is comparable to the City area.

Levelling Up
The delivery of this plan and the improvements to bus services it will facilitate are key to delivering the
Levelling Up agenda locally in Nottingham, which has identified the city as a priority one area.
The figure below shows that over half (57.2%) of the city’s Local Super Output Areas (LSOAs) fall
into the lowest IMD quintile (lowest 20%) for the whole of England, and less than one-in-ten (8%) of
Nottingham’s LSOAs are in the top quintile (top 20%).

                                                                                 Source: https://www.
                                                                                 nottinghaminsight.org.
                                                                                 uk/themes/deprivation-
                                                                                 and-poverty/indices-of-
                                                                                 deprivation-2019/

Index of Multiple Deprivation for Nottingham
While these trends are comparable with a number of other East Midlands’ cities, and also reflect
Nottingham City’s tightly drawn administrative boundary, they underline the critical importance of
levelling-up the local economy and providing access to employment and education opportunities for
Nottingham’s residents through comprehensive and affordable bus services.

                                                                                                              6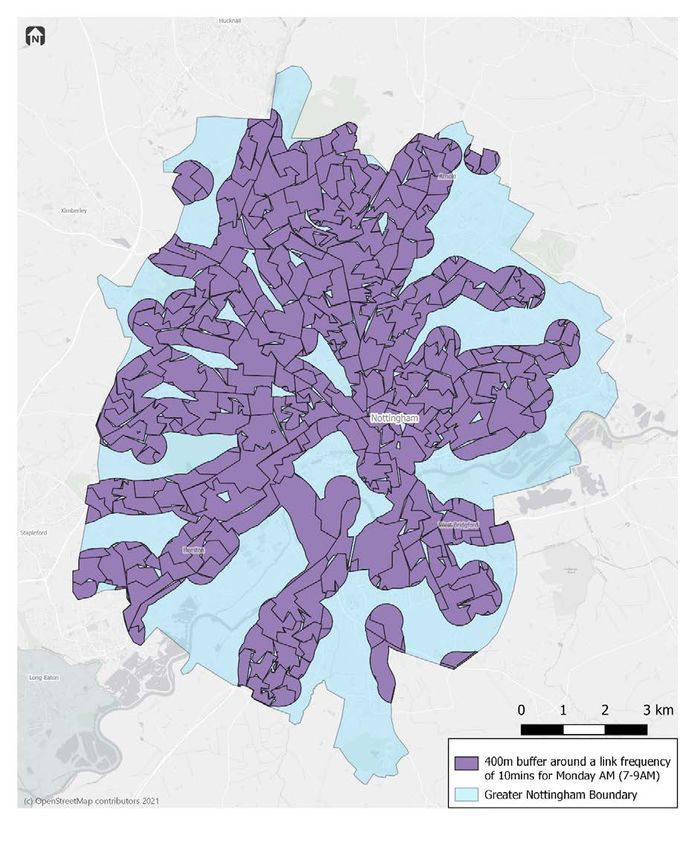
Section 1 – Overview

Development of the Bus Service Improvement Plan
Building on the long-established relationship between the local authorities and bus operators in the
area, and existing Advanced Quality Partnership Schemes in Nottingham City Centre and Beeston
Town Centre, a Robin Hood Network Enhanced Partnership Plan and Schemes will be developed and
implemented in April 2022 using the Greater Nottingham BSIP as a blueprint and mirroring the same
geography of this Plan.

This BSIP will run from 2021 to 2025 in line with the existing Nottingham Bus Strategy which sits within
the current Local Transport Plan and the Nottinghamshire Local Transport Plan that runs until 2026. It will
be incorporated into the existing Nottingham Bus Strategy which has established an improvement plan
for bus services via infrastructure investment as part of Nottingham’s Transforming Cities Programme,
prior to the national requirement for BSIPs. This BSIP will build on the two existing plans and look to
secure additional funding from the government’s £3bn transformation fund to accelerate and broaden
improvements to bus services locally and ensure that Greater Nottingham’s world class bus system
continues to improve and drive the modal change required to reduce congestion and meet emissions
targets.

An annual review and update of the BSIP will be undertaken by the Greater Nottingham Bus Partnership
in a dedicated AGM outside the existing quarterly Business As Usual meetings.

The Nottingham Bus Partnership is independently chaired, by Jon Parker of ITP, a former Transport
Planner of the year and expert in bus strategy with a wealth of national and international experience.
The chair role provides an important mediation function between the local transport authorities and
local bus operators as well as providing additional technical expertise to the local transport authority
teams and valuable insight and ideas which significantly strengthen the outcomes of the Partnership’s
work. The full membership of the Partnership is as follows:
     z Independent chair
     z Nottingham City Council
     z Nottinghamshire County Council
     z All bus operators
     z Sustainable Transport Nottingham
     z DVSA

                                                                                                              7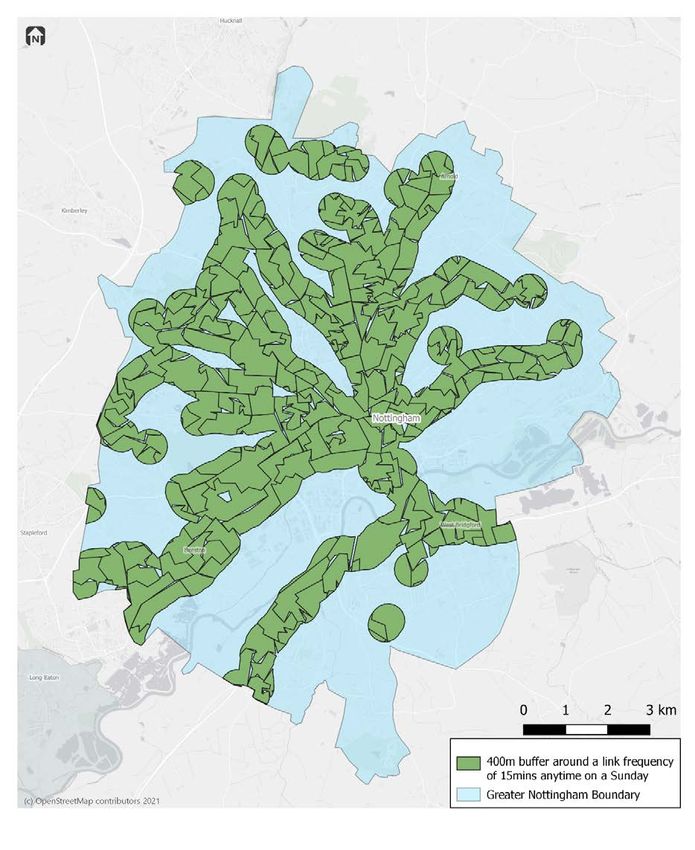
Section 1 – Overview

Aims and objectives of the BSIP
The National Bus Strategy calls for us to deliver better bus services and specifically calls for measures
to be implemented and targets set in relation to bus service journey times and reliability (punctuality)
improvements. National Transport Focus research points to punctuality as being the bus customer’s
number one priority. The same research indicates rising year on year dissatisfaction levels with bus
journey times and highlights a number of highways related reasons for the same.

Nottingham City Council, Nottinghamshire County Council and Nottingham’s bus operators are
committed to speeding up bus journey times and making them more reliable. In return, services will
be more attractive to users and non-users alike, be more environmentally friendly and require less
financial support in the future. High quality bus priority measures will ensure an efficient network which
in turn reduces costs and ensures affordability.”
There is much ambition to build on the progress already achieved in the Greater Nottingham area over
recent years, and partners have agreed, and are fully behind, the vision and objectives set for the BSIP.
These are set out below.

Vision:
Nottingham’s Robin Hood Bus Network will be:
     z Accessible – Reliable, easy and simple to use and as attractive as travelling by car, helping to
        reduce congestion.
     z Integrated – seamless connections between all modes of travel.
     z Fair – fair pricing, affordable for all.
     z Smart – 21st century technology used to provide live information and smart payment systems.
     z Clean – Supporting operators to switch to zero emission vehicles to improve air quality for all
        our citizens, well in advance of the government’s ban on the sale of new petrol and diesel cars.
        Whilst delivering decarbonisation to address the Climate Crisis and support Nottingham to be
        Climate Neutral by 2028 and Nottinghamshire’s Climate Emergency commitments.

                                                                                                             8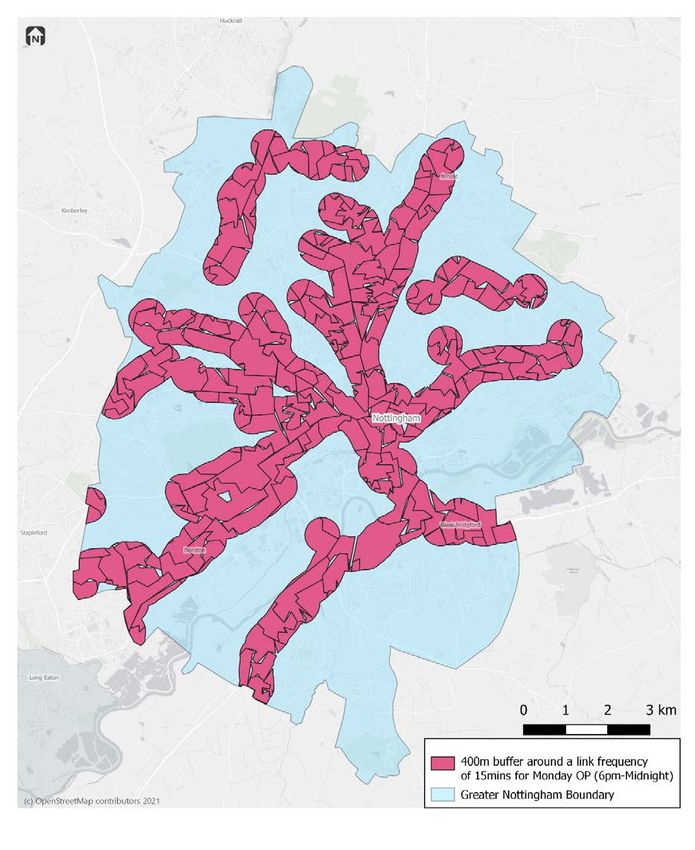
Section 1 – Overview

Overall aim:
Together we will ensure convenient, affordable and reliable public transport journeys are the reality for
every citizen, whatever their age and situation, wherever they live, both within and outside of Greater
Nottingham, however they want to get around.

We will provide an unrivalled, clean, safe and fully integrated public transport network we can all be
proud of.

BSIP Goals:
This improvement plan will deliver a Robin Hood Bus Network, with quick, efficient and punctual bus
services, that provides:
     z “Turn-up and go” reliable bus frequencies that keep running into the evenings and weekends
        on main corridors
     z Fully integrated services with simple multi-modal ticketing across bus and tram
     z Increases in bus priority both digital and physical
     z High quality information for all passengers in more places
     z Genuine passenger engagement
     z Year on year passenger growth

Objectives:
    z Maintenance of pre-covid high frequency level of services and accessibility across the bus
      network
    z Roll-out of further bus priority across the network ensuring buses have priority over inefficient
      transport modes
    z Delivery of measures to address operator pinchpoints on the network.
    z Upgrades to the existing real time information estate
    z Improvements to bus stop waiting infrastructure in district centres
    z Roll-out of the new smart ticketing and contactless payment products
    z Bus station and interchange improvements
    z Extension of camera enforcement, traffic regulation orders and new red routes
    z Delivery of an enhanced Robin Hood Network marketing campaign
    z Deliver “Levelling Up” through better access to jobs and opportunities
    z Help deliver the governments Transport Decarbonisation plan

                                                                                                            9
Section 2 - Current bus offer
to passengers

Introduction
The expectation on BSIPs is for local areas to deliver a fully integrated bus service, with simple multi-
modal tickets, more bus priority measures, the same high-quality information for all passengers in more
places, and better turn-up and go frequencies that keep running in to the evening and weekends. If
we deliver on these aspects of bus provision, then the expectation is that it will drive a further growth
in patronage. This chapter therefore summarises the existing evidence of public transport delivery and
use across the Greater Nottingham area against each of the key BSIP outcomes, which in turn has
then enabled us to carry out a gap analysis to identify and cost the proposed improvement areas later
in this BSIP.

What do people think about buses in Greater Nottingham?
Before exploring existing service delivery, infrastructure and usage, it is critical to gain an understanding
of user and non-user needs and perceptions of local bus services. This will ultimately help to ensure
any measures within the BSIP are targeted in areas which will result in the greatest uptake in usage.
As such, an online survey was undertaken during July and August 2021 to gather opinions from both
users and non-users of buses in Greater Nottingham as to how bus services could be improved in order
to attract more passenger trips. The data was split to only include those residents within the confines
of this BSIP area and attracted 1,720 responses, spanning both users and non-users.

65% of respondents used the bus 2 days or more a week, and the most common reasons for bus travel
were for social activities and shopping. People choose to use the car over the bus mainly because the
car is more convenient; and the car is significantly quicker than the bus. 76% of respondents who use
the car said it was easy or fairly easy to park their car.

When asked what improvements would make them use the bus at all/more, the key issues identified
were:
    z Better bus stops and shelters (78%) and improved bus information (71%)
    z More frequent services (70%) to more destinations (72%), with better connections between
      services (71%)
    z Multi operator ticketing (76%) to make it easier to transfer between services, along with lower
      fares (72%) and contactless payment (71%); and
    z Reduced delays (71%)

                                                                                                                10
Section 2 - Current bus offer
to passengers
Additionally, surveys undertaken by Transport Focus also show that satisfaction across a range of
factors is already higher than the national average for the main operator, Nottingham City Transport
compared to other operators nationwide, and this has consistently been the case over the last 5 years
(currently standing at overall satisfaction of 94% against other operators’ scores ranging between 71%
and 97%).
Having understood the current views of users and non-user, the rest of this section explores aspects of
the current Greater Nottingham bus network against each of the stated BSIP national outcomes.
BSIP Outcome 1: fully integrated bus service
Nottingham City Transport (NCT) is the main bus operator in Greater Nottingham, accounting for 85%
of the market. Other operators serving the area include trentbarton (12%), with Stagecoach, CT4N,
Marshalls and Centrebus and Nottingham City & County Council (tendered services) making up the
remaining 3% of the market. There is also an ‘Easylink’ service operated by CT4N across the City
(funded jointly, and open to registered users and Concessionary pass holders.) which is a traditional
dial-a-ride service and is complementary to the public transport offer but not fully integrated in to the
Robin Hood Multi-Operator ticketing offer.There are also a number of Community Transport/Voluntary
Car Schemes within the conurbation for registered users. They are Rushcliffe CVS, Gedling Voluntary
Travel Scheme and The Helpful Bureau.
11Section 2 - Current bus offer
to passengers
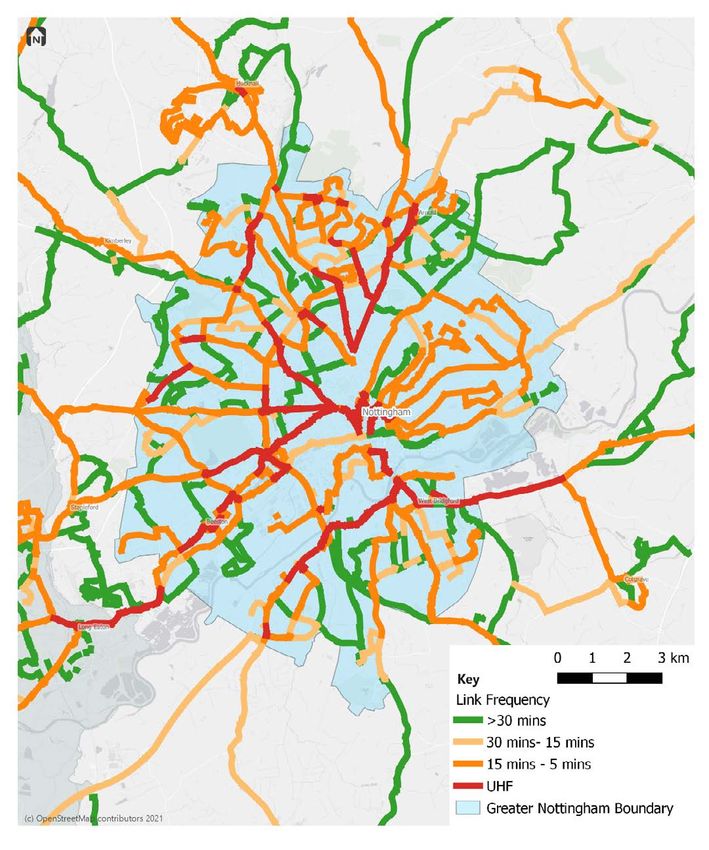
The map below shows the extent of the network, highlighting the hourly link frequency at the AM peak,
showing the combined frequency of bus services along each road, regardless of service or operator.
12Section 2 - Current bus offer
to passengers
These services complement the rail and tram network, and there is good coordination of services at key
interchange points. The map below shows the key interchange points in the area.
13Section 2 - Current bus offer
to passengers
BSIP Outcome 2: simple multi-modal tickets
A report by TAS Partnership, setting out the findings of a national fares survey undertaken in 2019
shows that the average single fare in Great Britain is £2.48 (£2.45 in urban East Midlands; £2.62 in
rural East Midlands); average day fare is £5.21 (£5.92 in urban East Midlands; £6.93 in rural East
Midlands); and average weekly fare is £18.03 (£21.49 in urban East Midlands; £23.48 in rural East
Midlands).
Single fares vary within the Greater Nottingham area, given the varying lengths of route, ranging from
a flat £2.30 on NCT, to variable singles based on route length on Stagecoach (Nottingham to Arnold is
£2.20) and trentbarton services. Network and day caps vary from a cap of £4.20 on NCT services, to a
cap between £6.60 - £10.10 on a trentbarton service, depending on the time of day, and area, as these
fares are calculated using a tap on tap off (TOTO) system, and £7.20 for a Stagecoach network ticket.
The Robin Hood multi-operator, multi-modal ticketing scheme enables travel on all operators across
Greater Nottingham. A day cap of £4.80 is available for adults. Paper day tickets, ITSO smart season
cards and Pay as You Go (ITSO) with complex single and multi-operator day capping provide a
comprehensive range of travel products to cater for most travel needs for adults, under 19’s and
students. In addition to this, Nottingham contactless will offer multi operator capping from November
2021. The multi-operator offer broadly mirrors the commercial offer, however, there are some areas of
inconsistency and elements of the scheme which require improvement:
z Not all operators in Greater Nottingham are involved in all areas of the scheme – most (but
not all) bus operators sell and accept paper day tickets and smart season cards, but fewer
operators are involved in the Pay as You Go scheme, and fewer still in Nottingham Contactless.
z The Robin Hood pricing mechanism leads to wide ranging premium differential across the
product range compared to commercial operator prices. Some prices are higher than they
should be, while other prices are lower than they should be, including undercutting a very small
number of commercial operator prices for the equivalent product.
A range of tickets are available by different operators, focussed on attracting different markets according
to the types of service they operate. Different products cater for different demographics, travelling at
different frequencies.
Although there is some consistency in tickets across the main operators, for instance, Robin Hood,
NCT, TB and CT4N all offer U19 tickets, different operators offer different discounts. For instance,
under 19 ticket discounts range from 23% - 50% off the cost of an adult equivalent ticket; student
ticket discounts range from 10% - 20% off the cost of an adult equivalent ticket. Some day tickets are
available for 24 hours from purchase, others available for the day of purchase only.
14Section 2 - Current bus offer
to passengers
Tickets are available for purchase on-bus; on-line; and via apps for the main operators (NCT; trentbarton;
Stagecoach; CT4N and Robin Hood). Contactless payment is available on all services, although the
type of contactless payment differs. Some offer retail transactions (old school Model 1) only, while
others offer a tap and cap model (old school Model 2) with single operator day capping in an Account
Based Ticketing (ABT) environment. Multi-operator contactless ticketing across bus and tram is due
to go live in November 2021. However, although available, there are some restrictions to the use of
contactless, where some operators restrict the type of ticket which can be purchased via contactless,
others have a daily spending cap on contactless payments.
15Section 2 - Current bus offer
to passengers
BSIP Outcome 3: more bus priority measures
There are 26km of bus lanes in the area, (with a further 2km planned as part of the current Transforming
Cities programme) illustrated in the map below. Each of these sections of bus lanes has encountered
challenges of infringements by private cars, and some are only operating during restricted hours.
Map showing bus lanes in Nottingham City
16Section 2 - Current bus offer
to passengers
Map showing bus lanes in Nottinghamshire County (within Greater Nottingham BSIP)
Nottingham City and Nottinghamshire County Councils, in partnership with Nottingham City Transport,
were early adopters of Traffic Light Priority (TLP), deploying fixed units at six Scoot junctions in 2011 that
communicated with onboard radios and delivered a material improvement in bus reliability. Investment
in 71 junctions within Greater Nottingham followed, giving the region one of the largest TLP networks
outside of London. Seeking to extend the benefit of TLP to other bus operators, Transforming Cities
has delivered a centralised TLP system that will not only roll out TLP to more junctions at lower cost, but
also deliver the benefits to buses operating in Derby and Derbyshire as part of a D2N2 regional system.
17Section 2 - Current bus offer
to passengers
BSIP Outcome 4: high-quality information for all passengers in more
places
Operators in the Greater Nottingham area provide information through their own websites, social
media, and apps including: Journey planning; Route maps; Timetables; Real-time information; Service
disruption updates; and Journey capacity. Nottingham City Council also provides a consolidated
journey planning and travel information service for Greater Nottingham via the Transport Nottingham
website, and the Robin Hood network also provides details on services, routes, fares and ticketing.
Travel Information Centres are also located within the City to allow face to face customer interaction
and access to printed and online materials and tickets.
Timetables and integrated maps are also provided through individual operators and the Robin Hood
marketing group. The City coordinates the printing of information materials for distribution to outlets
across the area (e.g. libraries, bus stations, local centres etc.). Operators provide and install information
at bus stops for their own individual services.
Although Nottingham is characterised by high quality information for bus passengers, there is always a
need to continuously improve, with the ambition to further improve the bus stop and waiting environments
in district centres, and the development of mobility hubs to allow better and more seamless transfer
between modes.
Marketing of the Robin Hood Card is agreed jointly between the Council’s and operator’s, but otherwise
the partners approach marketing in different ways and to different degrees. Although there are some
good examples of marketing initiatives, such targeted marketing/promotion campaigns including
ticketing offers for specific services or user-groups, there is no Greater Nottingham-wide approach to
marketing at present.
There are currently around 1,500 RTPI screens at stops across the BSIP area – which is roughly 60%
of all stops.
18Section 2 - Current bus offer
to passengers
BSIP Outcome 5: better turn-up and go frequencies that keep running
in to the evening and weekends
The area is currently well-served by bus, with 77% of the population within 400m of a frequent (10
minutes or more) bus service during the weekday. 53% of the population live within 400m of a 15-minute
frequency service in the weekday evening, and 63% live within 400m of a 15-minute frequency service
on a Sunday. These are illustrated below.
19Section 2 - Current bus offer
to passengers
20Section 2 - Current bus offer
to passengers
The percentage of population within 400m access to these services is set out in the table below.
Population % of Population
(2019 Estimate) with access
Weekday morning 10 min 387,698 76.7%
Weekday evening 15 min 269,049 53.3%
Sunday 15 min 316,521 62.7%
21Section 2 - Current bus offer
to passengers
BSIP Outcome 6: Growing patronage
For over 15 years Nottingham has been working towards providing a low emission, high quality,
integrated, attractive, and affordable public transport system. The successful public transport network
pre-pandemic carried 83 million passengers a year across Greater Nottingham and 62 million in the
city of Nottingham itself (Nottingham City Council, 2019). Since 2003 the number of passengers has
increased significantly and unlike many other UK cities, growth in bus use has been delivered, reflecting
the high standards of quality and high levels of passenger satisfaction. Nottingham’s tram network has
also been heralded as one of the most successful light rail project in the country, carrying nearly 20
million on 3 routes. This is of course set in the context of a limited suburban heavy rail network within
the Greater Nottingham area, but is still a significant achievement.
Whilst England saw a decrease in patronage of 12% between 2007/8 and 2018/19, patronage on
Nottingham’s bus and tram network saw an increase in patronage of 9% (bus patronage alone
only decreased 2% during this time, mainly through the introduction of the tram and transference of
passengers).
As witnessed across the UK, the Covid pandemic and associated government guidance and social
distancing has had a large impact on bus patronage. On average, services lost 65% of their patronage
during 2020/21 compared to 2019/20. City centres have been impacted more due to changing retail
behaviour and the number of office commuters who have been working from home; a blend of home
and office working is likely to continue which is likely to impact on patronage in the future. In addition,
22Section 2 - Current bus offer
to passengers
Concessionary passholders are not travelling as much as they did pre-pandemic (currently at around
50% of pre-pandemic levels), and travel patterns in general will have changed indefinitely. As such,
it is unlikely, that patronage will return to pre-pandemic levels in the near future. As of October 2021,
patronage is around 75% of pre-pandemic levels.
BSIP Outcome 7: Financial support for buses
Subsidy is provided to the tune of £1,574,225 by the City of Nottingham and £574,400 by Nottinghamshire
County Council to plug gaps in the commercial network (equating to £4.25 per head of population),
but the strong commercial offer locally helps to suppress this expenditure, with very few dedicated
school services, for example, required due to the strength of the commercial network. A summary of the
mileage and routes supported by the City and County Council can be found in Appendix A. Strain on
local transport authority budgets means that external revenue support from the National Bus Strategy
fund will be required to maintain comprehensive access to bus services across Greater Nottingham.
The Covid pandemic has had a seismic effect on the bus market and more funding will be required
to stimulate demand whilst people grow in confidence to return to bus travel. There will also be those
who’s travel patterns will have changed as a result of the pandemic and for those (such as commuters
and elderly people), the pre-pandemic patronage levels will not return. Instead we need to look at new
ways to encourage new passengers onto the network to return to pre-pandemic levels and beyond.
With this in mind the bus network will be reviewed in April next year and a revised network (with
National Bus Strategy funding support) will be implemented to achieve the BSIP targets.
23Section 2 - Current bus offer
to passengers
BSIP Outcome 8: Other factors that affect bus use
Mobility and Accessibility
Feedback from citizens living in the city of Nottingham identified particular travel problems for people
with mobility difficulties caused by the 9.30am restriction on using Mobility Bus Passes. The City council
undertook a consultation exercise which received over 1,000 responses, and this identified key impacts
of the restriction, including:
z Difficulty of getting to medical appointments, with problems in changing appointments leading
to delays in treatment.
z Difficulty of getting to work/voluntary work.
z Increased travel costs leading to hardship, with people with mobility difficulties having a lower
than average income, and potentially priced out of the employment market.
z Feeling like independence has been taken away and social exclusion, with restrictions/curfew
on activities impacting on wellbeing.
z Creating barriers in day to day life for groups with specific disabilities, for example:
z for deaf and blind people difficulty in communicating with drivers for buying tickets and
complication of using different payment systems at different times of the day, leading
to a reluctance to use public transport and wellbeing issues;
z stress for people with anxiety and other illnesses no longer able to travel with one
pass, or early to avoid crowds;
z the artificial time restriction for travel (from 0930) creating difficulties for people in
wheelchairs as limited space within vehicles is often taken in the period after 9.30am
and people can be forced to wait a long time to be able to access a vehicle.
Exploring how we can support travel up to 9.30am for this group will be important in continuing to build
an accessible and integrated public transport system which removes barriers to travel, in particular to
work, education, leisure and health facilities. We are also looking to trial some on-bus technology to
improve the passenger experience for disabled travellers.
Parking provision
Parking provision in the city centre is on the whole managed by the local authority and an existing
agreement is in place via the current Advanced Quality Partnership which ensures that day rates within
the city council’s parking estate always exceed the cost of the Robin Hood Multi-Operator Day Bus and
Tram Ticket. We will work with district councils, local members and neighbourhoods to look at charging
structures for parking beyond the city centre.
Importantly, Nottingham is the only authority in the UK to have implemented a Workplace Parking Levy,
with revenues re-invested in the sustainable transport infrastructure of the City.
24Section 2 - Current bus offer
to passengers
Full details of parking charges are provided in Appendix B, and the map below shows a summary of the
car parking provision in the area, highlighting the size of the car parks and whether the cost of parking
exceeds the cost of a Robin Hood ticket.
25Section 2 - Current bus offer
to passengers
Branding
There is a strong Robin Hood brand which is used for the multi-operator ticket, and which encompasses
the whole BSIP area. Bus users recognise the current branding and their experience of using the
bus is improved as a result (Pre-COVID, the entire Robin Hood scheme had an annual turnover of
c.£9m, accounting for around 12% of all public transport ticket sales for travel in and around Greater
Nottingham). The operators through the existing bus partnership, the Robin Hood marketing group,
and their own endeavours, continue to innovate and seek ways to strengthen branding and identity of
services in order to support an ever-growing level of patronage, and in particular to make it easier for
car drivers to consider switching to the bus.
26Section 2 - Current bus offer
to passengers
Nottingham City Transport (NCT) is the main operator in the Greater Nottingham area, accounting for
85% of the market. NCT has a strong brand and colour-codes services according to the corridor/area
served (and in some places name buses after local people to strengthen the link to local places). This
flows from publicised information through to the livery of the vehicles as demonstrated below.
27Section 2 - Current bus offer
to passengers
trentbarton the main inter-urban operator also has a strong localised brand rooted in the communities
it serves:
28Section 2 - Current bus offer
to passengers
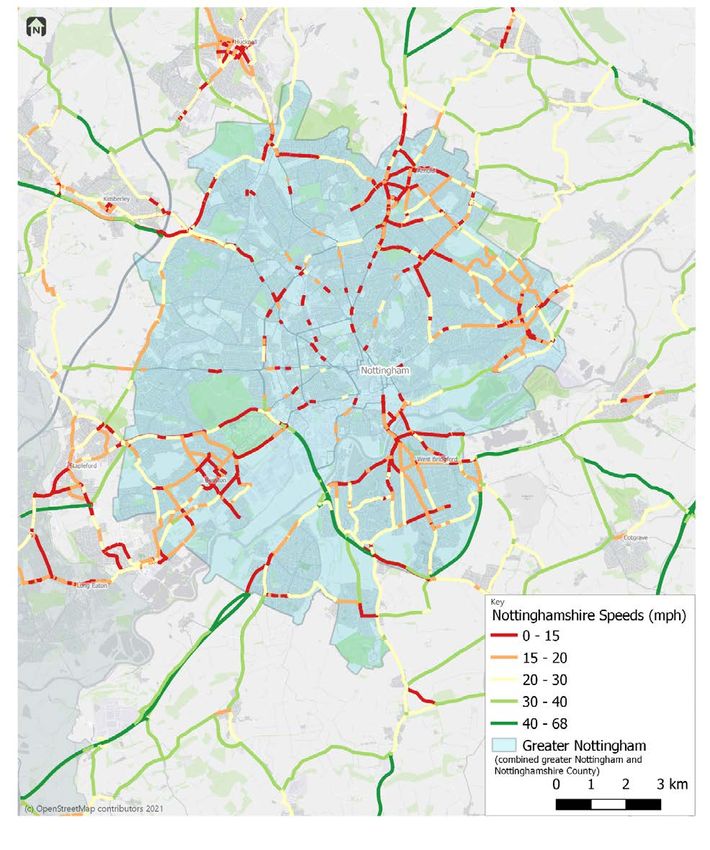
Congestion, traffic levels and average speed.
The maps below show the average traffic speed, and the traffic levels, on key links in the Greater
Nottingham area; and the areas where buses encounter reliability problems. Particularly congested
“hotspot” or unreliable areas where bus priority improvements have been identified include:
z Mansfield Road, junction with Forest Road
z Hucknall Road, junction with Arnold Road
z Edwards Lane, junction with Oxclose Lane (inbound)
z Edwards Lane, junction with Oxclose Lane (outbound)
z Moor Bridge
With extended priority also required along the following corridors necessary to address wider network
congestion issues:
z A52 – Derby Road (Priory island link)
z A52 West Bridgford
z A60 - Nottingham Railway Station to Central Avenue, West Bridgford
z A60 – Mansfield Road – Front Street Arnold
z Upper Parliament Street to Victoria Centre
z A609 – Ilkeston Road to Wollaton Road
z Edwards Lane
z Hucknall Road
Traffic congestion in Nottingham increased between 2011 and 2014 and has since largely been
constrained, while overall traffic flow has, despite annual variations of around +/- 1.75% remained
around 916 million vehicle km pa between 2011 and 2019 (due to lockdowns the traffic levels fell
considerably during 2020). Although congestion has in broad terms been kept from growing, it still
creates a strain on the road network. Both Nottingham and Nottinghamshire have a street works permit
system in place which prevents unplanned works and imposes penalties on contractors who overrun
allotted works schedules.
29Section 2 - Current bus offer
to passengers
30Section 2 - Current bus offer
to passengers
The map below shows the main pinch-points for buses within the Greater Nottingham area.
31Section 2 - Current bus offer
to passengers
Congestion has had a negative impact on the operation of services over the years, leading to increased
journey times for the passenger and the need for additional vehicles to be utilised, simply to maintain
the existing frequency, for example:
z The running time for the Threes service along the A60 has increased by 26% since 2009, and
requires an additional 1PVR to maintain the timetable.
z Journey time has increased by 18% on the Rainbow 1 service, and current punctuality is
61.8%. An additional 6 vehicles are required to maintain reliability on this service and service 9
combined, costing approximately £900k per year to operate.
z NCT has added in additional vehicle resources on services 44, 45, 46, 47 and 58 to accommodate
the longer journey times experienced in these areas at peak times, costing an additional £520k
per annum
The existing AQPS has provided an effective forum for allowing operators and the authority to share
experiences and concerns, and to jointly address identified congestion hotspots with targeted bus
priority improvements.
In addition to the traffic currently, more trips will be added to the network in response to the high level
of development planned in the area, the location and size of which are illustrated below. Although S106
monies will be used to mitigate this impact, wider measures will be required to support bus priority
measures across broader corridors, and hence make bus more attractive for new residents.
32Section 2 - Current bus offer
to passengers
Map: Proposed major development sites
33Section 2 - Current bus offer
to passengers
Bus fleet
The average age of the fleet operating in Greater Nottingham is 6-7 years old, the split of which is
shown below.
Year Number Age % Year Number Age %
2005 12 17 3% 2014 16 8 4%
2006 1 16 0% 2015 33 7 8%
2007 0 15 0% 2016 0 6 0%
2008 8 14 2% 2017 47 5 12%
2009 7 13 2% 2018 48 4 12%
2010 6 12 2% 2019 71 3 18%
2011 28 11 7% 2020 16 2 4%
2012 28 10 7% 2021 0 1 0%
2013 33 9 8% 2022 35 0 %
34Section 2 - Current bus offer
to passengers
The majority of buses (88%) have Euro VI diesel engines or operate on biogas (all buses that pick up
or drop off in the City Centre are required to be Euro VI or better as part of the AQPS). The breakdown
is shown below.
Summary Number %
Euro 1 0 0%
Euro II 0 0%
Euro III 12 3%
Euro IV 3 1%
Euro V 32 8%
Euro VI 202 52%
Biogas 142 36%
Total 391
Nottingham City Council and Nottinghamshire County Council also operate a fleet of 35 Electric Buses
on their tendered services networks.
35Section 2 - Current bus offer
to passengers
Local Authority Technical Support and skills
Both Nottingham and Nottinghamshire have well-established public transport teams, covering strategy,
operations and infrastructure, and an excellent track record of project delivery. There is also a strong
partnership already in place between the City Council, County Council and operators, who have a
long-standing track record of working together to achieve shared outcomes. This partnership has got
stronger during the pandemic, as demonstrated by the establishment of the Transport Local Resilience
Forum which sought to oversee the response to and recovery from the pandemic.
The organograms in Appendix C show the staff structure in the City Council and in the County Council
and their roles in relation to bus-related activities.
Investment in the Network
Over £250 million is being invested in the regeneration of Nottingham’s Southern Gateway in and around
Nottingham Station – including redevelopment of Broadmarsh shopping Centre, a new Nottingham
College and regional headquarters for Her Majesty’s Revenue and Customs. The Transforming Cities
Fund with its focus on improving urban connectivity through better Public Transport, Cycling and
Walking infrastructure will support better journeys throughout Greater Nottingham and across the Derby
– Nottingham Metro area. Activity underway supported by the Transforming Cities Fund includes:
z Modernisation of public transport information systems - better disruption updates, more accurate
bus arrival information and realtime feeds available via Google Maps.
z Traffic light priority for buses across the region.
z Further development of Robin Hood Smart Ticketing and contactless payment.
z A new Thane Road bus lane connecting the Boots Enterprise Zone and extension of Daleside
Road bus priority through Colwick.
z Improved bus priority along Nottingham’s northern growth corridor.
z New Park and Ride site and complementary bus priority measures
z Development of Demand Responsive Transport on the urban fringe to complement the core
public transport network.
Activity underway supported by other central government funds including the Clean Bus Technology
Fund, National Productivity Fund, Ultra Low Emission Bus Funds and Local Enterprise Partnership
funding includes:
z Delivery of contactless payment on bus and tram services.
z Roll-out of low and ultra-low emission buses and supporting charging and fuelling infrastructure.
z Exhaust retrofit of existing diesel buses to Euro VI making them 90% cleaner.
z New Broad Marsh Bus and Coach Station
36Section 2 - Current bus offer
to passengers
This significant investment in public transport infrastructure is being implemented to help improve
the region’s economic vibrancy, health, wellbeing and quality of life by improving the efficiency and
accessibility of an integrated transport network for residents across the Derby – Nottingham metro
area. Improved connectivity by bus, tram, rail and road will complement better walking and cycling links
helping to move people and goods to jobs and services and the new opportunities presented by the key
growth areas across the city region including:
z HS2 Growth Hub and Science Park
z East Midlands Gateway and Strategic Rail Freight Interchange
z East Midlands Airport
z Derby and Nottingham City Centres
Supporting Policies
Continuing to develop the Greater Nottingham BSIP area as a national exemplar for integrated
sustainable transport aligns with key strategies covering economic growth, climate change, health,
safety and quality of life. The main strategies are:
z Nottingham Bus Strategy (2020 – 2025)
z Nottingham Growth Plan
z Local Transport Plans for both authorities
z Local Air Quality Plan
z Housing Strategy
z Local Plan (Planning and Development) and District Local Plans in the conurbation
z Derby – Nottingham Metro Strategy
z Nottingham Street Design Guide
z City of Nottingham Carbon Neutral by 2028 Strategy and Nottinghamshire County Council
Carbon Management Plan and Environment Strategy
z Nottinghamshire Integrated Passenger Transport Strategy
z Council Plans for both Nottingham and Nottinghamshire
The current investment package in bus is wholly aligned with the ambitions and objectives of the
National Bus Strategy and the achievement of the BSIP Objectives and infrastructure interventions
sought by government to improve bus services.
From a purely operational service basis passengers in the Greater Nottingham area currently benefit
from a commercial network that has:
z Robin Hood Card, Multi-Operator ticket for Bus and Tram
z Contactless Payment with Multi Operator Bus and Tram from Autumn 2021.
z 8 Park and Ride sites (2 bus & 6 tram based) circling the city on key radial routes.
37Section 2 - Current bus offer
to passengers
z Low Fares (Child Fares extended to under 19s on Nottingham City Transport, trentbarton and
Robin Hood).
z An Advanced Quality Partnership Scheme for the city centre (Euro VI emission standard,
revised stop departure caps).
z 88% of all vehicles which are Euro VI or biogas (100% compliance required for vehicles
boarding and alighting in City Centre, buses currently being retrofitted which were disrupted by
Covid, so compliance delayed for Victoria Bus Station until early 2022).
Conclusion: Barriers and opportunities
This chapter has sought to pull together data and insight that helps to inform the current state of the
bus network across the BSIP area, and draws out key issues and challenges against each of the
national BSIP Outcomes. This insight is then used to inform the proposed measures, such that they
are targeted in the areas of greatest need / most impact.
38Section 2 - Current bus offer
to passengers
The following SWOT analysis seeks to capture and summarise the key issues.
Strengths Weaknesses
• High quality frequent and reliable network • Known pinch-points and congestion hotspots
already exists remain
• One of the UK’s greenest fleets with exten- • Lack of cross city centre services
sive BioGas, Electric and Euro VI standard
vehicles in operation
• Good value for money fares offered through
Robin Hood multi-operator ticketing and high
quality commercial ticketing offers.
• Strong existing partnership working
• Long term sustained growth in patronage
• High levels of passenger satisfaction
• Highly regarded as leading transport au-
thorities. With the two largest bus operators
winning the UK bus operator of the year title
more times than any other area in the UK.
Opportunities Threats
• Opportunities to tackle congestion and • Unknown long-term impact of pandemic on
strengthen bus priority across the Greater confidence and use of local bus services, and
Nottingham, and at identified pinch points likely future demands
• Ability to improve attractiveness through • Competing demands for road-space from oth-
increasing car parking charges in district er sustainable modes (cycling and e-mobility)
centres
• Ability to raise the bar by moving from high
quality and frequency corridors to a BRT style
specification on key routes
• Continued enhancements to the ticketing
offer through the Robin Hood multi-operator
platform
• Potential greater reach and engagement with
minority groups.
• Enhanced Marketing Plan to improve aware-
ness and benefits of public transport.
39Section 3 - Headline targets
The Core Targets for measuring the success of the BSIP are set out below.
Baseline 2022-23 2023-4 2024-5 2030-31
Core indicators
Passenger Satisfaction 95% (2019) 93% 95% 96% 97%
Passenger Growth 61.39m (2019) -10% 0% 2% 10%
Reliability 91.5% (2019/20) 92% 93% 94% 95%
16.15 kph or 3 min
Journey Time 43 sec per bus km 16.2kph 16.5kph 17kph 17.2kph
(Oct 2021)
Additional Monitoring
Value for Money 78% (2019) 78% 79% 80% 81%
Punctuality 81% (2019) 80% 82% 83% 84%
Public Transport Information 73% (2020) 74% 75% 76% 78%
These targets have been set to best reflect the aims and objectives set out in Chapter One and draw
upon data which is already available through the existing partnership arrangements. We have defined
baseline data and targets for 4 mandatory indicators, (as defined by DfT), plus an additional 3 local
indicators which enable us to assess how we are performing locally against the wider aspects of
bus delivery which are relevant to maintain and attract customers. The indicators, baseline data, and
targets will be reviewed as part of the first BSIP refresh, when we hope to have a better understanding
of the longer-term impacts of Covid on bus use. Data for each indicator will be reported six-monthly.
40Section 3 - Headline targets
The following sets out how we intend to monitor each target, along with commentary as to why the
indicator was chosen and previous performance:
Methodology and commentrary
Core indicators
Derived from annual Transport Focus Passenger Surveys, and reflects BSIP focus on
Passenger Satisfaction
meeting passenger needs. Nottingham has historically performed well against this indicators
(Highest = 97%; previous years were 92%, 94%, 91%), and hence target is to maintain
and continuously improve exceptionally high levels of passenger satisfaction (the slight
dip in 22/23 reflects expected network deterioration / congestion before improvements
are completed). The 2019 Transport Focus survey has been used as the baseline as this
represents the latest independent and representative survey undertaken. The reason for
all the improvements in this BSIP is to provide a better service for the passenger and this
indicator will help show the holistic impact of interventions.
Measured by reviewing operator patronage data on a route-by-route basis, which is
Passenger Growth
currently submitted to the Local Transport Authorities as part of their returns to the DfT, and
reflects BSIP ambition to grow patronage. In addition to overall passenger growth we will
also monitor patronage on a granular level – by area; corridor; service; ticket type; time
of day/day of week; demographic - to understand the impact of the different specific BSIP
measures, which will be used to inform the development of the BSIP in future years. Greater
Nottingham has seen increases in overall ‘bus and tram’ usage, and hence the indicator will
look at both sets of data independently and in aggregate (Chapter 2 provides background)
Measured using operator punctuality data, which is the percentage of services operating
to the Traffic Commissioner window of between -1 and +5 minutes of the scheduled
timing point. Reflects BSIP ambition to grow patronage through improving overall levels
of reliability as a result of enhanced bus priority, enforcement, and associated supportive
measures. Reliability will be measured for the whole of NCT’s network in Greater Nottingham
Reliability
which covers 85% of the market and all key corridors and geographic areas. Only NCT’s
data will be used initially as other operators adopt different methodology in measuring
reliability which may cloud the results, however as the BSIP develops we will look to obtain
a fully aggregated data set covering all operators. Data will be analysed on a route-by-
route basis to determine the impacts of the specific interventions identified on each of the
corridors set out in Chapter 4. Baseline data has been derived from a full year’s worth of
data (April 2019 – Mar 2020). The slight dip in 22/23 reflects expected network deterioration
/ congestion before improvements are completed.
Measured using operator data to record average journey speeds (kph) across the entire
network during a representative Autumn Week (1st week October) and Spring Week (3rd
week March – to avoid Easter). Reflects BSIP ambition to grow patronage through reducing
average bus journey times as a result of enhanced bus priority, enforcement, and associated
Journey Time
supportive measures. Data is recorded on a route-by-route basis enabling an understanding
of how specific measures on different corridors, set out in Chapter 4, impact on journey
time. Baseline data has been derived from a sample neutral week (w/c 21/10/21). Despite
the recent investments and improvements to bus operation, statistical analysis of local
timetables shows that bus journey times during the AM peak are longer than they were 20
years ago, rising from an average of 31 mins in 1999 to 36 mins in 2019. We will also work
with operators to monitor performance against Journey time consistency (maximum journey
time within 15% of minimum journey time).
41Section 3 - Headline targets
The following sets out how we intend to monitor each target, along with commentary as to why the
indicator was chosen and previous performance:
Indicator Methodology and commentrary
Additional
Derived from Transport Focus Annual Passenger Surveys. Nottingham has a high
Satisfaction
baseline, and a strong track record (Highest = 81%; previous years were 77% and
Value For
Money
79%), hence aim is to maintain high standards and continuously improve through
marketing and education alongside new Robin Hood fare products (as set out in Chapter
4). The slight dip in 22/23 reflects expected network deterioration / congestion before
improvements are completed.
Derived from Transport Focus Annual Passenger Surveys. Nottingham has a good track
record (Highest = 86%; previous years were 84%, 84%, 84%) so ambition is to return
Satisfaction
Punctuality
to previous high levels by 2024/25. The slight dip in 22/23 reflects expected network
deterioration / congestion before improvements are completed. This will supplement
the reliability targets and show whether the perceived punctuality reflects the actual
punctuality. This will help inform whether new ways of information dissemination and
marketing are required.
Derived from National Highways and Transport surveys for Nottingham, using the
Public Transport
latest survey (2020) as the baseline. This records the percentage satisfaction in the
Satisfaction
Information
public transport information available. Nottingham has a good track record (73% in
2020 compared to an average of 44%) so ambition is to maintain high standards and
continuously improve through extending and raising the prominence of the Robin Hood
brand.
As well as measuring and monitoring these targets, additional data will be collected to monitor performance
and to understand the success of the measures implemented to help guide the development of the
BSIP and bus network in the future. These include:
z Lost mileage per route - another indicator of reliability issues
z Targets for responding to complaints and responding to delayed/cancelled services, as
identified in the Passenger Charter – to monitor whether the quality aspects and commitments
to passengers are being maintained.
z Percentage of population that have access to a frequent bus service at different times of the day
and days of the week – to guide network development, particularly when new developments
are built.
z The proportion of public transport use as modal share to access the city centre - , pre-pandemic
the levels of use within the inner traffic cordon were around 40%.
42Section 4 - Delivery
Delivering intensive services and investment on key corridors, with
routes that are easier to understand
Nottingham’s Robin Hood Network has extensive turn up and go corridors along all main corridors.
There are however a small number of areas that do not benefit from a 10 minute day frequency and
15 minute evening frequency or are not within 400m of this type of turn up and go corridor. Where this
is the case, we will work with operators to understand the opportunities for service enhancements,
and the commercial viability and sustainability of these in future years. Routes with identified future
or latent demand will be prioritised with a view that some kickstart funding will enable those routes to
become commercial quicker, enabling investment elsewhere in the future. Assuming public subsidy
rules permit, and a long-term funding settlement is provided by government, we will look to enhance the
bus services in a phased approach. To support this activity we will if appropriate look to procure network
strategic planning and network scheduling tools and we will ensure that we work with developers and
local planning authorities to ensure that buses are integral to new development and good levels of
section 106 funding are secured to support their operation.
It is important to recognise that the Covid pandemic has had a huge impact on bus patronage and
services in the Greater Nottingham area are not yet seeing patronage at pre-Covid levels. At the
moment, patronage is around 75% of pre-pandemic levels, and it is hoped that this will increase over
coming months with the return to offices, schools and universities. However, commuters are less likely
to travel as much as they did previously, and more people are seeking services more locally, suggesting
city centres will face more of a challenge in obtaining pre-pandemic levels of patronage.
Nottingham’s Robin Hood Network is a well-recognised brand that has been built up over the years
and provides a simple London Underground style mapped network of turn up and go services that link
into a complementary tram network. A hub and spoke model, which focuses service interchange on the
city centre and key district centres such as Beeston and West Bridgford, supported by widespread real
time information at stops, interchanges and bus stations, supports the legibility of the current network
and routes.
A significant bus service improvement programme is currently being delivered via the Transforming
Cities Programme, delivering bus lanes; traffic light priority; real time information upgrades; further
development of contactless payment and smart ticketing and a new bus-based park and ride site to
the north of the city. The BSIP will build on these improvements, mirroring the corridor improvement
approach along other key corridors.
These will be targeted for the delivery of further traffic light priority, real time information upgrades,
standardisation of branding and timetable information, bus priority and eliminating operator pinch points.
This targeted approach will support the reliability and efficiency of bus services, reducing journey times
43You can also read