BOARD PACKET March 1 5, 202 2 - Grand Junction Regional Airport

Page created by Yvonne Leonard
 
CONTINUE READING
BOARD PACKET March 1 5, 202 2 - Grand Junction Regional Airport
BOARD PACKET
      March 1 5, 202 2
BOARD PACKET March 1 5, 202 2 - Grand Junction Regional Airport
Grand Junction Regional Airport Authority

Date:          March 15, 2022

Location:
GRAND JUNCTION REGIONAL AIRPORT
2828 WALKER FIELD DRIVE
GRAND JUNCTION, CO 81506
AIRPORT TERMINAL - 3rd FLOOR CONFERENCE ROOM
or
Electronic Meeting
Link: https://us02web.zoom.us/j/81917996325?pwd=WUFhSkF0ci9IWDhSdjU0MzkrUENUUT09

Time:          5:15 PM

REGULAR MEETING AGENDA

    Call to Order
    Pledge of Allegiance
    Approval of Agenda
    Commissioner Comments
     Citizens Comments
The Grand Junction Regional Airport Authority welcomes respectful public comments at its
meetings. The Citizens Comment section is open to all individuals that would like to comment. If
you wish to speak under the Citizens Comment portion of the agenda, please e-mail your
comment to the Board Clerk (boardclerk@gjairport.com) 15 minutes prior to the meeting.
Comments not related to specific agenda items will be addressed during the citizen comment
section of the agenda. Citizen comments related to a specific action item will be addressed during
the discussion of that action item. The Board Chair will indicate when you may come forward and
comment. Please state your name for the record. Presentations are limited to three minutes and
yielding time to others is not permitted. Speakers are to address the Chair, not each other or the
audience, and are expected to conduct themselves in an appropriate manner. The use of abusive
or profane language shall not be allowed. No debate or argument between speakers and/or
members of the audience shall be permitted.
    Consent Agenda
     A. February 15, 2022 Meeting Minutes _____________________________________ 1
            - Approve the February 15, 2022 Board Meeting Minutes.
     B.   March 1, 2022 Meeting Minutes _________________________________________ 2
            - Approve the March 1, 2022 Special Board Meeting Minutes.
     C.   Knott Laboratory Scope of Work - Gate 6 Retaining Wall Improvements _________ 3

                                        March 15, 2022
BOARD PACKET March 1 5, 202 2 - Grand Junction Regional Airport
- Authorize the Executive Director to accept the Engineering Proposal & Terms of
         Engagement with Knott Laboratories not to exceed $18,000 to complete a design
         to repair the retaining wall outside gate #6 on the East Apron.
D.    Memorandum of Understanding with CDOT Division of Aeronautics ____________ 4
       - Accept the Memorandum of Understanding (MOU) with the Colorado
         Department of Transportation Division of Aeronautics for the Aviation Weather
         Camera Installation at the airport and authorize the Executive Director to sign
         the MOU.
 E.   2022 Airport Goals ____________________________________________________ 5
       - Adopt the 2022 Goals for the Grand Junction Regional Airport.
Action
 A. Executive Director 2022 Employment Contract Amendment __________________ 6
       - Approve the proposed amendment to the Executive Director’s Employment
         Contract.
Discussion
 A. Airport Development Plan Update – InterVistas
Staff Reports
 A. Executive Director Report (Angela Padalecki)
 B.    Finance and Activity Report (Sarah Menge) _______________________________ 7
 C.    Capital Improvement Plan Update (Colin Bible)
Any other business which may come before the Board
Adjournment

                                  March 15, 2022
BOARD PACKET March 1 5, 202 2 - Grand Junction Regional Airport
Grand Junction Regional Airport Authority Board
                                   Regular Board Meeting
                                       Meeting Minutes
                                      February 15, 2022

REGULAR BOARD MEETING
I.     Call to Order
Mr. Tom Benton, Board Chairman, called the Meeting of the Grand Junction Regional Airport
Authority Board to order at 5:15 PM on February 15, 2022 in Grand Junction, Colorado and in the
County of Mesa. The meeting was hosted in the 3rd floor conference room as well as electronically.

  Commissioners Present:                      Guests:
   Tom Benton (Chairman)                      Colin Bible, Garver
   Clay Tufly (Vice Chairman)                 Brad Rolf, Mead and Hunt
   Rick Taggart                               Jeremy Lee, Mead and Hunt
   Linde Marshall                             Josh Cohn, InterVISTAS
   Ron Velarde                                Brian Mohr, InterVISTAS
   Erling Brabaek (Joined at 5:50pm)          Kyle Williams, AECOM

  Airport Staff:
   Angela Padalecki (Executive Director)
   Dan Reimer (Counsel)
   Sarah Menge
   Dylan Heberlein
   Ben Peck
   Cameron Reece (Clerk)
   Shelagh Flesch

II.    Pledge of Allegiance

III. Approval of Agenda
Commissioner Tufly made a motion to approve the February 15, 2022 Board Agenda.
Commissioner Marshall seconded the motion. Roll Call Vote: Commissioner Benton, yes;
Commissioner Marshall, yes; Commissioner Taggart, yes; Commissioner Tufly, yes, and
Commissioner Velarde, yes. The motion carries.

IV.    Commissioner Comments
                                                                February 15, 2022 Minutes – Page 1
BOARD PACKET March 1 5, 202 2 - Grand Junction Regional Airport
Commissioner Benton commented that Commissioner Velarde is a proud new Grand Parent of a
new baby boy. Commissioner Velarde was very thankful of the announcement.

Commissioner Benton also recognized Colin Bible from Garver for receiving an award of the top
40 Airport business consultants under 40 years of age.

Commissioner Benton gave other commissioners a heads up of the upcoming Board Workshop
agenda on March 1st with 2022 goals and a presentation from Harrison Earl concerning Air
Service updates as well as a more hefty Regular Board meeting agenda on March 15th and to
please attend.

V.      Citizen Comments
No Citizen Comments were made

VI.       Consent Agenda

       A. January 18, 2022 Meeting Minutes
          Approval of January 18, 2022 Board Meeting Minutes

       B. February 1, 2022 Meeting Minutes
          Approval of February 1, 2022 Special Board Meeting Minutes

       C. Lease Assignment – Klinglesmith Enterprises, LLC and V&S Holdings, LLC
          Approve the lease assignment between Klinglesmith Enterprises, LLC and V&S Holdings,
          LLC and authorize the Executive Director to execute the assignment.

Commissioner Tufly made a motion to approve the Consent Agenda. Commissioner Taggart
seconded the motion. Roll Call Vote: Commissioner Benton, yes; Commissioner Marshall, yes;
Commissioner Taggart, yes; Commissioner Tufly, yes, and Commissioner Velarde, yes. The motion
carries.

VII.      Discussion
       A. 2022 Goals
       B. Airport Development Plan Update – InterVISTAS

VIII.     Staff Reports
          A. Executive Director Report (Angela Padalecki)
          B. Finance and Activity Report (Sarah Menge)
          C. Capital Improvement Program Update (Colin Bible)

IX.       Any other business which may come before the Board

X.        Adjournment

                                                                February 15, 2022 Minutes – Page 2
BOARD PACKET March 1 5, 202 2 - Grand Junction Regional Airport
The meeting adjourned at approximately 6:15pm

      Audio recording of the complete meeting can be found at
      https://gjairport.com/Board_Meetings

Tom Benton, Board Chairman

ATTEST:

Cameron Reece, Clerk to the Board

                                                            February 15, 2022 Minutes – Page 3
BOARD PACKET March 1 5, 202 2 - Grand Junction Regional Airport
Grand Junction Regional Airport Authority Board
                                   Special Board Meeting
                                      Meeting Minutes
                                       March 1, 2022

REGULAR BOARD MEETING
I.     Call to Order
Mr. Tom Benton, Board Chairman, called the Meeting of the Grand Junction Regional Airport
Authority Board to order at 5:15 PM on March 1, 2022 in Grand Junction, Colorado and in the
County of Mesa. The meeting was hosted in the 3rd floor conference room as well as electronically.

 Commissioners Present:                       Guests:
  Tom Benton (Chairman)                       Harrison Earl, CMT
  Clay Tufly (Vice Chairman)                  Brad Rolf, Mead and Hunt
  Linde Marshall                              Jeremy Lee, Mead and Hunt
  Ron Velarde                                 Sam Seibold, Twin Otter
  Erling Brabaek                              Fred Suevel, CAF
  Thaddeus Shrader

 Airport Staff:
  Angela Padalecki (Executive Director)
  Dan Reimer (Counsel)
  Sarah Menge
  Dylan Heberlein
  Ben Peck
  Cameron Reece (Clerk)
  Shelagh Flesch

II.  Approval of Agenda
Commissioner Shrader made a motion to approve the March 1, 2022 Special Board Agenda.
Commissioner Tufly seconded the motion. Voice Vote: All Ayes; motion carries.

III.   Commissioner Comments
Commissioner Benton congratulated staff on a well-done presentation to West Star expansion
here at the airport. Commissioner Benton mentioned the recent article in the Daily Sentinel about
the positive economic impact the West Star expansion will have for the community.

                                                                   March 1, 2022 Minutes – Page 1
BOARD PACKET March 1 5, 202 2 - Grand Junction Regional Airport
Commissioner Benton mentioned good job on snow removal to Director of Operations Mr.
Heberlein and staff and for keeping the airport open and running safely with a surprise storm.

Commissioner Shrader commented on about a year ago the board had mentioned a different
time of meetings and he felt that Commissioner Benton has done a great job running the
meetings efficiently. Commissioner Shrader mentioned a possible noon meeting time for the
board to take into consideration. Commissioner Benton commented about a possible conflict
with Commissioner Taggart’s schedule but would like to circle back around with the meeting time
adjustment.

IV.     Citizen Comments
No Citizen Comments were made

V.        Action

    A. Reimbursable Agreement with the Federal Aviation Administration (FAA) for Temporary
       Navigational Aid Design and Construction associated with the Runway 12/30 Relocation
       Project.
Commissioner Brabaek made a motion to a Approve Agreement AJW-FN-WSA-22-NM-005067 in
the amount of $538,630.26 with the FAA to design and temporarily relocate navigational aids
and authorize the Executive Director to sign the Agreement. Commissioner Tufly seconded the
motion. Voice Vote: All Ayes; motion carries.

VI.       Discussion
       A. Leakage Study Presentation – Harrison Earl, CMT
       B. Discuss Draft 2022 Airport Goals

VII.      Executive Session

Commissioner Marshall made a motion to move into Executive session pursuant to CRS Section
24-6-402(4)(f) to discuss personnel matters. More specifically to discuss the Executive Director’s
annual review and terms of her employment contract.
Commissioner Tufly seconded the motion. Voice Vote: All Ayes; motion carries.

Commissioner Tufly made a motion to move from Executive Session back into a public meeting.
Commissioner Brabaek seconded the motion. Voice Vote. All Ayes.

VIII.     Any other business which may come before the Board

IX.       Adjournment
          The meeting adjourned at approximately 8:29pm

                                                                     March 1, 2022 Minutes – Page 2
BOARD PACKET March 1 5, 202 2 - Grand Junction Regional Airport
Audio recording of the complete meeting can be found at
      https://gjairport.com/Board_Meetings

Tom Benton, Board Chairman

ATTEST:

Cameron Reece, Clerk to the Board

                                                                March 1, 2022 Minutes – Page 3
BOARD PACKET March 1 5, 202 2 - Grand Junction Regional Airport
Grand Junction Regional Airport Authority
 Agenda Item Summary

TOPIC:                  Knott Laboratory – Engineering Proposal and Terms of Engagement

PURPOSE:                Information ☐               Guidance ☐                    Decision ☒

RECOMMENDATION:         Authorize the Executive Director to accept the Engineering Proposal &
                        Terms of Engagement with Knott Laboratories not to exceed $18,000 to
                        complete a design to repair the retaining wall outside gate #6 on the East
                        Apron.

SUMMARY:                The retaining wall outside of Gate #6 on East Apron is in need of significant
                        repair. GJRAA staff and CIP manager Colin Bible have requested Knott
                        Laboratory to investigate the structural integrity of the retaining wall and
                        recommend a design for a repair. Additionally, this evaluation will
                        determine a long-term repair for the apron immediately adjacent to the
                        expansion joint.

                        Knott Laboratories was selected for this task based on their expertise in
                        forensic engineering on existing structures and based on our past work
                        with them on the structural analysis of the building. The Gate 6 repair is
                        adjacent to the floor stabilization and repairs designed by Knott
                        Laboratories in 2020 and they already have a working knowledge of the
                        surrounding structures.

                        Following the completion of this task order from Knott, we plan to work
                        with Colin Bible to use the design specifications to estimate construction
                        costs and will submit the construction costs for separate approval as
                        necessary based on the purchase and procurement policy.

REVIEWED BY:            Executive Director, Facilities Director, Finance Director, CIP Manager, Colin
                        Bible
FISCAL IMPACT:          $14,500 – $18,000

ATTACHMENTS:            Knott Laboratory Engineering Proposal & Terms of Engagement
STAFF CONTACT:          Ben Peck
                        bpeck@gjairport.com
                        970-248-8589
7185 South Tucson Way
                                                                                   Centennial, CO 80112
                                                                           p 303.925.1900 ● f 303.925.1901
                                                                                       www.knottlab.com

             Engineering Proposal & Terms of Engagement
 Date of Assignment:                  1/11/2022
 Project Name/Reference:              Grand Junction Regional Airport
 Project Address:                     2828 Walker Field Drive, Grand Junction, CO
                                      81506
 Client Name:                         Ben Peck
 Client Company:                      Grand Junction Regional Airport
 Client Email:                        bpeck@gjairport.com

Scope of Project
       ☒       Inspect the Property
       ☐       Perform Fire Origin and Cause Investigation
       ☐       Provide Verbal Findings
       ☐       Provide Engineering Report
       ☒       Provide Engineering Plans
       ☐       Collect Evidence
       ☐       Other:

Fees: ☒ Time and Material ☒ Estimated Fee _(Below)__☐ Flat Rate ________

Thank you for contacting Knott Laboratory! We received the above information and
Stanley Stoll, M.Eng., PE, DFE, CFEI, CVFI has been assigned to your project.
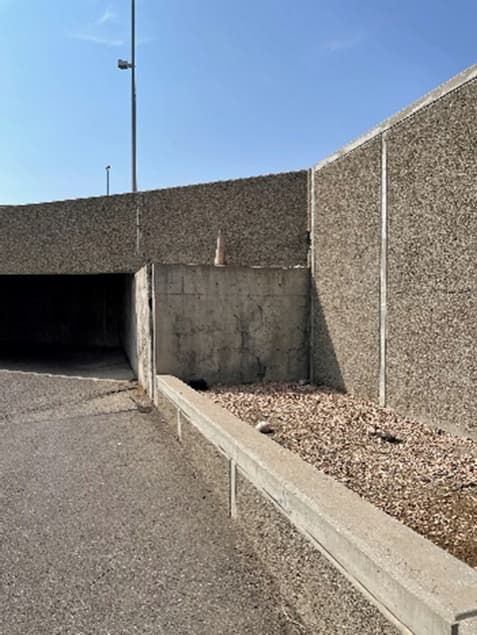
Project Description
Per our conversations, we understand that the airport would like an engineering evaluation and
repair recommendations for the concrete retaining wall shown in Figure 1 below. This will also
include helping to determine a long-term repair for the apron immediately adjacent to the expansion
joint as well.
    1. Budget:
            a. Evaluation: Initial evaluation is in the $2,500 – $3,000 range. As part of the initial
               evaluation, it may be beneficial to perform concrete coring or other investigative
               destructive testing to help develop the most thorough and appropriate repair. The
               fees for contractors or others subconsultants are not included herein and will need
               to be obtained at that time.
            b. Design: Estimated to be in the $12,000 – $15,000 range, but dependent upon the
               findings of our initial evaluation.
            c. Construction administration and inspections – hourly as needed.

            Branch Offices: Colorado Springs, CO ● Fort Collins, CO ● Grand Junction, CO
                                              Phoenix, AZ ● Houston, TX ● San Antonio, TX
7185 South Tucson Way
                                                                                           Centennial, CO 80112
                                                                                   p 303.925.1900 ● f 303.925.1901
                                                                                               www.knottlab.com

                                    Figure 1 - Subject retaining wall (scope).

    2. Timeline:
          a. We are generally available to start our evaluation within 3 weeks of receiving a
              signed copy of this engagement letter. Please let us know if you have project
              specific time constraints you would like us to incorporate.

This scope and proposed estimate are based upon the information currently available to us. Should
additional information be obtained that would impact this scope or our estimated fee, you will be
notified of such information and budget impact before work beyond this scope is conducted.

Exclusions
Additional services such as architectural, mechanical, electrical, concrete testing, destructive testing, and/or
plumbing considerations are not included in the estimated budget. Knott may require the assistance of
additional consultants to complete these services whose fees are unknown at this time. The repair drawings
provided will be intended for the initial submittal to the building department; however, due to the variable
requirements of the local building departments, additional work pertaining to construction permitting will be
billed at an hourly rate. After construction has begun, Knott may be contacted to
conduct additional Construction Administration services such as the assessment of additional damage not
visible during the initial inspection or onsite compliance observations. The estimated fees for
the Construction     Administration      services      for    this    type    of   project     are     generally
between $300.00 to $500.00 per        inspection     trip. If   Knott    determines    that additional    repair
drawings will exceed these estimates, the Client will be notified, and additional expenses shall not be
incurred without the Client’s authorization.

Knott has attempted to anticipate all relevant variables; however, unforeseen issues and Client requests
occasionally arise as construction progresses. In addition, the estimate for repair drawings does
not anticipate large-scale repairs. If these are discovered Knott may be required to revise the estimate to
complete the repair drawings. If any of these issues occur, the Client will be immediately notified, and
additional expenses shall not be incurred without the Client’s prior authorization.

Knott is available to begin as stated above and receiving the client’s acceptance of this proposal. The actual
start date is subject to coordination with ongoing work, weather, and the availability of the site and the ever-
changing economic conditions. This proposal is valid for 30-days and may need to be modified if not signed
within this window. If any of the above is objectionable, please contact us immediately to discuss the terms.
If the terms are acceptable, please acknowledge such by signing this document and returning it to Knott
Laboratory, LLC.

             Branch Offices: Colorado Springs, CO ● Fort Collins, CO ● Grand Junction, CO
                                               Phoenix, AZ ● Houston, TX ● San Antonio, TX
7185 South Tucson Way
                                                                                                      Centennial, CO 80112
                                                                                              p 303.925.1900 ● f 303.925.1901
                                                                                                          www.knottlab.com

☐ Please Invoice:
   Ben Peck                                                      bpeck@gjairport.com
   Grand Junction Regional Airport                               970-244-9100
   PO Number:

Responsible Parties
Name: Stanley Stoll, M.Eng., PE, DFE, CFEI, CVFI

Signature: ___________________

Date:_____1-11-2022__________________

Name:

Signature:

Date:

Fees
The principal basis for computing our fees will be the amount of time spent on the matter by the forensic engineers and
animators involved, multiplied by their individual hourly billing rates. Currently, I anticipate being the principal engineer
responsible for this matter. I have attached our Rate Sheet which sets forth our current hourly rates. During this
engagement, assistance may also be provided by other engineers or animators in the Company. Our billing rates are
subject to change, and are reviewed and adjusted annually on January 1st. Any changes thus will be reflected in your
January statement.

Estimates
Any estimate of fees and costs that we may have discussed is only an estimate and not an agreement to a fixed or
maximum fee unless stated otherwise. It is also expressly understood that payment of the Company’s fees and costs is
not contingent on the outcome of the matter.

Payment of Invoices
You will be billed for fees and costs on a semi-monthly basis. Payment is due upon receipt of the invoice, unless other
arrangements are made in writing. If any invoice remains unpaid for more than 30 days, we may suspend performing
services until satisfactory arrangements have been made for payment of outstanding statements and future fees and
expenses. A delinquency charge of 2 percent (2%) per month (24% per annum) may be assessed on unpaid balances
outstanding over 30 days from invoice date. In the event we are asked to testify at a deposition, trial, arbitration, or other
adversary proceeding in this matter, you agree to pay all outstanding invoices in full prior to such testimony.

Thank you for choosing Knott Laboratory, we look forward to serving you!

               Branch Offices: Colorado Springs, CO ● Fort Collins, CO ● Grand Junction, CO
                                                 Phoenix, AZ ● Houston, TX ● San Antonio, TX
Grand Junction Regional Airport Authority
Agenda Item Summary

TOPIC:                  Memorandum of Understanding with CDOT Division of Aeronautics

PURPOSE:                Information ☐                  Guidance ☐                        Decision
                                                                                         ☒
RECOMMENDATION:         Accept the Memorandum of Understanding (MOU) with the Colorado
                        Department of Transportation Division of Aeronautics for the Aviation
                        Weather Camera Installation at the airport and authorize the Executive
                        Director to sign the MOU.

SUMMARY:                The CDOT Division of Aeronautics has partnered with the FAA to install
                        weather cameras at 30 airports across the state and the Division staff
                        determined that GJT would be a great candidate for inclusion in this
                        project. The cameras will provide pilots with real-time photos and
                        timelapses of actual conditions at different airports throughout the
                        state to supplement weather data that is provided separately in
                        preparing flight plans.

                        The MOU will authorize the Division to install, configure and
                        commission the cameras at the Division’s expense. This will include the
                        maintenance, troubleshooting and shipment of parts, not to exceed
                        three years from commissioning. The Airport will provide the mounting
                        location in addition to the power source required to operate the
                        cameras at its own expense. The FAA will provide technical support,
                        provide remote monitoring and outage notifications. The camera
                        images will be displayed on the designated FAA website.

REVIEWED BY:            Execute Director and Legal Counsel

FISCAL IMPACT:          Small increase in utilities expected

ATTACHMENTS:            Memorandum of Understanding (MOU) for the Aviation Weather
                        Camera Installation at the Grand Junction Regional Airport (GJT)
STAFF CONTACT:          Dylan Heberlein
                        dheberlein@gjairport.com
                        970-248-8596
Memorandum of Understanding (MOU) for the Aviation Weather Camera Installation at the Grand
Junctional Regional Airport (GJT)

This Memorandum of Understanding outlines the respective commitments of the Colorado Department of
Transportation’s Division of Aeronautics (Division) and the Grand Junctional Regional Airport (Airport) for
the installation and maintenance of Federal Aviation Administration (FAA)-installed aviation weather
cameras at the Airport.

Division of Aeronautics

The Division will:
   • Partner with the FAA for the initial installation, configuration, and commissioning of FAA aviation
       weather cameras and related equipment at the Airport at the Division’s expense.
   • For a period of not less than three years from the date of commissioning:
           o Retain sole ownership of the cameras and related equipment.
           o Pay for the costs of system maintenance, replacement parts, and cellular data connectivity.
           o Assist the Airport with troubleshooting camera outages or issues.
           o Ship replacement parts or equipment to the Airport at the Division’s expense.

Airport

The Airport will:
   • Provide, at no cost to the Division or FAA, a suitable mounting location for the FAA aviation weather
       cameras, as well as standard 120vac power for the system and necessary space for the camera
       control unit and related equipment.
   • Assist the Division and FAA in troubleshooting camera system issues, with the technical support and
       guidance of the FAA and/or Division.
   • Install, with the technical support and guidance of the FAA and/or Division, replacement system
       components as necessary.
   • Assist the FAA and Division with regular monitoring of the camera system functionality and advise the
       FAA and Division of any malfunctions or outages noted with the Airport’s weather camera system.

Federal Aviation Administration

Per the reimbursable agreement with the Division for Phase III of the aviation weather camera program
dated February 15, 2022, the FAA will:
   • Provide ongoing technical advisory support to the Division and the Airport with camera operation and
       restorals.
   • Capture aviation weather camera images and display them on the designated FAA website.
   • Provide remote monitoring and outage notifications to the Division.

   __________________________________________2/15/2022_
   David Ulane, Aeronautics Director              Date
   Colorado Division of Aeronautics

   ___________________________________________________
   Name/Title                                     Date
   Grand Junctional Regional Airport
Grand Junction Regional Airport Authority

Agenda Item Summary
TOPIC:                 2022 Airport Goals
PURPOSE:               Information ☐            Guidance ☐           Decision ☒
RECOMMENDATION:        Adopt the 2022 Goals for the Grand Junction Regional Airport.
SUMMARY:               Refer to the attached summary of 2022 Airport Goals.

REVIEWED BY:           Executive Director

FISCAL IMPACT:         N/A

ATTACHMENTS:           2022 Airport Goal Summary

STAFF CONTACT:         Angela Padalecki
                       apadalecki@gjairport.com
                       Office: 970-248-8588
Airport 2022 Goals

1. Put Air Service Back on a Growth Trajectory              3. Exceed 2022 nonairline revenue budget by 5%
 a. Execute new airline use and lease agreements             a. Complete Tailwind remodel with no decrease in revenue per
 b. Establish two new target destinations by 2023               enplanement
 c. Exceed budgeted 2022 enplanements                        b. Complete and begin implementation of project plan to enable
 d. Better promote GJT airline ticket purchases                 parking growth
 e. Work collaboratively with the Air Service Alliance on    c. Enhance ground transportation program through:
    Marketing                                                  a. New rental car agreements with improved branding options
                                                               b. Modernized ground transportation permits, rates and charges
2. Improve Airport Sustainability                           4. Increase Employee Engagement
 a. Complete the Airport Development Plan and 5-year CIP     a. Modernize the organization chart and performance management
 b. Begin project design and construction on 2022 and 2023      system
    projects                                                 b. Maintain an employee turnover rate below the community and
 c. Create an efficient system for managing ground leases       industry average
 d. Remain on schedule and budget for the runway 11/29       c. Implement employee engagement surveys
    replacement program (2030) and runway 4/22 rehab
    (2023)                                                 5. Maintain and Increase Community Engagement
                                                             a. Host the Colorado Airport Operators Association Annual meeting
                                                             b. Prepare for the 2023 Air Show
                                                             c. Continue growing community hosted events on airport: United
                                                                Way Plane Toss, Latimer House Men In Heels Race, etc.

                                                             Page 1
Grand Junction Regional Airport Authority
Agenda Item Summary

TOPIC:                  Executive Director 2022 Employment Contract Amendment
PURPOSE:                Information ☐          Guidance ☐            Decision ☒
RECOMMENDATION:         Approve the proposed amendment to the Executive Director’s
                        Employment Contract
SUMMARY:                The Board conducted the Executive Director’s annual review and
                        directed that an amendment to the Executive Director’s
                        Employment Contract be prepared for consideration at the
                        March regular meeting of the Board. As presented, the
                        amendment increases the Executive Director’s annual salary by
                        4% from $170,070 to $176,872.80 with an effective date of
                        January 1, 2022 and provides for a one-time bonus for
                        outstanding performance of $5,102.10 (3% of the respective
                        annual salary for 2021).

                        The proposed amendment also makes changes to language
                        about the use of paid time off and sick leave and subscriptions
                        and travel to be consistent with the policies and practices of
                        other department directors and employees.

REVIEWED BY:            Executive Committee and Legal Counsel

FISCAL IMPACT:          $11,904.90 increase to salaries and wages in 2022

ATTACHMENTS:            3rd Amendment to the Executive Director’s Employment Contract

STAFF CONTACT:          Dan Reimer
                        Legal Counsel
                        Email: dan@airportcounselor.com
                        Phone: 303-596-2170
EMPLOYMENT AGREEMENT
                                   THIRD AMENDMENT

This Third Amendment to the Employment Agreement by and between the Grand Junction
Regional Airport Authority and Angela Padalecki is made and entered as of the date last signed
below.

       WHEREAS, the Grand Junction Regional Airport Authority (“Authority”) and Angela
       Padalecki (“Employee”) (together referred to as the “Parties”) entered into the
       Employment Agreement with an effective date of January 8, 2018, providing for Employee
       to serve as Executive Director of the Grand Junction Regional Airport (“Airport”) owned
       and operated by the Authority.

       WHEREAS, the Parties amended the Employment Agreement on April 16, 2019, with an
       effective date of January 8, 2019 (“First Amendment”) and further amended the
       Employment Agreement on March 24, 2020, with an effective date of January 8, 2020
       (“Second Amendment”).

       WHEREAS, the First Amendment increased the Employee’s annual salary by 2.7% to
       $164,320 and provided a 1.3% one-time bonus of $2,080, and the Second Amendment
       increased the Employee’s annual salary by 3.5% to $170,070 and provided a 0.5% one-
       time bonus of $800.

       WHEREAS, in March 2021, the Authority decided not to increase Employee’s annual salary
       or provide a bonus, based solely on the downturn in Airport traffic and operating revenue
       and not as a measure of Employee’s performance.

       WHEREAS, the Parties mutually desire to amend the Employment Agreement to increase
       Employee’s annual salary, provide a bonus and make additional changes to the terms of
       employment.

NOW, THEREFORE, IN CONSIDERATION OF THE MUTUAL COVENANTS HEREIN CONTAINED, THE
PARTIES AGREE AS FOLLOWS:

   1. In Section 4, Compensation, the first paragraph is deleted and replaced as follows:

       The Authority awarded Employee a 4% pay increase for a new annual salary of
       $176,872.80 effective January 1, 2022, for her services rendered under this Agreement
       payable on the same payroll schedule as other Authority employees. For the outstanding
       performance during the time period of January 8, 2021 to December 31, 2021, Employee
       shall be paid a one-time bonus of $5,102.10 (3% of the respective annual salary for 2021).

                                               1
2. Section 5, Paid Time Off and Sick Leave, is deleted and replaced in its entirety as follows:

       Employee shall begin her employment with two (2) weeks paid time off and shall
       thereafter accrue paid time off and sick leave in the same manner as other full-
       time Authority employees as set forth in the Employee Handbook. To the extent
       possible, leave shall be coordinated with the Department Directors to ensure
       impacts to Airport operations are minimized. Leave shall be consistent with
       policies and practices applicable to the Department Directors.

   3. Section 8, Subscriptions and Travel, is deleted and replaced in its entirety as follows:

       The Authority agrees to pay Employee’s professional dues and subscriptions
       necessary for Employee’s participation in national, regional, and state
       organizations which shall be considered annually as part of the budget approval
       process. Employee shall identify as best as possible workshops, conferences, and
       professional events for the year ahead during Employee’s annual performance
       review. It is the Authority’s belief that active involvement in industry affairs is a
       benefit to the Employee as well as the Airport. Expenses for lodging, meals, travel,
       and incidentals shall be reimbursed in the same manner as for other Authority
       employees, consistent with the Employee Handbook and policies of the Authority.

   4. In Section 9, Performance Evaluation, the first paragraph, second sentence, shall be
      modified to read as follows:

       This evaluation shall be completed generally in the first quarter of each year, or at
       such other time as may be determined by the Authority.

   5. All other terms and conditions of the Employment Agreement shall remain unchanged.

IN WITNESS WHEREOF, the Authority has caused this Third Amendment to be signed and
executed on its behalf by its Chairman, and Angela Padalecki has signed and executed this Third
Amendment.

 By: ________________________________               _____________________
 Tom Benton, Chairman                               Date
 Grand Junction Regional Airport Authority

 By: ________________________________               _____________________
 Angela Padalecki                                   Date
 Employee

                                                2
GRAND JUNCTION REGIONAL AIRPORT

January  2022
DATA & STATISTICS
Passenger Enplanements (Rev & Non-Rev only)
9,000                                                                                                                                   2022 Market Share
8,000
               January                   2020
7,000                                                                                                                                                           Allegiant
                                                                                                           Allegiant                           14%
6,000
                                                                                                           American               27%                           American
5,000
                                                                                                           Avelo
4,000
                                                                                                           Delta                                                Delta
                                                                                                                         1%
3,000                                                                                                      Frontier           6%
2,000                                                                                                      United                                               Frontier
                                                                                                                                                   52%
1,000
   0                                                                                                                                                            United
        JAN       FEB    MAR      APR   MAY      JUN   JUL       AUG      SEP    OCT    NOV        DEC

                                 American
               Allegiant (SNA,                     Avelo                           Frontier                           Denver Air                                 Annual
                                (DFW, PHX,                       Delta (SLC)                       United (DEN)                  Charters            Total
                 AZA, LAS)                         (BUR)                           (DEN)                               Charters                                  Inc/Dec
    2022                           LAX)
  JAN                     2,180        7,725                 0            975                 88          4,013                    0           0       14,981           47.9%
  FEB                                                                                                                                                       0
  MAR                                                                                                                                                       0
  APR                                                                                                                                                       0
  MAY                                                                                                                                                       0
  JUN                                                                                                                                                       0
  JUL                                                                                                                                                       0
  AUG                                                                                                                                                       0
  SEP                                                                                                                                                       0
  OCT                                                                                                                                                       0
  NOV                                                                                                                                                       0
  DEC                                                                                                                                                       0
  TOTAL                  2,180          7,725            -               975                  88          4,013               -            -          14,981
Market Share             14.55%         51.57%         0.00%            6.51%            0.59%           26.79%            0.00%          0.00%       100.00%

                           American
         Allegiant (SNA,                           Avelo                           Frontier                           Denver Air
                          (DFW, PHX,                             Delta (SLC)                       United (DEN)                  Charters            Total
           AZA, LAS)                               (BUR)                           (DEN)                               Charters
    2021                     LAX)
  JAN                 939        4,854                      0            1,603               0             2,731                0            0         10,127
  FEB               1,194        5,135                      0            1,681               0             3,275                0          150         11,435
  MAR               1,880        7,492                      0            2,486               0             4,134                0            0         15,992
  APR               1,675        9,768                      0            2,846               0             4,718                0            0         19,007
  MAY               1,530        9,766                    800            3,962               0             5,262               50            0         21,370
  JUN               1,449       10,720                  1,414            4,664             564             7,187                0            0         25,998
  JUL               1,518       11,314                  1,652            4,952             420             7,950                0            0         27,806
  AUG               1,380       10,313                    640            4,540           1,900             9,544                0            0         28,317
  SEP               1,570       10,203                      0            4,512           1,107            10,004                0            0         27,396
  OCT               2,597       12,947                      0            4,084           1,040             7,785                0            0         28,453
  NOV               2,980        8,962                      0            3,821             746             6,273                0            0         22,782
  DEC               1,653        8,500                      0            3,445             581             6,331                0            0         20,510
  TOTAL           20,365      109,974                  4,506           42,596           6,358            75,194               50          150        259,193
Market Share             7.86%          42.43%         1.74%           16.43%            2.45%           29.01%            0.02%          0.06%       100.00%
Passenger Deplanements
  9,000
  8,000        January                    2020                                                                                                     2022 Market Share
                                                                                                                                                                           Allegiant
  7,000
                                                                                                                          Allegiant
  6,000                                                                                                                                                                    American
                                                                                                                          American                         14%
  5,000
                                                                                                                          Avelo                28%                         Avelo
  4,000
                                                                                                                          Delta
                                                                                                                                                                           Delta
  3,000
                                                                                                                          Frontier        0% 0%
                                                                                                                                             5%
  2,000                                                                                                                   United                          53%              Frontier
  1,000
                                                                                                                                                                           United
     0
           JAN      FEB     MAR    APR    MAY     JUN      JUL       AUG      SEP         OCT     NOV       DEC

                   Allegiant    American
                                                        Avelo                                   Frontier                             Denver Air                             Annual
    2022         (SNA, AZA, (DFW, PHX,                                   Delta (SLC)                              United (DEN)                  Charters         Total
                                                        (BUR)                                   (DEN)                                 Charters                              Inc/Dec
                    LAS)         LAX)
  JAN                     2,141       7,747                          0              672                    69            4,105                 0           0      14,734           45.6%
  FEB                                                                                                                                                                  0
  MAR                                                                                                                                                                  0
  APR                                                                                                                                                                  0
  MAY                                                                                                                                                                  0
  JUN                                                                                                                                                                  0
  JUL                                                                                                                                                                  0
  AUG                                                                                                                                                                  0
  SEP                                                                                                                                                                  0
  OCT                                                                                                                                                                  0
  NOV                                                                                                                                                                  0
  DEC                                                                                                                                                                  0
  TOTAL                   2,141          7,747                   -              672                        69            4,105             -          -          14,734
Market Share              14.53%         52.58%             0.00%              4.56%                  0.47%             27.86%            0.00%      0.00%       100.00%

                   Allegiant    American
                                                        Avelo                                   Frontier                             Denver Air
    2021         (SNA, AZA, (DFW, PHX,                                   Delta (SLC)                              United (DEN)                  Charters         Total
                                                        (BUR)                                   (DEN)                                 Charters
                    LAS)         LAX)
  JAN                     1,025       4,890                     0              1,656                      0               2,551               0         0         10,122
  FEB                     1,076       5,971                     0              1,707                      0               4,726               0       150         13,630
  MAR                     1,826       7,840                     0              2,632                      0               4,857               0         0         17,155
  APR                     1,552       9,269                     0              2,764                      0               4,653               0         0         18,238
  MAY                     1,571       9,492                   804              3,838                      0               5,385              50         0         21,140
  JUN                     1,541     10,740                  1,473              4,465                    581               6,728               0         0         25,528
  JUL                     1,285     11,146                  1,565              4,876                    399               7,573               0        50         26,894
  AUG                     1,447       9,703                   674              4,484                  1,861               9,481               0         0         27,650
  SEP                     1,469     10,381                      0              4,553                  1,163              10,240               0        61         27,867
  OCT                     2,233     11,961                      0              3,910                  1,180               7,589               0         0         26,873
  NOV                     3,090       8,236                     0              3,835                    648               6,433               0         0         22,242
  DEC                     1,598       8,811                     0              3,674                    676               6,880               0         0         21,639
  TOTAL                19,713     108,440                  4,516             42,394                  6,508              77,096              50       261        258,978
Market Share              7.61%          41.87%             1.74%             16.37%                  2.51%             29.77%            0.02%      0.10%       100.00%
Capacity
12,000
               January                    2020                                                                                           2022 Market Share
10,000
                                                                                                                                                              Allegiant
 8,000                                                                                                           Allegiant
                                                                                                                                       22%          23%
                                                                                                                 American                                     American
 6,000                                                                                                                        1%
                                                                                                                 Delta
                                                                                                                                                              Delta
 4,000                                                                                                           Frontier         6%
                                                                                                                 United
                                                                                                                                                              Frontier
 2,000

     0                                                                                                                                                        United
                                                                                                                                             48%
         JAN      FEB    MAR      APR   MAY   JUN    JUL       AUG     SEP   OCT     NOV          DEC

                                 American
               Allegiant (SNA,                      Avelo                          Frontier             United                                                Annual
    2022                        (DFW, PHX,                         Delta (SLC)                                      Denver Air Charters            Total
                 AZA, LAS)                          (BUR)                          (DEN)                (DEN)                                                 Inc/Dec
                                   LAX)
  JAN                     4,599        9,766                   0         1,300             180            4,416                    0          0      20,261     -17.8%
  FEB                                                                                                                                                     0
  MAR                                                                                                                                                     0
  APR                                                                                                                                                     0
  MAY                                                                                                                                                     0
  JUN                                                                                                                                                     0
  JUL                                                                                                                                                     0
  AUG                                                                                                                                                     0
  SEP                                                                                                                                                     0
  OCT                                                                                                                                                     0
  NOV                                                                                                                                                     0
  DEC                                                                                                                                                     0
  TOTAL                  4,599           9,766             -            1,300           180              4,416                -          -          20,261
Market Share             22.70%          48.20%        0.00%             6.42%                0          21.80%              0.00%      0.00%       100.00%

                          American
        Allegiant (SNA,                             Avelo                          Frontier             United
    2021                 (DFW, PHX,                                Delta (SLC)                                      Denver Air Charters            Total
          AZA, LAS)                                 (BUR)                          (DEN)                (DEN)
                            LAX)
  JAN              2,910       10,873                                    4,470                            6,400                  0          0        24,653
  FEB              3,270       10,243                                    3,920                            5,860                  0        175        23,468
  MAR              4,476       10,173                                    4,510                            5,560                  0          0        24,719
  APR              3,552       12,522                                    4,326                            5,100                  0          0        25,500
  MAY              2,808       10,796                 2,457              4,400                            5,808                 50          0        26,319
  JUN              2,496       13,689                 3,213              5,860         1,836              9,490                  0          0        36,584
  JUL              2,244       14,461                 3,212              6,191         1,098              8,998                  0          0        36,204
  AUG              2,496       11,365                 1,659              6,291         2,178             11,366                  0          0        35,355
  SEP              2,496       12,625                                    5,515         1,656             11,210                  0        186        33,688
  OCT              3,798       13,503                                    4,615         1,662              8,068                  0          0        31,646
  NOV              4,794        9,830                                    4,450         1,482              6,658                  0          0        27,214
  DEC              4,794        9,830                                    4,450         1,482              6,658                  0          0        27,214
  TOTAL          40,134      139,910                                   58,998                           91,176                 50        361       352,564
Market Share             11.38%          39.68%                         16.73%                           25.86%              0.01%      0.10%        93.78%
Load Factor
100%
90%        January                 2020
80%
70%                                                                                                                                      Allegiant
60%                                                                                                                                      American
50%                                                                                                                                      Avelo
40%                                                                                                                                      Delta
30%                                                                                                                                      Frontier
20%                                                                                                                                      United
10%
 0%
          JAN        FEB     MAR      APR      MAY        JUN          JUL        AUG        SEP      OCT         NOV    DEC

                  Allegiant  American
                                            Avelo                            Frontier        United
   2022         (SNA, AZA, (DFW, PHX,                    Delta (SLC)                                        Denver Air   Charters           Total
                                            (BUR)                            (DEN)           (DEN)
                   LAS)       LAX)
 JAN                     47%        79%             0%           75%                    0%         91%              0%              0%            74%
 FEB
 MAR
 APR
 MAY
 JUN
 JUL
 AUG
 SEP
 OCT
 NOV
 DEC
 TOTAL                47%          79%       #DIV/0!             75%               49%             91%              0%          0%               74%

                  Allegiant  American
                                            Avelo                            Frontier        United
   2021         (SNA, AZA, (DFW, PHX,                    Delta (SLC)                                        Denver Air   Charters           Total
                                            (BUR)                            (DEN)           (DEN)
                   LAS)       LAX)
 JAN                     32%        45%             0%           36%                    0%         43%                                           41%
 FEB                     37%        50%             0%           43%                    0%         56%                          86%              49%
 MAR                     42%        74%             0%           55%                    0%         74%                           0%              65%
 APR                     47%        78%             0%           66%                    0%         93%              0%           0%              75%
 MAY                     54%        90%             0%           90%                    0%         91%              0%           0%              81%
 JUN                     58%        78%             0%           80%                    0%         76%              0%           0%              71%
 JUL                     68%        78%             0%           80%                    0%         88%              0%           0%              77%
 AUG                     55%        91%             0%           72%                    0%         84%              0%           0%              80%
 SEP                     63%        81%             0%           82%                    0%         89%              0%           0%              81%
 OCT                     68%        96%             0%           88%                    0%         96%              0%           0%              90%
 NOV                     62%        91%             0%           86%                    0%         94%              0%                           84%
 DEC                     34%        86%             0%           77%                    0%         95%              0%          0%               75%
 TOTAL                   51%       79%              0%           72%                    0%         82%            100%         42%               74%
2022 Enplaned and Deplaned Airfreight - Lbs

                                                                                                   2022 Market Share
                                                                                                                                FedEx
                                  2022 YTD
               Enplaned Freight                  304,363           14.82%                                                       Key Lime
               Deplaned Freight                  352,484           -19.51%                         14%
                                                                                                                                American
                                                                                                                                Delta
                                  2021 YTD                                                                                      United
               Enplaned Freight                  265,089
               Deplaned Freight                  437,909                                                  86%

Enplaned           FedEx           Key Lime        American         Delta           United          Total           YTD Total      Annual Inc/Dec

      JAN            281,971           21,922               -               466               4          304,363         304,363           14.8%
      FEB                                                                                                    -
     MAR                                                                                                     -
     APR                                                                                                     -
     MAY                                                                                                     -
      JUN                                                                                                    -
      JUL                                                                                                    -
     AUG                                                                                                     -
      SEP                                                                                                    -
     OCT                                                                                                     -
     NOV                                                                                                     -
     DEC                                                                                                     -
   TOTAL             281,971           21,922               -               466                4         304,363        304,363
Market Share           92.64%            7.20%             0.00%            0.15%        0.00%            100.00%

                                                                                                                                    Month over
Deplaned           FedEx           Key Lime         American        Delta           United          Total           YTD Total
                                                                                                                                   Month Inc/Dec
      JAN            281,971           69,941               219               47             306         352,484         352,484           -19.5%
      FEB                                                                                                    -
     MAR                                                                                                     -
     APR                                                                                                     -
     MAY                                                                                                     -
      JUN                                                                                                    -
      JUL                                                                                                    -
     AUG                                                                                                     -
      SEP                                                                                                    -
     OCT                                                                                                     -
     NOV                                                                                                     -
     DEC                                                                                                     -
   TOTAL             281,971           69,941              219                47             306         352,484        352,484
Market Share           80.00%           19.84%             0.06%            0.01%        0.09%           100.00%
2022 Aircraft Operations
                                      Itinerant                                             LOCAL
                                      General                  TOTAL   C                     Local
  2022       Air Carrier   Air Taxi               Military               Local Civilian                  TOTAL LOCAL    TOTAL
                                      Aviation               ITINERANT o                    Military
    JAN             395         615      1,855         138        3,003           1,388            86           1,474     4,477
    FEB                                                               0                                             0         0
   MAR                                                                0                                             0         0
   APR                                                                0                                             0         0
   MAY                                                                0                                             0         0
    JUN                                                               0                                             0         0
    JUL                                                               0                                             0         0
   AUG                                                                0                                             0         0
    SEP                                                               0                                             0         0
   OCT                                                                0                                             0         0
   NOV                                                                0                                             0         0
   DEC                                                                0                                             0         0
 TOTAL              395         615      1,855         138        3,003           1,388            86           1,474     4,477
                                                                          C
Historical                                                                                 2021-2022
                2017        2018       2019        2020         2021      o    2022
  Data                                                                                      Inc/Dec
                                                                          l
    JAN          3,325        3,320      3,425       3,713        4,904           4,477         -8.71%
    FEB          2,888        2,945      3,473       4,378        4,195             -
   MAR           4,356        3,931      4,119       3,241        4,710             -
   APR           3,717        3,670      3,378       2,436        4,238             -
   MAY           3,821        3,908      4,075       3,826        4,514             -
    JUN          4,839        4,287      4,293       4,588        5,000             -
    JUL          3,997        5,195      4,348       4,784        5,014             -
   AUG           4,084        5,139      4,256       5,436        4,858             -
    SEP          3,496        4,161      3,941       4,777        5,355             -
   OCT           3,752        4,600      4,004       5,216        5,095             -
   NOV           3,074        4,092      3,811       4,612        4,841             -
   DEC           2,957        3,612      4,216       4,532        4,269             -
 TOTAL          44,306       48,860     47,339      51,539       56,993            4,477
2022 Rental Car Revenues
250,000                                                                                                                                             2022 Market Share

200,000
                                                                                                                                                                              Avis

                                                                                                                       Avis
150,000                                                                                                                                                                       Budget
                                                                                                                       Budget                       15%
                                                                                                                                                             26%
                                                                                                                       Enterprise
100,000                                                                                                                                                                       Enterprise
                                                                                                                       Hertz
                                                                                                                                                  32%           13%
                                                                                                                       National/ Alamo
 50,000                                                                                                                                                   14%                 Hertz

     0                                                                                                                                                                        National/
            JAN   FEB      MAR      APR     MAY     JUN     JUL       AUG     SEP      OCT    NOV      DEC                                                                    Alamo
                                                                                                                                                                   Annual YTD
     2022          Avis                   Budget          Enterprise                Hertz         National/ Alamo               Total            YTD Total
                                                                                                                                                                     Inc/Dec
        JAN              176,166               89,345               95,880             224,219               103,471                   689,081          689,081           83.6%
        FEB                                                                                                                                  0
       MAR                                                                                                                                   0
        APR                                                                                                                                  0
       MAY                                                                                                                                   0
        JUN                                                                                                                                  0
        JUL                                                                                                                                  0
       AUG                                                                                                                                   0
        SEP                                                                                                                                  0
       OCT                                                                                                                                   0
       NOV                                                                                                                                   0
       DEC                                                                                                                                   0
   TOTAL                 176,166               89,345                95,880            224,219               103,471                   689,081          689,081
Market Share             25.57%               12.97%                13.91%             32.54%                15.02%                   100.00%

     2021          Avis                   Budget          Enterprise                Hertz         National/ Alamo               Total            YTD Total
        JAN                63,490              37,121                68,456             115,341             90,873                     375,281         375,281
        FEB                88,747              47,482                85,630             138,855             96,619                     457,332         832,613
       MAR                137,342              97,006               114,654             208,673            148,899                     706,573       1,539,186
        APR               171,522              88,618               143,501             235,388            189,830                     828,859       2,368,045
       MAY                242,237             140,693               182,533             295,030            203,100                   1,063,592       3,431,637
        JUN               307,265             192,646               257,472             409,070            224,989                   1,391,441       4,823,079
        JUL               227,496             158,122               261,933             518,255            246,824                   1,412,630       6,235,709
       AUG                256,062             172,401               277,202             486,233            211,488                   1,403,386       7,639,095
        SEP               296,712             196,735               246,145             413,975            211,120                   1,364,687       9,003,782
       OCT                345,523             201,302               222,811             369,014            233,440                   1,372,091      10,375,873
       NOV                163,909             111,083               133,277             263,968            132,329                     804,566      11,180,439
       DEC                150,935              78,621               103,418             234,091            121,686                     688,750      11,869,189
   TOTAL                2,451,240           1,521,829             2,097,032           3,687,891          2,111,197                  11,869,189
Market Share              20.65%              12.82%                17.67%              31.07%             17.79%                     100.00%
2022 Parking Revenues
140,000                                                                                   7,000

120,000                                                                                   6,000

100,000                                                                                   5,000

 80,000                                                                                   4,000
                                                                                                    Gross Revenue
 60,000                                                                                   3,000      Transactions
 40,000                                                                                   2,000

 20,000                                                                                   1,000

     0                                                                                    0
          JAN    FEB   MAR   APR   MAY   JUN      JUL   AUG   SEP   OCT     NOV   DEC

                                                        YTD Gross                               Revenue per
     2022       Gross Revenue      Transactions                           YTD Transactions
                                                         Revenue                                Transaction
        JAN             121,929                6,017           121,929                  6,017 $         20.26
        FEB
       MAR
       APR
       MAY
        JUN
        JUL
       AUG
        SEP
       OCT
       NOV
       DEC
     TOTAL              121,929                6,017           121,929                  6,017 $              20.26

                                                        YTD Gross                                 Revenue per
     2021       Gross Revenue      Transactions                           YTD Transactions
                                                         Revenue                                  Transaction
        JAN               66,348             3,974               66,348               3,974   $           16.70
        FEB               68,043             4,007              134,391               7,981   $           16.98
       MAR                98,838             5,620              233,229              13,601   $           17.59
       APR               125,854             6,731              359,083              20,332   $           18.70
       MAY               142,565             8,135              501,648              28,467   $           17.52
        JUN              146,746             9,501              648,394              37,968   $           15.45
        JUL              162,832            10,415              811,226              48,383   $           15.63
       AUG               181,250            10,348              992,476              58,731   $           17.52
        SEP              168,273             9,383            1,160,749              68,114   $           17.93
       OCT               195,724             9,990            1,356,473              78,104   $           19.59
       NOV               185,972             8,777            1,542,445              86,881   $           21.19
       DEC               158,749             8,846            1,701,194              95,727   $           17.95
     TOTAL             1,701,194            95,727            1,701,194              95,727   $              17.77
2022 Terminal Concessions Revenues
60,000
                                                                                                                       2022 Market Share
50,000                                                                                                                                           Food &
                                                                                                                           3%                    Beverage
40,000
                                                                                             Food & Bev
                                                                                                                      15%                        Alcohol
30,000                                                                                       Alcohol
                                                                                             Gift Shop
20,000                                                                                                              24%         58%              Gift Shop
                                                                                             Vending

10,000
                                                                                                                                                 Vending
    0
         JAN   FEB   MAR   APR    MAY     JUN   JUL   AUG    SEP     OCT   NOV   DEC

                                                                                                                                                 Annual
     2022       Food & Beverage                  Alcohol                    Gift Shop                    Vending                Total
                                                                                                                                                 Inc/Dec
        JAN                      51,472                     20,758                      12,776                     3,070 $              88,076        58.0%
        FEB
       MAR
       APR
       MAY
        JUN
        JUL
       AUG
        SEP
       OCT
       NOV
       DEC
     TOTAL                       51,472                     20,758                      12,776                     3,070                88,076

     2021       Food & Beverage                  Alcohol                    Gift Shop                    Vending                Total
        JAN                   33,403                      11,949                          9,255                  1,131     $          55,738
        FEB                   50,088                      19,620                         12,802                  1,135     $          83,645
       MAR                    58,629                      19,854                         17,992                  1,200     $          97,674
        APR                   69,494                      25,759                         21,809                  1,268     $         118,330
       MAY                    77,826                      30,877                         26,036                  1,313     $         136,052
        JUN                   94,602                      35,625                         30,789                  1,871     $         162,887
        JUL                  105,793                      37,529                         35,716                  1,973     $         181,010
       AUG                   102,135                      42,046                         35,720                  2,136     $         182,036
        SEP                   91,416                      37,247                         35,920                  2,474     $         167,057
        OCT                   95,224                      41,686                         32,860                  2,580     $         172,350
       NOV                    71,570                      32,007                         29,316                  2,692     $         135,585
        DEC                   74,633                      32,530                         24,264                  2,929     $         134,356
    TOTAL                   924,812                     366,728                        312,477                 22,700              1,626,717
Market Share                    57%                         23%                            19%                     1%                   100%
Grand Junction Regional Airport Authority
     Statements of Changes in Net Position
     Unaudited - subject to change
                                                                      Year to Date
                                                   01/31/2022         01/31/2022        01/31/2021                Budget Variance                 Prior Year Variance
                                                                                                                               Budget %
                                                       Budget            Actual             PY Actual     Budget $ Remaining   Remaining         PY $ Var         PY % Var

     Operating revenue
      Aeronautical revenue
       Passenger airline revenue
1       Passenger airline landing fees             $     44,000   $          36,916     $       48,890     $       (7,084)       (16.10) %   $      (11,974)      (24.49) %
2       Terminal rent                                   101,250              93,717            102,957             (7,533)        (7.44) %           (9,240)        (8.97) %
3       Other (boarding bridge)                           2,031               2,550               2,300               519         25.55 %                   250     10.87 %
                 Total Passenger airline revenue        147,281            133,183             154,147            (14,098)        (9.57) %          (20,964)      (13.60) %
       Non-passenger airline revenue
4       Non-passenger landing fees                        8,400               8,939               8,108               539           6.42 %                  831     10.25 %
5       Cargo and hangar rentals                          4,608               4,616               4,561                  8          0.17 %                  55       1.21 %
6       Fuel tax                                         16,917              28,047               8,773           11,130          65.79 %            19,274       219.70 %
7       Fuel Flowage Fees and Sales                      34,300              37,713             30,804              3,413           9.95 %            6,909         22.43 %
8       Other (ramp parking, rapid refuel)                  583                   840               780               257         44.08 %                   60       7.69 %
           Total Non-passenger airline revenue           64,808              80,155             53,026            15,347          23.68 %            27,129         51.16 %
                     Total Aeronautical revenue         212,089            213,338             207,173              1,249           0.59 %            6,165          2.98 %
      Non-aeronautical revenue
9      Land and building leases                          49,300              48,827             49,097               (473)        (0.96) %              (270)       (0.55) %
10     Terminal - restaurant & retail                    10,000              12,316               5,461             2,316         23.16 %             6,855       125.53 %
11     Terminal - other                                  13,526              15,369             15,294              1,843         13.63 %                    75      0.49 %
12     Rental cars                                       86,195              93,870             57,179              7,675           8.90 %           36,691         64.17 %
13     Parking                                           75,530            106,241              57,196            30,711          40.66 %            49,045         85.75 %
14     Ground Transportation                              3,141               3,204               1,971                 63          2.01 %            1,233         62.56 %
15     Other (advertising, security fee, etc.)            2,556               2,367               2,277              (189)        (7.39) %                   90      3.95 %
                 Total Non-aeronautical revenue         240,248            282,194             188,475            41,946          17.46 %            93,719         49.72 %
                     Total Operating Revenues      $    452,337   $        495,532      $      395,648     $      43,195            9.55 %   $       99,884         25.25 %
Grand Junction Regional Airport Authority
     Statements of Changes in Net Position
     Unaudited - subject to change
                                                                              Year to Date
                                                           01/31/2022             01/31/2022             01/31/2021                   Budget Variance                   Prior Year Variance

                                                             Budget                 Actual                PY Actual           Budget $ Variance   Budget % Variance   PY $ Var       PY % Var

     Operating expenses
16    Personnel compensation and benefits              $       224,606        $      229,924         $       214,613                   5,318               2.37 %        15,311          7.13 %
17    Communications and utilities                              28,573                33,873                   29,361                  5,300             18.55 %           4,512        15.37 %
18    Supplies and materials                                    49,233                56,582                   16,156                  7,349             14.93 %         40,426        250.22 %
19    Contract services                                         47,953                42,297                   67,367                  (5,656)         (11.79) %        (25,070)       (37.21) %
20    Repairs & maintenance                                     28,709                28,905                   13,376                     196             0.68 %         15,529        116.10 %
21    Insurance                                                 11,333                10,109                   10,705                  (1,224)         (10.80) %            (596)       (5.57) %
22    Training, Travel, & Air Service Development               47,233                11,865                    6,767                (35,368)          (74.88) %           5,098        75.34 %
23    Other Expense (marketing, professional dues, e            22,299                  8,105                   7,686                (14,194)          (63.65) %             419         5.45 %
24    Contingency Expense                                             -                      -                        -                      -             0.00 %                -       0.00 %
                           Total Operating expenses            459,939               421,660                 366,031                 (38,279)            (8.32) %        55,629         15.20 %
     Non-operating revenue (expenses)
25    Passenger facility charges                                60,700                76,226                   54,956                 15,526             25.58 %         21,270         38.70 %
26    Interest income                                            3,167                  2,751                   2,985                    (416)         (13.14) %            (234)       (7.84) %
27    Interest expense                                          (61,666)              (61,537)                (63,988)                    129              0.21 %          2,451         3.83 %
28    Customer facility charges                                 35,665                36,184                   29,824                     519              1.46 %          6,360        21.33 %
29    Capital contributions                                 27,157,000               115,004                   29,069           (27,041,996)           (99.58) %         85,935        295.62 %
29    Capital expenditures                                 (30,286,000)              (120,670)              (186,861)            30,165,330              99.60 %         66,191          35.42%
30    Debt principal payments                                             -                      -                        -                  -             0.00 %                -       0.00 %
31    Other                                                               -                      -                        -                  -             0.00 %                -       0.00 %
              Total Non-operating revenue (expenses)         (3,091,134)              47,958                (134,015)             3,139,092             101.55 %        181,973        135.79 %
         Excess of revenue over (under) expense        $     (3,098,736) $           121,830         $      (104,398)             3,220,566             103.93 %        226,228        216.70 %
Variance Explanations - January 31, 2022 Preliminary Financial Statements
   Variance explanations have been provided below for revenue and expense accounts that have a budget variance of more than 5% and where the revenue or expense category makes up at
   least 5% of the YTD operating budget of $22,600 for revenue and $29,700 for all non-capital expenses.
                                                              Jan-22          Jan-22         Jan-21           Budget
                                                              Budget          Actual         Actual          Variance            PY Variance
                                       Seat Capacity             24,508         20,261          24,653      (4,247) -17%           (4,392) -18%
                                       Landed Weight        23,577,010      24,509,427     29,116,034     932,417       4% (4,606,607) -16%
                                       Enplanements              14,957         14,981          10,127          24      0%          4,854    48%
                                       Load Factor                   61%            74%            41%          13%                  33%

   Operating Revenues: Operating revenues were $43K (9.5%) ahead of budget for January 2022. This positive variance was due to the higher than expected
   enplaned passengers which caused non-aeronautical revenues to exceed budget by 18%.
 1 Passenger airline landing fees - January landing fee revenue was down from prior year by about 22% before taking incentives into consideration. This is due to the 5% decrease in rates and
   total passenger landed weight was down about 19.7%.
 2 Terminal Rent – Terminal rent is a fixed charge to the airlines that covers their individual ticket counters and office space, as well as the shared space that includes: ticket queuing area,
   baggage claim, and secure hold room. The decrease from prior year is due to the 5% reduction in rates as well as the new service incentive credits applied to the shared space areas based on
   the number of passengers, in January this incentive credit totaled $7,116. During the budgeting process, the incentives were spread evenly throughout the year, but the current incentive
   contracts will all be realized in the first and second quarter creating a larger variance.
 6 Fuel Tax - Fuel tax revenues are collected by the state and remitted to the Airport based on all fuel sales, but these revenues tend to correlate most closely with commercial landing activity
   two months previous due to the lag in processing. November 2021 saw an 17% increase in gallons sold over that of November 2019.
 7 Fuel flowage fees and fuel sales – Fuel flowage fees are collected from non-commercial fueling at the airport and therefore are influenced by GA operations, primarily military and fire fighting
   operations. There were more GA operations from weather diversions at the mountain areas in January 2022 than 2021, driving the positive variance.
12 Rental Cars - Rental car revenue exceeded budget by more than 8% because January 2022 saw 1,000 more rental days than January 2021 driven by the 48% increase in passengers over prior
   year.
13 Parking - Parking revenue exceeded budget by 40% for January 2022 due to per passenger spending of $7.04, which is 19% higher than the pre-pandemic average of $5.93 per passenger and
   a positive trend for parking revenue.

   Operating Expenses: Total Operating Expenses through January 2022 were $38K below budget primarily due to a front loaded training budget.
17 Communications and Utilities – Communications and Utilities were $5,300 above budget due to increased natural gas cost, while this increase was accounted for during budgeted the
   increase appears to be higher than expected in January. We will continue to monitor this expense.
18 Supplies & Materials – Supplies & Materials costs were $7,300 above budget. This is due primarily to the timing of glycol disposal which was not budgeted for in January and higher than
   expected fuel purchases in both gallons and price per gallon. We expect this variance to continue and increase given the current oil market.
19 Contract Services – Contract services are $5,600 below the budget for January as this expense will fluctuate throughout the year so it was budgeted evenly throughout the year.

22 Training, Travel, & Air Service Development – Costs for training, travel and air service development are $35k below the budget through January 2021. Nearly all of the 2022 training budget is
   reported in January because the timing of trainings and travel is so unpredictable. This variance is expected to decrease throughout the year and be closer to budget.

   Non-Operating Revenues and Expenses:
25 PFC Revenue – PFC revenue was above budget because of the increase in the number of passengers and the load factor, not the number of flights.
29 Capital Contributions & Expenditures – The timing of capital contributions (grant revenue) and capital expenditures is somewhat unpredictable therefore the budget represents the full annual
   budget and the variance represents the estimated amount remaining to be spent. See the attached detail of costs incurred by project.
GJRAA - Breakdown of Capital Expenditure Costs Year-to-Date through January 31, 2022
2022 AIP CAPITAL EXPENDITURES INCURRED AND GRANT REVENUE RECOGNIZED

                                                                                               FAA Grant
                                                                                                Revenue      CDOT Grant
 Grand                                                                      2022 Project     Recognized in    Revenue          2022 GJRAA
Number                     Project/Grant Description                       Costs Incurred        2022        Recognized        Local Share
 AIP 66   Construct Run-up Pad & Rehab Apron                                         2,168           2,168                -                -
 AIP 68   Runway Design - Earthwork, Prism, and Drainage                             6,958           6,958                -                -
 AIP 69   Airport Development Plan                                                  98,851          98,851                -                -
 AIP 72   Taxiway A and RWY 11-29 Construction                                       2,880           2,880                -                -
  TBD     Runway Design - Grading & Drainage                                         4,300                -               -           4,300
  TBD     Runway Design -Schedule 4-7 Utility Infrastructure                         5,000                -               -           5,000
                                                       Total AIP Projects $       120,157    $     110,857 $              -   $       9,300

2022 NON-AIP CAPITAL EXPENDITURES INCURRED
                                                                            2022 Costs
                               Project Description                           Incurred
          Admin Building Landscaping                                                  -
          Terminal Improvements - Non-Rental Car                                     514
          Rental Car Area Improvements                                                -
          Security System Updates                                                     -
          ATCT A/C Compressor                                                         -
          Gravity Roller Outbound Baggage Improvements                                -
          RWY 4-22 Rehab Design                                                       -
          GA Drainage Repairs                                                         -
                                                 Total Non-AIP Projects $            514

                                      Total Capital Expenditures YTD $           120,671
You can also read