Blind Correction of Lateral Chromatic Aberration in Raw Bayer Data
←
→
Page content transcription
If your browser does not render page correctly, please read the page content below

Received June 10, 2021, accepted July 4, 2021, date of publication July 12, 2021, date of current version July 20, 2021.
Digital Object Identifier 10.1109/ACCESS.2021.3096201
Blind Correction of Lateral Chromatic
Aberration in Raw Bayer Data
STEFAN PETERSSON 1, HÅKAN GRAHN 1, AND JIM RASMUSSON2
1 Department of Computer Science, Blekinge Institute of Technology, 371 79 Karlskrona, Sweden
2 Sony Mobile Communications AB, 221 88 Lund, Sweden
Corresponding author: Stefan Petersson (stefan.petersson@bth.se)
This work was supported in part by the Knowledge Foundation in Sweden through the Scalable Resource-Efficient Systems for Big Data
Analytics under Grant 20140032.
ABSTRACT Chromatic aberration is an error that occurs in color images due to the fact that camera lenses
refract the light of different wavelengths in different angles. The common approach today to correct the
error is to use a lookup table for each camera-lens combination, e.g., as in Adobe PhotoShop Lightroom or
DxO Optics Pro. In this paper, we propose a method that corrects the chromatic aberration error without
any priot knowledge of the camera-lens combination, and does the correction already on the bayer data,
i.e., before the Raw image data is interpolated to an RGB image. We evaluate our method in comparison
to DxO Optics Pro, a state-of-the-art tool based on lookup tables, using 25 test images and the variance of
the color differences (VCD) metric. The results show that our blind method has a similar error correction
performance as DxO Optics Pro, but without prior knowledge of the camera-lens setup.
INDEX TERMS Chromatic aberration, structural instability, image enhancement, blind correction, GPGPU.
I. INTRODUCTION
Color images acquired through different types of imaging
optics are commonly distorted by various types of optical
aberrations. One of the resulting errors is denoted as chro-
matic aberration (CA). Chromatic aberration occurs because
lenses, typically made of glass or plastic, have different mate-
rial dispersions and light of different wavelengths therefore
refract at different angles. The main consequence in imaging
FIGURE 1. Illustration of axial (or longitudinal) chromatic aberration
is that light rays of different wavelengths are focused at dif- (ACA), to the left, and lateral (or transverse) chromatic aberration (LCA),
ferent image distances (axial/longitudinal CA) and at differ- to the right.
ent locations in the image (transverse/lateral CA), as shown
in Figure 1.
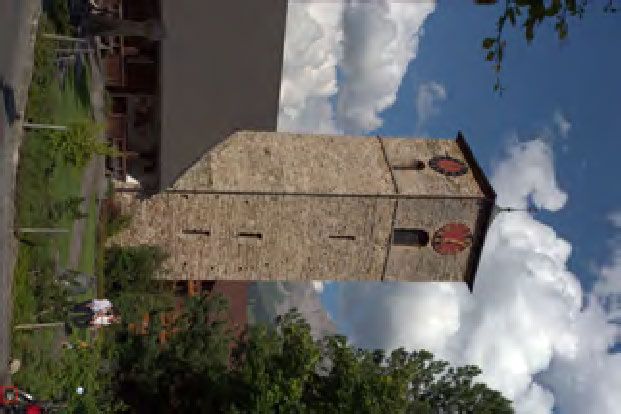
A digital color image is normally made up of three color chromatic aberration. However, even if several lenses are
channels. Lateral CA causes the color channels to be mis- combined, it is non-trivial to completely align the three color
aligned with respect to each other, which shows up as color channels to avoid chromatic aberration. Also, cameras in
fringes around edges and high contrast areas in the color mobile phones or tablets are typically equipped with very
image, as shown in Figure 2(b). The red and blue colors compact and small lenses, which are prone to result in more
of different wavelengths are not focused at the same point CA. Image pixel resolution increases in a rapid pace, which is
as the green color. For example, this is clearly observed another high-impact factor since the CA pixel area will cover
in Figure 2(b) as a red fringe along the edge of the light object. a larger number of pixels.
In the manufacturing process of camera lenses, various These types of imaging artifacts are unacceptable in profes-
lenses are combined to correct, or at least reduce, the sional photography. Software programs that correct imaging
artifacts by post-processing of digital color images are read-
The associate editor coordinating the review of this manuscript and ily available, including Adobe PhotoShop Lightroom CC R ,
approving it for publication was Gulistan Raja . Adobe Camera Raw R , DxO Optics Pro R , and PTLens R .
This work is licensed under a Creative Commons Attribution-NonCommercial-NoDerivatives 4.0 License.
VOLUME 9, 2021 For more information, see https://creativecommons.org/licenses/by-nc-nd/4.0/ 99455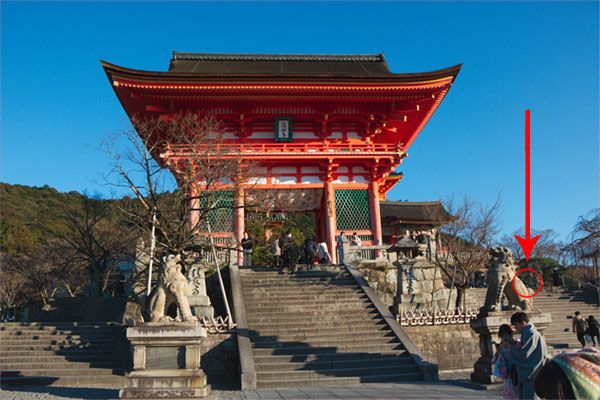
S. Petersson et al.: Blind Correction of Lateral CA in Raw Bayer Data

FIGURE 2. Visual comparison where lateral chromatic aberration is uncorrected (b), and corrected using our proposed method (c).

These software programs apply so-called non-blind correc-                       The proposed method is evaluated using 25 images in
tions, i.e., they use pre-calibrated correction parameters for               RAW format and of different sizes. Each image is CA cor-
the specific combination of camera and lens that was used                    rected using our proposed method and compared to an image
to capture the image to be corrected. Non-blind correction                   corrected with the DxO Optics Pro software. As evaluation
techniques must have access to a huge database of correction                 metric, we use variance of color differences (VCD), which is
parameters for all possible combinations of cameras and                      used to evaluate CA artefacts [5], [6]. Our results show that,
lenses. Such a database takes a lot of effort to generate and                on average, the proposed method results in fewer CA artifacts
must be constantly updated to account for new models of                      as compared to the images corrected with DxO Optics Pro.
cameras and lenses, and combinations thereof.                                   Our main contributions are:
   As a result of the above, there is a strong need for blind                   • A novel method for blind correction of lateral chro-
correction techniques that are capable of correcting chro-                        matic aberration, i.e., without any lookup tables or prior
matic aberration in color images, including lateral CA, with-                     knowledge of the camera / lens combination.
out prior knowledge about the color image and how it was                        • Our proposed method uses raw camera image data as
generated (e.g., specific camera/lens combinations). Software                     input, in order to have as good and undistorted data as
programs for blind correction of lateral CA are known in                          possible.
previous work, e.g. RawTherapee. There is a general desire to                   • A highly efficient parallel GPU implementation of the
provide alternative techniques for blind correction of lateral                    method.
CA, especially a technique that is computationally efficient                    • An experimental evaluation showing results on par
and capable of providing a significant reduction of lateral CA                    with state-of-the-art non-blind techniques, such as DxO
in a digital color image.                                                         Optics Pro.
   Previous work, e.g., by Wang et al. [1], have shown that                     The rest of the paper is organized as follows. In Section II,
it is important to correct CA before any demosaicing takes                   we present some background information and high-light
place, i.e., the processing step where the Bayer CFA (color                  related work. Then, we present our proposed method in
filter array) information is interpolated to an RGB image.                   Section III. In Section IV we present our evaluation method-
They have shown that CA correction has a positive effect on                  ology, while our experimental results and analysis are pre-
the demosaicing quality if it is done before the demosaicing                 sented in Section V. Finally, we conclude our study in
step. Imatest goes one step further and claims that ‘‘lateral                Section VI.
CA cannot be reliably corrected after demosaicing, but it can
be corrected to near-perfection prior to demosaicing’’ [2].                  II. BACKGROUND AND RELATED WORK
   In this paper, we propose a novel blind method to correct                 A. DEMOSAICING
lateral chromatic aberration before any Bayer CFA to RGB                     Most digital cameras acquire color data using a single
interpolation (demosaicing) takes place. Most auto-focus                     charge-coupled device (CCD) sensor. This solution is very
cameras focus on the green channel when images are captured                  limiting, since only one third of the scene color information
and our method assumes that the processed image data was                     is stored for later interpretation. A color filter array (CFA)
taken using a camera with such logic. The main reason for                    is placed in front of the sensor to capture one color compo-
this is that the Bayer color filter array contains twice as many             nent per pixel. The missing two color components are later
green pixels as red and blue pixels, and therefore we assume                 interpolated for each pixel in the demosaicing process. The
that the green color channel is most correct one. The proposed               most common CFA pattern is the Bayer pattern [7], as shown
method aligns and re-samples the red and blue channels                       in Figure 3.
so they match the green channel, similarly to for example                       The demosaicing process is central in the camera pipeline
[3]–[5]. The green channel is assumed to be correct already,                 and has a major impact on the final image quality. Demo-
and is therefore not modified in any way.                                    saicing techniques have different qualities, e.g., in terms of

99456                                                                                                                                       VOLUME 9, 2021
S. Petersson et al.: Blind Correction of Lateral CA in Raw Bayer Data

                                                                        Fourier plane, and then are transferred back using an inverse
                                                                        Fourier transform.
                                                                           Kang [15] presents a technique to reduce the effect of
                                                                        chromatic aberration, based on only a single image as input.
                                                                        The technique calculates the defocus effect caused by CA
                                                                        using a sharpening filter, and identifies strong edges (using
                                                                        a difference-of-Gaussian filter) to use for color plane realign-
                                                                        ment. The technique is evaluated using five 6M pixel images
                                                                        and one 16M pixel image. The execution time (on a 3.2 GHz
                                                                        Pentium 4) for the 6M pixel images was approximately
                                                                        30 seconds, and for the 16M pixel image 2.5 minutes.
                                                                        In contrast, our technique runs in less than a second for
                                                                        high-resolution images (15M-30M pixels).
FIGURE 3. Separation of RGB planes from a Bayer plane.                     Mallon and Whelan [3] present an approach to compensate
                                                                        for chromatic aberration using color plane realignment, sim-
                                                                        ilarly to what we do. Their realignment approach is based on
interpolation quality and computational complexity. High                image warping. A model of the lateral chromatic aberration
interpolation quality often requires a high complexity tech-            over the whole image surface is derived, based on errors from
nique. It is common to demosaic in either the spatial                   the color filter array. Using partial derivatives of quadratic
domain [8]–[11] or the frequency domain [12], [13] using                cost functions, gradients and Hessian matrices are calculated
single or multi-pass interpolation strategies.                          that then are input to the optimization algorithm. They eval-
   Modern demosaicing methods take advantage of the cor-                uate their approach using three camera models, and only two
relation between color channels. The interpolation process              test images (one chessboard pattern and one outdoor image).
may break down, introducing, e.g., false colors, more zip-              A distintive difference in our approach is that it is simpler
pering artifacts, etc., in areas where the chromatic aberration         to calculate using structural instability [16] instead of using
is severe. The CA correction analysis relies on true edge               derivatives, Hessian matrices, etc.
information, i.e, lines where some of the color planes change              Zhang et al. [17] propose a technique to compensate for
intensity drastically. Since the resulting RGB data may con-            lateral CA in a color fringe projection system. A linear com-
tain multiple interpolation errors, it is non-trivial to determine      pensation model is proposed using phase maps from different
what image regions to analyze further.                                  color channels to calibrate the magnitude of the lateral CA.
                                                                        The evaluation is done using simulations and three reference
B. CHROMATIC ABERRATION                                                 images. In contrast, our technique uses a polynomial correc-
Chromatic aberration (CA) is a problem that is present in               tion factor.
all images, and arises when light passes through a lens.                   Chung et al. [4] propose a method to detect and eliminate
Since the light consists of colors of different wavelengths,            chromatic aberration. They first analyze the color behavior
different colors will then be refracted at different angels             near edges without chromatic aberration and propose a range
when passing through a lens. As a result, color fringes may             of limitations for color differences. Pixels violating the color
show up at object edges and in high-contrast areas, as shown            difference range are considered as color fringes. The color
in Figure 2(b).                                                         channels are then translated separately in horizontal and
   Chromatic aberration can be divided into two different               vertical directions, respectively, using a gradient calculated
types: axial (or longitudinal) chromatic aberration (ACA),              by horizontal and vertical Sobel gradient. The method is
and lateral (or transverse) chromatic aberration (LCA),                 evaluated using 5 images of size 1536 × 2048, i.e., few and
as shown in Figure 1. Axial CA are shifts along the optical             low-resolution images.
axis while lateral CA are shifts perpendicular to the optical              Chang et al. [6] address the chromatic aberration prob-
axis. Our proposed approach corrects lateral CA by realign-             lem by filtering out false color components from an image,
ing color planes from the color filter array. Our proposed              i.e., those components that cause color fringes at edges as
approach realign the red and blue color planes before demo-             a result of chromatic aberration. Their approach relies on
saicing takes place, as motivated in [1], since after demosaic-         adjusting adaptive weights based on color gradients and
ing the color channels are interpolated and possibly disturbed.         differences.
                                                                           Wang et al. [1] study the influence of chromatic aberra-
C. RELATED WORK                                                         tion on demosaicing. They propose a simulation framework
Kühn et al. [14] presented some early work on how to spa-               for evaluating the influence of CA on demosaicing (one
tially align two colors with different wavelengths in real-time.        linear interpolation algorithm and one gradient-corrected
Their context was digital holographic microscopy, where a               linear interpolation algorithm). Five images from the Fos-
single holographic image is acquired. The idea is based on              ter set [18] and six images from the CAVE set [19] were
two reference waves that are aligned and centered in the                used for evaluation. Their most important result is that

VOLUME 9, 2021                                                                                                                    99457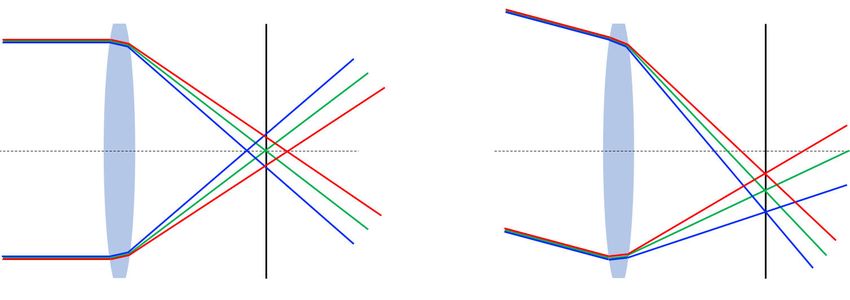
S. Petersson et al.: Blind Correction of Lateral CA in Raw Bayer Data

correction of chromatic aberration should be done before the         Correction of chromatic aberration is necessary also in
demosaicing step.                                                 other domains and wavelength spectrum, e.g., in electron
   The approached proposed by Rudakova and Monasse [20]           microscopy [26]–[29]. In this context, chromatic aberration
is similar to ours at a high level. They also do sub-pixel        occurs as electrons that have lost different amounts of energy
alignment of the color planes using high-precision keypoint       within an energy window will be focused in different planes
detection and a radial correction polynomial. However, there      by the imaging lens. MacLaren and Ramasse [26] outline
are important differences. For example, they identify key-        how technical advances in the correction of the lens aber-
points based on patterns of black disks on a white background     rations in the probe-forming lenses have pushed forward
while our approach takes any photo as input and adjusts           atomic-scale structural and chemical characterisation as a
the correction polynomial based on that particular image.         result of advances in scanning transmission microscopy. The
The main disadvantage with their approach is that they only       approach taken in [27] is to do energy-filtered imaging to
can correct CA in images taken by the same camera-lens            compensate for the aberration. In [28], [29], the focus is on
combination as the reference image was taken with, while          transmission electron microscopy of liquids and the effects
our approach does not require any prior knowledge of the          thereof. They show that spatial resolution can be improved
camera-lens combination.                                          by spherical and chromatic aberration correction for liquid
   Pi et al. [5] present an approach to correct chromatic         samples.
aberration using a spatially variant total variational model.        Wang et al. [30] propose a chromatic aberration correction
They employ a spatially variant model to control the gra-         approach based on a saturation-value total variation (SVTV)
dient matching of the red/blue color channels to the green        model. The correction is done in the HSV (hue, saturation,
color channel. They formulate the problem as an optimization      value) color space instead of the RGB color space. Gradient
problem in order to find the best gradient matching. Their        matching is done by adjusting the red and blue components
method is very slow, taking approximately 15 seconds on a         to the green components, and intensity is matched between
very low-resolution image of size 310 × 463 pixels.               the red, green, and blue components. The solution in their
   An optical approach to correct chromatic aberration is         work is set up as an optimization problem that is solved. The
proposed by Wang et al. [21]. They designed and fabricated        approach shows good results in terms of PSNR, SSIM, and
diffractive lenses that could focus the all wavelengths in        SCIELAB error, but is computationally demanding since an
the visible spectrum onto a single line. However, dispite         optimization problem has to be solved.
better lenses, the chromatic aberration problem may exist in         Some recent works propose to design lenses that
images due to, e.g., fabrication errors. Therefore, we strongly   adjust for the different wavelength diffractions [31], [32].
believe that blind approaches are necessary as complement to      Kim et al. [31] use a stack of so called geometric-phase lenses
lens-based approaches.                                            to make sure that the red, green, and blue wavelengths have
   The work by Sun et al. [22] is a blind method (just            precisely the same focal length. Zhan et al. [32] address the
as ours) to correct chromatic aberration. Their approach          problem of chromatic aberration in immersive virtual reality
relies on cross-channel correlation based on pixel-wise sim-      displays. In their work, they reject digital compensation
ilarity. They exploit what they call essential similarity,        due to high computation and memory cost. Instead, they
which is based on the observation that the high-level struc-      propose an optical solution using a hybrid lenses consiting
tures between the color channels are mostly identical. The        of a combination of Fresnel lenses and Pancharatnam-Berry
approach shows good results on both synthetic and real world      lenses. Our work shows that the computaional cost can be low
images. However, the approach is very computational dem-          when correcting chromatic aberration.
ing, taking 7 seconds to correct a low-resolution 1400 × 1000        Speed is important in real-time multi-camera stitching.
pixels image.                                                     Therefore, Shen et al. [33] have proposed a fast chromatic
   Malleson and Hilton [23] proposes to use a neural network      aberration correction technique as part of their stitching solu-
to combine CA correction and demosaicing at the same time.        tion. Their correction approach is based on averaging the
They divide the image into 33 patches and train six convo-        three RGB channels and thus get a mean gray value over
lutional neural networks to account for six ’effective CFA’       an area. Then, each color channel is linearly transformed
(color filter array) patterns. Their results show significant     in relation to the difference to the mean gray value. Their
improvements in terms of PSNR and SSIM as compared to             paper does not evaluate the performance of their chromatic
their baseline approach, which is Matlab’s demosaic function.     aberration correction specifically.
However, they do not distinguish between the improvements            The main properties of our approach that distinguishes it
caused by an improved demosaicing and the improvements            from previous methods are:
caused by the CA correction.                                         • a blind method that only needs one input image, i.e., no
   Another approach to simultaneously correct chromatic                lookup tables or prior knowledge of the camera-lens
aberration and do demosaicing is proposed by Llanos [24],              combination,
[25]. The approach is based on spectral analysis and RGB-            • the chromatic aberration correction is done on raw bayer
to-spectral reconstruction of images. The images are then              data,
corrected by estimating aberration-free spectral images.             • no fixed parameters,

99458                                                                                                                           VOLUME 9, 2021
S. Petersson et al.: Blind Correction of Lateral CA in Raw Bayer Data

 FIGURE 4. Overview of the proposed CA correction method.

   •   a non-linear re-alignment polynomial, and
   •   a highly efficient GPU implementation.

III. PROPOSED CORRECTION METHOD
The structural instability (SI) is a simple and efficient metric
to identify and assess unstable regions within local Bayer data
regions, i.e., regions where the gradient of a color plane is
steep. The metric has previously been used to improve inter-
polation performance of a well known, single computation
pass, demosaicing algorithm [16].
    Chromatic aberration is a spatial artifact and is therefore
easier to analyze and correct in the spatial domain [15].
Previous CA correction methods have been identifying cor-
rection parameters by realigning areas where high-contrast
edges are present. The problem with most of these methods
is that the edges are estimated from RGB color data calculated
using linearized, white balanced, demosaiced and color space
converted Bayer data. The intense transformation process
may have introduced incorrect artifacts that affect the CA
correction step.
    The SI metric values represent per-pixel instability in the
spatial domain and can be seen as a true-edge-map repre-
sentation of unmodified camera raw Bayer data. Therefore,
the per-pixle SI values can be used to realign the color planes
of the source Bayer data. In this paper we present a novel              FIGURE 5. Predefined pattern sets of local color values used to
SI-based CA-correction method along with a highly efficient             approximate local structural instability within a color channel [16].
GPU-implementation.
    Figure 4 shows an overview of our correction method, and            in Figure 5 and as shown in Eq. (1). In this way we get an SI
Algorithm 1 outlines the major execution steps in the method.           value in each pixel position for each color channel. In essence,
In the following sections each step of the correction process           calculating the SI values is a very fast approach to calculate
is described and motivated. Step 1 is executed once for the             an approximation of the gradient of each color plane in each
entire source Bayer data image. Step 2 is executed once per             pixel.
SI color channel. Steps 3–6 are executed once per red and blue
                                                                                SI = max{x0 , . . . , xn−1 } − min{x0 , . . . , xn−1 }            (1)
SI color channel. For clarity, the descriptions of steps 3–6 are
in the context of how the red channel is CA corrected (the
blue channel is CA corrected in the same conceptual way).               B. STEP 2 - CLASSIFY POTENTIAL REGIONS OF INTEREST
Step 7 is executed once using the CA corrected Bayer data               (ROI)
obtained from the previous steps.                                       The intensity of chromatic aberration increases with the dis-
                                                                        tance from the image center and is more prominent along
A. STEP 1 - COMPUTE THE SI COLOR PLANES                                 high-contrast tangential edges. Tangential edges are perpen-
The SI color planes are computed using the theory presented             dicular to the radius from the image center, see Figure 6. To be
in the original SI paper [16]. For each Bayer location, three           able to identify and classify tangential and radial vectors is a
corresponding SI values are calculated based on the patterns            central task in the ROI-selection process. According to [2],

VOLUME 9, 2021                                                                                                                                  99459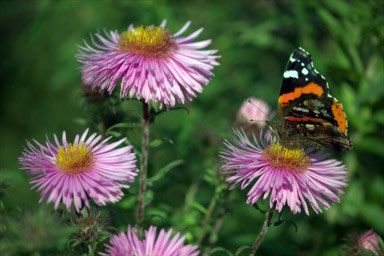
S. Petersson et al.: Blind Correction of Lateral CA in Raw Bayer Data

Algorithm 1 Lateral Chromatic Aberration Correction
 1: raw_image ← Raw image data from file
 2: for all bayer_locations in raw_image do                                                                             F Step 1
 3:     for color ← {red, green, blue} do                                        F A bayer_location is either red, green, or blue
 4:          Calculate SI value according to Figure 5 and Eq. (1)
 5:     end for
 6: end for
 7: Divide raw_image into compute_blocks of 8 × 8 pixels
 8: for all compute_blocks do                                                                                           F Step 2
 9:     for color ← {red, green, blue} do
10:          top_SI _color ← top n SI values in compute_block
11:          mean_top_SI _color ← average of ∀x ∈ top_SI _color
12:          ∀x ∈ top_SI _color estimate to what extent x resides along a radial or tangential edge
13:     end for
14: end for
15: for color ← {red, green, blue} do                                                                                   F Step 3
16:     for all blocks with value ≥ 0 do
17:          Put block in color_block_list                                                                  F One list per color
18:     end for
19: end for
20: for all top_bayer_locations from Step 2 in raw_image do                                                             F Step 4
21:     for color ← {red, blue} do
22:          CA% ← 100·CA
                        |Ep−Ec|
                                a
                                                                                                          F CA severity, Eq. (2)
                                  0.3
23:          ME ← |Ep − Ec| · 100                                                     F Maximum extent of CA severity, Eq. (3)
24:          Calculate a linear scaling factor based on the CA% from image center
25:     end for
26: end for
27: for color ← {red, blue} do                                                                                          F Step 5
28:     Calculate a polynomial (Eq. (4)) for rescaling the color pixels in relation to green
29: end for
30: for all bayer_locations in raw_image do                                                                             F Step 6
31:     for color ← {red, blue} do
32:          Align color at bayer_location according to the polynomial (Eq. (4))
33:     end for
34: end for
35: for all bayer_locations in raw_image do                                                                             F Step 7
36:     Perform RAW to RGB conversion (demosaicing)
37: end for

CA cannot be measured reliably if the distance from the            The block edge vector is estimated and represented as the line
image center to the measurement position is less than 30% of       of best fit using the least square method. The per-CU output
the distance from the center to the corners. The area (number      is: the average of the top n SI values scaled by the angle of
of pixels) of chromatic aberration in most lenses is roughly       the estimated edge vector and the pixel coordinates of each
proportional to the distance from the image center.                of the top n SI values. Blocks with high average SI values
   The SI image is conceptually divided into multiple              and edge vectors which are perpendicular to the radius vector
sub-regions of a predefined size. Since the method is intended     from the image center may eventually be processed further in
for GPGPU usage, it is recommended that a computation              the succeeding steps.
unit (CU) covers either 8×8 pixels or 16×16 pixels. Each CU
is responsible for identifying and calculating the following
information:                                                       C. STEP 3 - SELECT FINAL REGIONS OF INTEREST
                                                                   All red and green block results from step 2, with an output
  (i) the top n SI values,                                         value greater than zero, are placed into separate lists which
 (ii) the average of the top n SI values, and                      are sorted based on the scaled output value from step 2.
(iii) estimate to what extent the top n SI values within the       It is recommended that multiple sets of lists are defined so
      block reside along a radial or tangential edge.              that blocks are collected from multiple distances from the

99460                                                                                                                           VOLUME 9, 2021
S. Petersson et al.: Blind Correction of Lateral CA in Raw Bayer Data

                                                                        In the proposed method, the total search area covers the
                                                                        severity range from 0.00 to 0.30 and its maximum extent
                                                                        (ME), in pixels, is given by Eq. (3). For example, a pixel
                                                                        coordinate with distance of 1000 pixels from image center
                                                                        will have a maximum extent of 3 pixels.
                                                                                                    100 · CAa
                                                                                             CA% =                                 (2)
                                                                                                      |Ep − Ec|
                                                                                                                0.3
                                                                                             ME = |Ep − Ec| ·                      (3)
                                                                                                                100
                                                                           In multiple sub-pixel steps, from −ME ∗ s to ME ∗ s,
                                                                        the sampling coordinates are re-scaled and used to sample
                                                                        new values from the red color channel of the SI image. In each
                                                                        step, all green values are compared to the current red val-
FIGURE 6. Overview of the search area in the proposed CA correction
method.                                                                 ues. Two scaling factors with the lowest mean-squared-error
                                                                        (MSE) are stored; one factor < 1 and one factor > 1. Scaling
                                                                        factors outside the −ME to ME range are discarded.
image center. This is important since the polynomial function
created in step 5 is relying on scaling factors from multiple
                                                                        E. STEP 5 - CALCULATE POLYNOMIAL
image regions with different distances to the image center.
In the proposed implementation circular regions are used to             The most common functional approach to model the rescaling
ensure that all important spatial locations were covered, see           factors is a polynomial, see Eq. (4). According to optical
Figure 6. All blocks in each circular region that have the same         theory, the polynomial should only contain even powers [34].
spatial location and exist in both the red list and the green           It is common to limit the degree of the polynomial to either
list are selected for further processing. This means that we            six or eight.
select blocks where color gradient is high both in the red and              p(x) = pn x n + pn−1 x n−1 + . . . + p2 x 2 + p1 x + p0     (4)
the green color channel. It is recommended to not process all
blocks, since the processing time may be significant in images          F. STEP 6 - UPDATE SOURCE BAYER DATA
were the number of tangential edges is high.                            The most common color filter array (CFA) pattern is the
                                                                        Bayer pattern [7]. In Figure 3 the pattern is illustrated together
D. STEP 4 - FIND SCALING COEFFICIENT IN EACH ROI                        with the separated color planes, which are used in the pro-
The goal of this step is to identify a linear scaling factor            posed technique. The green information is stored in a quin-
that re-aligns the red SI color channel to better match the             cunx grid and the red and blue pixels in rectangular grids.
green SI color channel. The linear scaling factor is for that              To CA correct the red channel, the red color values are con-
specific distance from the center of the SI image. The blue             ceptually concatenated and thereafter sub-pixel resampled.
color channel is re-aligned in exactly the same way. The                The resampled color intensities are thereafter written back to
collection of all linear scaling factors, and their corresponding       the source Bayer data, which is then CA corrected. Multiple
distances to the SI image center, will later be used to define          resampling techniques exist but one recommendation is the
a polynomial function that is used to correct the chromatic             Catmull-Rom sampling technique [35]. Our proposed method
aberration for the entire image.                                        uses Catmull-Rom for upscaling and uses a linear down-
   For each top pixel coordinate from Step 2, one search                scaling. A more thorough evaluation of various sampling
area is defined. The defined search area consists of multiple           techniques for CA correction is left for future work.
sub-pixel coordinates which will be used to sample red and
green SI values. The green channel is sampled only once                 G. STEP 7 - RGB PROCESSING
per sub-pixel coordinate and will be used in the structural             The raw Bayer data is now updated with CA corrected color
comparison with the red channel. The red channel is sub-pixel           values for all color channels. Since the data is still unmodified
sampled multiple times during the search process.                       regarding color intensity, black levels, etc. any existing raw
   According to [2], CA can be quantified using the general             Bayer data processing pipeline can be used to generate the
Eq. (2), which converts CA in pixels (CAa ) to CA as percent-           final RGB color image representation.
age of the distance from the image center to a specific pixel
coordinate (|Ep − Ec|, where pE is the pixel location and Ec is the     IV. EXPERIMENTAL METHODOLOGY
image center). The CA severity is categorized as follows:               To evaluate the CA correction performance of our proposed
   •   < 0.04 ⇒ insignificant                                           method, we used 25 different raw images. To improve valid-
   •   0.04 − 0.08 ⇒ low                                                ity, all images are taken by different Canon camera mod-
   •   0.08 − 0.15 ⇒ moderate                                           els with no consideration of image content. Three versions
   •   > 0.15 ⇒ strong                                                  of each image were compared; uncorrected, CA corrected

VOLUME 9, 2021                                                                                                                        99461
S. Petersson et al.: Blind Correction of Lateral CA in Raw Bayer Data
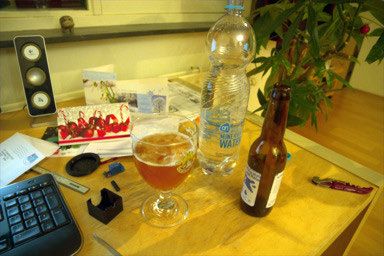
FIGURE 7. The 25 images used when evaluating the CA correction performance of the proposed method.
using DxO Optics Pro, and CA corrected using our proposed B. EVALUATION METRICS
method. As evaluation metric we have used variance of the We have selected the variance of the color differences (VCD)
color differences (VCD) [5], [6]. as metric for evaluating how well the CA is corrected. The
VCD metric has previously been used to evaluate CA artifacts
A. TEST IMAGE SET in both almost achromatic images and natural images [5],
It is important to select a representative, unbiased, and also [6]. We calculate the VCD for the Red channel, VCDR , and
diverse set of images for evaluation. In addition, we want to for the Blue channel, VCDB , respectively, see Eq. (5). In
use images freely available to enhance reproducibility and Eq. (5), M and N represent the image size, while Y (i, j) and
comparability. We have selected 25 images taken with differ- G(i, j) represent the color intensity of the red(R) (or blue(B))
ent Canon cameras, and the images are presented in chrono- color and the green color, respectively, in the pixel at position
logical order in Figure 7. All images were downloaded from (i, j). Lower VCD values represent a lower occurrence of CA
http://rawsamples.ch/ or https://raw.pixls.us/. The sizes of the artifacts.
images vary from 2048 × 3072 pixels (Canon EOS-10D) to
6720 × 4480 pixels (Canon EOS-5D Mark IV). PM PN 2
More publicly available Canon camera images exist, but i=0 j=0 [Y (i, j) − G(i, j)]
VCDY = (5)
were discarded since the DxO Optics Pro software did not M ·N
support CA correction of those camera combinations. Prior
to evaluation, all images were converted to digital nega- C. PARAMETER VARIATION
tives (DNG) using the DxO Optics Pro software. All pre- When evaluating our approach, we have a baseline parameter
and post-processing features were disabled in the DNG setting in our algorithm. In the results section, i.e., Section V,
conversion process. The DNG images were then used in all we first present results for all images using our default
evaluation cases. parameter setting, shown in bold in Table 1, i.e., we use a
99462 VOLUME 9, 2021
S. Petersson et al.: Blind Correction of Lateral CA in Raw Bayer Data

    FIGURE 8. Visual comparison of DxO and our correction method, for high resolution ((a)–(d)), medium resolution ((e)–(h)), and low resolution
    ((i)–(l)) images.

TABLE 1. Parameter variations in the measurements. The default values         Then, we evaluate how the CA corrrection capability of
are marked in bold in the table.
                                                                              our algorithm are affected for different parameter settings in
                                                                              Section V-B.

                                                                              A. CA CORRECTION RESULTS
                                                                              In Table 2, we present the VCD values for each of the images.
                                                                              We present values for uncorrected (Raw) images, images CA
                                                                              corrected using DxO Optics Pro, and images CA corrected
                                                                              using our method with default parameters. Numbers in bold
                                                                              indicate the best alternative for that particular image for each
subpixel size of 2, 8 × 8 threads, 7 rings, and DCB [36] for                  of the red and blue color channels (green is the reference color
demosaicing.                                                                  and is unchanged).
   In order to evaluate the impact of different parameter                        We start by looking at the bottom line in Table 2, where
settings, we have varied one parameter at a time, as shown                    the average VCD values over all images are presented.
in Table 1, while the other parameters keep their default val-                We observe that our proposed method is better at correcting
ues. The used demosaicing methods represent a wide range of                   chromatic aberration than DxO Optics Pro, averaged over
methods where computational complexity and interpolation                      25 images, for both the red and the blue color channel.
quality vary. In the results section we present the average                      Looking at the results for individual images, we observe
results, for each parameter setting, for all images.                          that our proposed method is best in 14 cases for the red color
                                                                              and 14 cases for the blue color, while DxO Optics Pro is best
V. EXPERIMENTAL RESULTS AND ANALYSIS                                          in 8 cases for the red color and 10 cases for the blue color.
We start our analysis with looking at the results with                        Thus, our proposed method is better in general, despite the
the default parameters for our algorithm in Section V-A.                      lack of prior knowledge of the camera-lens combination.

VOLUME 9, 2021                                                                                                                                     99463
S. Petersson et al.: Blind Correction of Lateral CA in Raw Bayer Data

TABLE 2. Comparison of VCD values when demosaicing using DCB and 7 rings, 64 samples per search vector and 2 sample locations per pixel.

TABLE 3. Results showing how different CA correction parameters affect the VCD values in the red and blue color channels.

  Based on the numbers in Table 2 it is difficult to make                    when our method is better, e.g., in terms of image content,
any general conclusion of when DxO Optics Pro is better or                   resolution, etc. Surprisingly, we found that in some rare cases

99464                                                                                                                                        VOLUME 9, 2021
S. Petersson et al.: Blind Correction of Lateral CA in Raw Bayer Data

both DxO Optics Pro as well as our method degrade the image             IMAGE CREDITS
quality in terms of chromatic aberration.                               All test images were taken from http://rawsamples.ch/ or
   In Figure 8, we show some visual comparison between                  https://raw.pixls.us/, and they all have the Creative Common
the uncorrected image and the versions corrected using DxO              License CC0 or CC-BY-NC-SA.
Optics Pro and our method, respectively. We have selected
representative images of high resolution (top row), medium              REFERENCES
resolution (middle row), and low resolution (bottom row).                [1] X. Wang, M. Pedersen, and J. Thomas, ‘‘The influence of chromatic
In general, there is virtually no visual difference between the              aberration on demosaicking,’’ in Proc. 5th Eur. Workshop Vis. Inf. Process.
corrected images, i.e., both DxO Optics Pro and our method                   (EUVIP 2014), Dec. 2014, pp. 1–6.
                                                                         [2] Imatest. (2017). Chomatic Aberration AKA Color Fringing. Accessed:
manage to remove or reduce the color fringes present in the                  Apr. 5, 2017. [Online]. Available: http://www.imatest.com/docs/
uncorrected image.                                                           sfr_chromatic/
                                                                         [3] J. Mallon and P. F. Whelan, ‘‘Calibration and removal of lateral chromatic
B. PARAMETER VARIATION                                                       aberration in images,’’ Pattern Recognit. Lett., vol. 28, no. 1, pp. 125–135,
                                                                             2007.
In order to evaluate how stable our method is, we varied                 [4] S.-W. Chung, ‘‘Removing chromatic aberration by digital image process-
a number of parameters for the algorithm, i.e., the number                   ing,’’ Opt. Eng., vol. 49, no. 6, Jun. 2010, Art. no. 067002.
of rings, the number of subpixels, the sample size, and the              [5] L. Pi, W. Wang, and M. Ng, ‘‘A spatially variant total variational model
                                                                             for chromatic aberration correction,’’ J. Vis. Commun. Image Represent.,
demosaic method, as listed in Table 1. When varying one                      vol. 41, pp. 296–304, Nov. 2016.
parameter, all other parameters were fixed to the default                [6] J. Chang, H. Kang, and M. G. Kang, ‘‘Correction of axial and lateral chro-
values (a subpixel size of 2, 8 × 8 threads, 7 rings, and DCB                matic aberration with false color filtering,’’ IEEE Trans. Image Process.,
                                                                             vol. 22, no. 3, pp. 1186–1198, Mar. 2013.
for demosaicing). All 25 test images were CA corrected using             [7] B. Bayer, ‘‘Color imaging array,’’ U.S. Patent 3 971 065, Jul. 20, 1976.
varying correction parameters.                                               [Online]. Available: http://www.google.com/patents/US3971065
   The correction results, averaged over all 25 test images,             [8] D. Zhang and X. Wu, ‘‘Color demosaicking via directional linear mini-
using varying parameters are presented in Table 3. No major                  mum mean square-error estimation,’’ IEEE Trans. Image Process., vol. 14,
                                                                             no. 12, pp. 2167–2178, Dec. 2005.
differences were observed when altering the ring count,                  [9] X. Wu and N. Zhang, ‘‘Primary-consistent soft-decision color demosaick-
the sample count, or the subpixel count. Instead, the most                   ing for digital cameras (patent pending),’’ IEEE Trans. Image Process.,
notably effect was observed when altering the demosaicing                    vol. 13, no. 9, pp. 1263–1274, Sep. 2004.
                                                                        [10] H. S. Malvar, L.-w. He, and R. Cutler, ‘‘High-quality linear interpolation
method used. Further, in line with results in Section V-A,                   for demosaicing of Bayer-patterned color images,’’ in Proc. IEEE Int. Conf.
our method are in general better than DxO Optics Pro in                      Acoust., Speech, Signal Process., May 2004, p. 485.
correcting chromatic aberration.                                        [11] K.-H. Chung and Y.-H. Chan, ‘‘Color demosaicing using variance of color
                                                                             differences,’’ IEEE Trans. Image Process., vol. 15, no. 10, pp. 2944–2955,
                                                                             Oct. 2006.
VI. CONCLUSION                                                          [12] B. K. Gunturk, Y. Altunbasak, and R. M. Mersereau, ‘‘Color plane interpo-
Chromatic aberration is a problem in color images as a                       lation using alternating projections,’’ IEEE Trans. Image Process., vol. 11,
result of different refraction angels in lenses for light of                 no. 9, pp. 997–1013, Sep. 2002.
                                                                        [13] N.-X. Lian, L. Chang, Y.-P. Tan, and V. Zagorodnov, ‘‘Adaptive filtering
different wavelengths. As a result, red or blue fringes may                  for color filter array demosaicking,’’ IEEE Trans. Image Process., vol. 16,
show up around edges and in high contrast areas of the                       no. 10, pp. 2515–2525, Oct. 2007.
image. Contemporary solutions mostly rely on lookup tables              [14] J. Kühn, T. Colomb, F. Montfort, F. Charrière, Y. Emery, E. Cuche,
with unique correction parameters for each camera/lens                       P. Marquet, and C. Depeursinge, ‘‘Real-time dual-wavelength digital holo-
                                                                             graphic microscopy with a single hologram acquisition,’’ Opt. Exp., vol. 15,
combination.                                                                 no. 12, pp. 7231–7242, Jun. 2007.
   In this paper, we propose a blind method to correct chro-            [15] S. B. Kang, ‘‘Automatic removal of chromatic aberration from a single
matic aberration errors in color images. We call our method                  image,’’ in Proc. IEEE Conf. Comput. Vis. Pattern Recognit. (CVPR),
                                                                             Jun. 2007, pp. 1–8.
blind since it does not rely on any prior knowledge of                  [16] S. Petersson, H. Grahn, and J. Rasmusson, ‘‘Color demosaicing using
how the image was captured, i.e., it requires no informa-                    structural instability,’’ in Proc. IEEE Int. Symp. Multimedia (ISM),
tion about the camera/lens combination or any correction                     Dec. 2016, pp. 541–544.
parameters.                                                             [17] Z. H. Zhang, C. E. Towers, and D. P. Towers, ‘‘Compensating lateral chro-
                                                                             matic aberration of a colour fringe projection system for shape metrology,’’
   The method (i) dynamically identifies the regions in the                  Opt. Lasers Eng., vol. 48, no. 2, pp. 159–165, Feb. 2010.
image that have the largest structural instability (steepest            [18] D. H. Foster, K. Amano, S. M. C. Nascimento, and M. Foster, ‘‘Frequency
changes in the different color planes), (ii) calculates a cor-               of metamerism in natural scenes,’’ J. Opt. Soc. Amer. A, Opt. Image Sci.,
                                                                             vol. 23, no. 12, pp. 2359–2372, 2006.
rection polynomial based on computed scaling coefficients,              [19] F. Yasuma, T. Mitsunaga, D. Iso, and S. K. Nayar, ‘‘Generalized
and (iii) finally aligns the different color planes according to             assorted pixel camera: Postcapture control of resolution, dynamic range
the correction polynomial.                                                   and spectrum,’’ Dept. Comput. Sci., Columbia Univ., New York,
                                                                             NY, USA, Tech. Rep. CUCS-061-08, Nov. 2008. [Online]. Available:
   We evaluate our method in comparison to DxO Optics Pro                    http://wwwl.cs.columbia.edu/CAVE/ databases/multispectral/
using 25 test images and the variance of the color differ-              [20] V. Rudakova and P. Monasse, ‘‘Precise correction of lateral chromatic aber-
ences (VCD) metric. The results show that our blind method                   ration in images,’’ in Image and Video Technology, R. Klette, M. Rivera,
                                                                             and S. Satoh, Eds. Berlin, Germany: Springer, 2014, pp. 12–22.
has a similar or slightly better error correction performance
                                                                        [21] P. Wang, N. Mohammad, and R. Menon, ‘‘Chromatic-aberration-corrected
as DxO Optics Pro, but without prior knowledge of the                        diffractive lenses for ultra-broadband focusing,’’ Sci. Rep., vol. 6, no. 1,
camera-lens setup.                                                           pp. 1–7, Aug. 2016.

VOLUME 9, 2021                                                                                                                                     99465
S. Petersson et al.: Blind Correction of Lateral CA in Raw Bayer Data
[22] T. Sun, Y. Peng, and W. Heidrich, ‘‘Revisiting cross-channel information STEFAN PETERSSON received the B.Sc. and
transfer for chromatic aberration correction,’’ in Proc. IEEE Int. Conf. M.Sc. degrees in computer science from the
Comput. Vis. (ICCV), Oct. 2017, pp. 3248–3256. Blekinge Institute of Technology (BTH), where
[23] C. Malleson and A. Hilton, ‘‘Joint demosaicing and chromatic aberration he is currently pursuing Ph.D. degree within the
correction of images using neural networks,’’ in Proc. Conf. Vis. Media BigData@BTH Project. He has been a Lecturer
Prod., Nov. 2019, p. 1. with BTH, since 2007. From 2011 to 2019, he was
[24] B. Llanos, ‘‘Chromatic aberration correction and spectral reconstruction a Program Manager of the master of science with
from colour images,’’ M.S. thesis, Dept. Comput. Sci., Univ. Alberta,
the Game and Software Engineering Program,
Edmonton, AB, Canada, 2019.
BTH. He is currently a Research Engineer within
[25] B. Llanos and Y.-H. Yang, ‘‘Simultaneous demosaicing and chromatic
aberration correction through spectral reconstruction,’’ in Proc. 17th Conf. the BigData@BTH Project. His current interests
Comput. Robot Vis. (CRV), May 2020, pp. 17–24. include computer graphics, image processing, and GPGPU.
[26] I. MacLaren and Q. M. Ramasse, ‘‘Aberration-corrected scanning trans-
mission electron microscopy for atomic-resolution studies of functional
oxides,’’ Int. Mater. Rev., vol. 59, no. 3, pp. 115–131, Apr. 2014.
[27] F. F. Krause, A. Rosenauer, J. Barthel, J. Mayer, K. Urban,
R. E. Dunin-Borkowski, H. G. Brown, B. D. Forbes, and L. J. Allen, HÅKAN GRAHN received the M.Sc. degree in
‘‘Atomic resolution elemental mapping using energy-filtered imaging computer science and engineering and the Ph.D.
scanning transmission electron microscopy with chromatic aberration degree in computer engineering from Lund Uni-
correction,’’ Ultramicroscopy, vol. 181, pp. 173–177, Oct. 2017. versity, in 1990 and 1995, respectively. From
[28] N. de Jonge, ‘‘Theory of the spatial resolution of (scanning) transmis- January 1999 to June 2002, he was the Head of the
sion electron microscopy in liquid water or ice layers,’’ Ultramicroscopy, Department of Software Engineering and Com-
vol. 187, pp. 113–125, Apr. 2018. puter Science. From 2011 to 2013, he was the Dean
[29] N. de Jonge, L. Houben, R. E. Dunin-Borkowski, and F. M. Ross,
of research with the Blekinge Institute of Technol-
‘‘Resolution and aberration correction in liquid cell transmission electron
ogy. He is currently a Professor of computer engi-
microscopy,’’ Nature Rev. Mater., vol. 4, no. 1, pp. 61–78, Jan. 2019.
[30] W. Wang, L. Pi, and M. K. Ng, ‘‘Saturation-value total variation model for neering with the Department of Computer Science,
chromatic aberration correction,’’ Inverse Problems Imag., vol. 14, no. 4, Blekinge Institute of Technology. He lead the research project ’’Scalable
pp. 733–755, 2020. resource-efficient system for big data analytics,’’ funded with 36 MSEK by
[31] J. Kim, K. J. Hornburg, M. J. Escuti, and N. Z. Warriner, ‘‘Chromatic- the Knowledge Foundation, from 2014 to 2020. He has published more than
aberration correction in geometric-phase lenses, for red, green, and blue 100 articles on these subjects, including 25 journal articles. His main inter-
operation (conference presentation),’’ Proc. SPIE, vol. 10361, Sep. 2017, ests include computer architecture, multicore systems, parallel computing,
Art. no. 1036113. performance evaluation, image processing, and AI/machine learning.
[32] T. Zhan, J. Zou, J. Xiong, X. Liu, H. Chen, J. Yang, S. Liu, Y. Dong, and
S. Wu, ‘‘Practical chromatic aberration correction in virtual reality displays
enabled by cost-effective ultra-broadband liquid crystal polymer lenses,’’
Adv. Opt. Mater., vol. 8, no. 2, Jan. 2020, Art. no. 1901360.
[33] J. Shen, F. Qian, and X. Chen, ‘‘Multi-camera panoramic stitching with JIM RASMUSSON received the M.Sc. and
real-time chromatic aberration correction,’’ J. Phys., Conf. Ser., vol. 1617, Tech. Lic. degrees from Lund University. Since
Aug. 2020, Art. no. 012046.
1990, he has been working in the mobile phone
[34] W. Hugemann, Correcting Lens Distortions in Digital Photographs. Brus-
industry. He has a long history of multimedia ori-
sels, Belgium: EVU, 2010.
[35] J. Li, Y. Koudota, M. Barkowsky, H. Primon, and P. L. Callet, ‘‘Com- ented algorithms and processing, including cam-
paring upscaling algorithms from HD to Ultra HD by evaluating prefer- era, image, graphics, computer vision, machine
ence of experience,’’ in Proc. 6th Int. Workshop Qual. Multimedia Exper. learning, speech, and audio. Recent main focus is
(QoMEX), Sep. 2014, pp. 208–213. visual media machine learning on heterogeneous
[36] J. Gozdz. (2010). DCB Demosaicing Algorithm. [Online]. Available: processing systems.
http://www.linuxphoto.org/html/dcb.html
99466 VOLUME 9, 2021You can also read