ATTENDANCE TRENDS AND STUDENT PERFORMANCE - MARCH 2022
←
→
Page content transcription
If your browser does not render page correctly, please read the page content below

ATTENDANCE TRENDS AND STUDENT PERFORMANCE
MARCH 2022

JAY LAMB – SD-STARS SUPPORT LEAD
Main Contact: STARSHelp@state.sd.us
8 Months (Aug. 2021)
Education
BSEd – Northern State University
MS – Administration and Leadership – NSU
Served as both a classroom teacher and
administrator.
TODAY’S AGENDA Why is attendance/achievement data important? How to find data in SD-STARS. You found a negative tend, now what? Teachers Principals/Administration School Counselors and Support Staff

10 FACTS ABOUT SCHOOL ATTENDANCE

                                                                            6.   Research shows that missing 10 percent of the school, or about
                                                                                 18 days in most districts, negatively affects a student’s academic
                                                                                 performance. That’s just two days a month and that’s known as
                                                                                 chronic absenteeism.
1.    Absenteeism in the first month of school can predict poor             7.   Students who live in communities with high levels of poverty are
      attendance throughout the school year. Half the students who               four times more likely to be chronically absent than others often
      miss 2-4 days in September go on to miss nearly a month of                 for reasons beyond their control, such as unstable housing,
      school.                                                                    unreliable transportation and a lack of access to health care.
2.    Over 8 million U.S. students miss nearly a month of school each       8.   When student improve their attendance rates, they improve
      year.                                                                      their academic prospects and chances for graduating.
3.    Absenteeism and its ill effects start early. One in 10 kindergarten   9.   Attendance improves when schools engage students and parents
      and first grade students are chronically absent.                           in positive ways and when schools provide mentors for
4.    Poor attendance can influence whether children read proficiently           chronically absent students.
      by the end of third grade or may be held back.                        10. Most school districts and states don’t look at all the right data to
5.    By 6th grade, chronic absence becomes a leading indicator that a           improve school attendance.They track how many students show
      student will drop out of high school.                                      up every day and how many are skipping school with an excuse,
                                                                                 but not how many are missing so many days in excused and
                                                                                 unexcused absences that they are headed off track academically.

                                                                                                                         - Attendance Works, 2022
WHY IS ATTENDANCE / ACHIEVEMENT DATA IMPORTANT?
Attendance Data Achievement Data
One absence is a missed opportunity to learn. What is achievement data?
Those missed opportunities start to develop gaps in Is it…?
learning. Classroom assessments
What are your schools doing to identify those State assessments
students who are missing those opportunities?
Passing grades
What are your schools doing to identify those gaps,
Advance Graduation Endorsements
and how are you helping close them?
Highschool diploma
Who is responsible to identify chronically absent
students and possible gaps?
TODAY’S AGENDA Why is attendance/achievement data important? How to find data in SD-STARS? You found a negative tend, now what? Teachers Principals/Administration School Counselors and Support Staff
How do I log into
                                                         SD-STARS?

                       If you do not have a K12 email,
                          reach out to the SD-STARS
                                    Team at
LOGGING INTO SD-         STARSHelp@state.sd.us and
STARS IS AS EASY AS      we can help guide you in the
LOGGING INTO YOUR K-            right direction.
12 EMAIL.
WHERE DO I FIND REPORTS?

                                            • State Reports – are reports that the DOE
                                              is providing to districts.

                                            • District Reports – are reports that
                                              district personnel (who have been trained in
                                              STARS Analytics) who are providing reports
                                              to their district.

   More information about STARS Analytics
   and becoming a Power User at the end
              of this webinar!
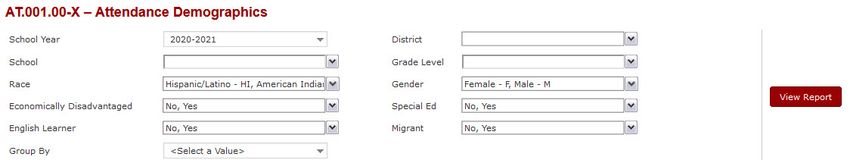
ATTENDANCE DEMOGRAPHICS
Attendance Demographics - The report provides a comprehensive and filterable view of student attendance
in a school or district by school year aggregated by district, economically disadvantaged, English learner, gender,
grade level, migrant, race, school, and special education.
Group By:
• District
• Economically
Disadvantage
• Grade Level
• Migrant
• Race
• School
• Special Education
Let's Take A Look!
We will be using aggregated reports with fictitious students. There will
be no FERPA violations.DATA INTERPRETATION GUIDES – DIGS
Data Interpretation Guide (DIG’s)
DIGs are guides that will help users use the reports. The
SD-STARS team created these guides to assist users to
understand the information from each report. DIGs can be
Can be found at found on the bottom of each report and in the training
the bottom of each center.
Can also be found in the
report. Training CenterSTUDENT ATTENDANCE LIST Student Attendance List - The report provides a comprehensive and filterable list of students enrolled in a school with their attendance. It is filterable by school year, district, school, grade level, race, gender, special education, English learner, migrant, and attendance status.
DRILLING IN!!!

                                           To drill in, click on blue hyperlink

    What will you see when you drill in?
    Let's Take A Look!
CHRONIC ABSENTEEISM DEMOGRAPHICS
Chronic Absenteeism Demographics - The report provides a comprehensive and filterable view of chronic
absenteeism in a school or district by school year aggregated by district, economically disadvantaged, English
learner, gender, grade level, migrant, race, school, and special education. Group By:
• District
• Economically
Disadvantage
• Grade Level
• Migrant
• Race
• School
• Special
Education
Let's Take A
Look!EARLY WARNING REPORT 1st Page of Report
EARLY WARNING REPOT – PAGE 2+

                                Demographics

       Red and Yellow Flags
STUDENT ACHIEVEMENT REPORT
Subgroup:
• Gap
• Non-Gap
• All subgroups for ExportREPORT CARD The ESSA Report Card is another tool to find attendance and student performance data.
TODAY’S AGENDA Why is attendance/achievement data important? How to find data in SD-STARS? You found a negative tend, now what? Teachers Principals/Administration School Counselors and Support Staff
TEACHER

Teachers can:
1. Take roll regularly showing students that you care when they miss school.
2. Reach out to frequently absent students to find out in a supportive manner why they are missing school and what
   would help them attend more regularly.
3. Work with parents to stress the importance of early education and to learn about any barriers to good
   attendance.
4. Create a nurturing, engaging classroom that will encourage children to come to school and work with colleagues
   to develop and implement a school-wide system of incentives and reward for good attendance.
5. Encourage families to partner with other school staff, such as social workers or nurses, as well as community
   agencies to get needed supports to help children and families solve a significant barriers to getting to school.

                                                                                          - Attendance Works, 2022
PRINCIPALS / ADMINISTRATION
Administrators can:
1. Cultivate a schoolwide approach that supports prevention and early intervention.
2. Take a team approach that draws upon the skills and assets of all school staff.
3. Develop staff capacity to adopt effective practices.
4. Utilize data in communications and decision-making on an ongoing basis.
- Attendance Works, 2022SCHOOL COUNSELORS AND SUPPORT STAFF
School Counselors can help work with students and families with prior to an emerging pattern of chronic absence to
unpack barriers to attendance and develop plans for overcoming them. They can also help schools create a more
engaging and positive school climate that motivates students to show up to class every day.
School Secretary and School Office Staff can play a key role in attendance, from ensuring accurate attendance reports
are available to creating a culture of attendance by interacting in a positive manner with students and their families.
School Nurses can help families assess if a student is well enough to attend class or stay home due to illness, help
manage chronic health issues such as asthma, can provide access to services, and encourage families to avoid missing
school for medical appointments.
- Attendance Works, 2022TRAININGS
Past Webinars Power User Training Fundamentals of Using Data
Currently, any reporting that districts for Educators
Past webinars can be found in the
Content Library and Training Center access in SD-STARS is created by the Every summer, the SD-STARS team
on the Portal Department of Education. STARS offers courses to educators
Analytics allows trained individuals, interested in learning more about
known as Power Users, access to raw data use in the classroom, school, and
data found in SD-STARS for their district. 1 graduate credit is available.
district. Power Users can then use
Watertown – June 17
that data to create their own reports,
Vermillion – June 21
for their own district, with their own
Rapid City – June 23
goals in mind.
Sioux Falls – March 29 and 30
Pierre – April 5 and 6
Rapid City – April 12 and 13
Virtual Follow up – May 5THANK YOU FOR ATTENDING!
Jay Lamb – SLDS Support Lead
Jay.Lamb@state.sd.us
Any question please reach out
at STARSHelp@state.sd.us
Sara Kock – SLDS Team Administrator
Sara.Kock@state.sd.us
Question: Do you agree with the following
Kim Carlson – SLDS Program Specialist statement? The information presented was useful.
Kim.Carlson@state.sd.us a. Strongly Agree
b. Agree
c. Somewhat Agree
d. Somewhat Disagree
e. Disagree
f. Strongly DisagreeYou can also read