Atrial fibrillation detection in primary care during blood pressure measurements and using a smartphone cardiac monitor
←
→
Page content transcription
If your browser does not render page correctly, please read the page content below
www.nature.com/scientificreports
OPEN Atrial fibrillation detection
in primary care during blood
pressure measurements and using
a smartphone cardiac monitor
John D. Sluyter1*, Robert Scragg1, Malakai ‘Ofanoa1 & Ralph A. H. Stewart2
Improved atrial fibrillation (AF) screening methods are required. We detected AF with pulse rate
variability (PRV) parameters using a blood pressure device (BP+; Uscom, Sydney, Australia) and with
a Kardia Mobile Cardiac Monitor (KMCM; AliveCor, Mountain View, CA). In 421 primary care patients
(mean (range) age: 72 (31–99) years), we diagnosed AF (n = 133) from 12-lead electrocardiogram
recordings, and performed PRV and KMCM measurements. PRV parameters detected AF with area
under curve (AUC) values of up to 0.92. Using the mean of two sequential readings increased AUC to
up to 0.94 and improved positive predictive value at a given sensitivity (by up to 18%). The KMCM
detected AF with 83% sensitivity and 68% specificity. 89 KMCM recordings were “unclassified” or
blank, and PRV detected AF in these with AUC values of up to 0.88. When non-AF arrhythmias (n = 56)
were excluded, the KMCM device had increased specificity (73%) and PRV had higher discrimination
performance (maximum AUC = 0.96). In decision curve analysis, all PRV parameters consistently
achieved a positive net benefit across the range of clinical thresholds. In primary care, AF can be
detected by PRV accurately and by KMCM, especially in the absence of non-AF arrhythmias or when
combinations of measurements are used.
Atrial fibrillation (AF) is the most common cardiac arrhythmia and is associated with a significantly increased
risk of s troke1. Stroke risk can be significantly diminished with effective anticoagulation for those deemed to have
a sufficiently high risk according to risk scores (e.g., C HA2DS2-VASc), making early AF detection important2.
However, AF is often diagnosed not early, but after a stroke event3. Thus, new methods to detect AF sooner are
needed.
AF can be detected opportunistically during automatic blood pressure (BP) measurement by assessing pulse
rate variability (PRV) from the beat-to-beat timing (irregularity of duration) of BP waveforms; useful since BP
is routinely assessed. Diagnostic studies show that this approach detects AF accurately with high sensitivity and
specificity4,5; more so than other non-ECG AF screening d evices6. These studies have been almost exclusively
carried out in outpatients. However, the applicability of these findings to primary care patients, who are most
likely to benefit from opportunistic screening, may be uncertain as the performance of screening tests varies
between populations and clinical settings due to the spectrum effect that can arise when results from a hospital
study are applied in the community setting of general practice7. QUAD-2 tool appraisal (quality assessment) of
these studies has highlighted other shortcomings, including that the statistical analyses in some studies treated
repeated measurements as separate observations, which is likely to break the assumption that they are independ-
ent by being c orrelated5. Further, as there was only one threshold of the PRV classifier evaluated for discrimina-
tion performance in each study (not a range), the study findings do not tailor to a range of clinical preferences
to balance false-positives and false-negatives8.
Another AF screening instrument is the Kardia Mobile Cardiac Monitor (KMCM; AliveCor, Mountain View,
CA): a hand-held, smartphone-coupled, 2-electrode cardiac rhythm recorder that generates a rhythm strip
equivalent to lead I for 30 s. Diagnostic studies show the KMCM detects AF accurately with high sensitivity
and specificity (both > 90%)9–11. However, it is not always (e.g., 28% of the t ime12) able to generate interpretable
recordings and give “normal” or “possible AF” classifications of these—and this results in missed cases and
reduced screening performance (e.g., sensitivity = 77%, specificity = 76%)12,13. For unclassified readings, reliance
on manual interpretation is not suitable if performed by inadequately skilled clinical s taff14 and, if interpreted
1
School of Population Health, University of Auckland, Private Bag 92019, Auckland, New Zealand. 2Green Lane
Cardiovascular Service, Auckland City Hospital, Auckland, New Zealand. *email: j.sluyter@auckland.ac.nz
Scientific Reports | (2021) 11:17721 | https://doi.org/10.1038/s41598-021-97475-1 1
Vol.:(0123456789)
www.nature.com/scientificreports/
by cardiologists13, requires consideration of their busy workloads. One way to address this problem could be to
use KMCM in combination with AF detection from a BP monitor as the latter would give a classification when
KMCM does not. But this approach has not been previously investigated.
Given the knowledge gap, we evaluated how well PRV measured using a BP monitor (BP+ device; Uscom,
Sydney, Australia) screens for AF in primary care. We hypothesised that this could detect AF a ccurately15, thereby
making it an attractive screening method as PRV can be assessed during measurement of both BP and other
parameters that predict cardiovascular events16–18. To build on past research, we assessed screening performance
across a range of PRV thresholds for AF detection by this instrument. Second, we examined the AF screening
performance of KMCM, including when used together with PRV.
Methods
Participants. Participants were recruited from four primary care practices in Auckland. Inclusion criteria
were men and women from these clinics. Participants were identified electronically from the patient database by
practice staff. To help ensure an adequate number of AF cases in our sample, we selected patients with a prior
AF diagnosis. To recruit those without AF, we selected patients without a prior AF diagnosis. For this selection
we used the database to calculate 5-year AF risk19 and recruited from highest to lowest risk in order to further
increase the chances of recruiting sufficient AF cases. An information sheet and personalised invitation let-
ter (from the clinic) were mailed to each home. This was followed up by clinic staff contacting each patient by
phone to schedule an interview time at the practice (for those interested). Nearly all patients were recruited this
way and the remaining patients were recruited opportunistically: during routine consultations, eligible patients
deemed as having a high AF risk were invited to participate. Ethics approval was provided by the Ministry of
Health Central Health and Disability Ethics committee. Written, informed consent was obtained from each par-
ticipant. All methods were carried out in accordance with the relevant guidelines and regulations.
Measurements. All measurements were performed by trained clinic staff using a standardised protocol.
Demographic and past medical history data were collected via questionnaires administered by staff. Past medical
history was also captured from the patient management system at each clinic.
After > 15 min rest and in the semi-reclining position, a 12-electrode lead ECG was performed to assess heart
rhythm. To diagnose AF cases and controls, the ECG readings was read by a senior (consultant) cardiologist
(R.A.H.S.), who was blinded to the corresponding PRV data (described next). Each ECG report also noted if
other arrhythmias were present.
Simultaneously to the ECG measurements or up to 1 min after this, suprasystolic oscillometry was carried out
twice using a BP+ device (Uscom, Sydney, Australia), with an appropriately-sized cuff positioned over the upper
arm. Results presented are based on the first measurement only, unless otherwise indicated. PRV was assessed
from the variability of the beat duration of the suprasystolic pressure waveforms derived from the BP+ device
using custom-written Matlab software (Mathworks, Natick, MA)20. The waveforms spanned approximately 10 s;
thus analysis was performed on approximately 10–12 pulse intervals. Six measures were used: (1) standardised
average real variability (standardised ARV; sARV), the mean of the absolute pulse-interval differences across
consecutive beats (analogous to ARV in BP variability measurement17), as a percentage of the mean of these
intervals, (2) root mean square of successive differences (RMSSD, square root of the mean of the squared differ-
ences of the duration of successive pulse intervals)15,18, (3) standard deviation (SD)21–23, (4) coefficient of variation
(CV; SD as a percentage of the mean pulse interval; reported as irregularity index in previous s tudies15,18,22,23), (5)
relative range, the range (maximum minus minimum) of all pulse intervals across beats divided by their mean
(comparable to relative range in BP variability a ssessment17) and, (6) irregular pulse percentage (IPP), the num-
ber of irregular pulses as a percentage of the total number of pulses24. For IPP, pulses were defined as irregular if
they were > ± 15%24 the duration of the mean beat. For the remaining parameters, to reduce false positives (e.g.,
ectopic beats), we excluded beats that were 25%21–23 to 30% shorter or longer than the mean beat duration. These
percentage differences were chosen as they provided optimal discrimination performance in our dataset (Sup-
plementary Fig. 1). Representative pulse recordings from the BP+ device are illustrated in Supplementary Fig. 2.
A KMCM, described above, was used immediately after to record a 30-s rhythm strip. The algorithm it uses
gives “normal” or “possible atrial fibrillation” classifications to recordings. If it cannot classify a recording to a
sufficient degree of confidence or if heart rate is < 50 or > 100 beats/minute and regular, the recording is labelled
“unclassified”12.
Statistical analysis. Analyses for participant characteristics were carried out using SAS version 9.4 (SAS
Institute, Cary, NC) and all others were performed using R version 3.6.325. Receiver operating characteristics
(ROC) curves were constructed to determine the ability of PRV parameters to correctly classify individuals on
the basis of their ECG-diagnosis result (AF present or absent). We assessed discrimination performance with
area under the ROC curve (AUC; with 95% confidence intervals) for PRV and with diagnostic accuracy for both
devices. These values represent the proportion of individuals that are correctly classified. Further, we quanti-
fied sensitivity, specificity, positive predictive value (PPV), negative predictive value and F1 score. F1 score is
a weighted average of sensitivity and PPV ranging from 0 to 1, with a high score indicating low false positive
and negatives26. To more stringently evaluate the validity of the PRV parameters, we performed a tenfold cross-
validation 10 times.
We performed multiple subgroup analyses. First, we excluded people with a non-AF arrhythmia as this could
reduce specificity15. Second, we omitted individuals with a rhythm that was paced as this could be regular in those
with AF (reducing sensitivity). Third, for PRV, we excluded those with a low pulse rate (defined as < 48 beats/
minute) as the associated relatively few number of beats (< 8 over the ~ 10-s recording period) could potentially
Scientific Reports | (2021) 11:17721 | https://doi.org/10.1038/s41598-021-97475-1 2
Vol:.(1234567890)www.nature.com/scientificreports/
12-ECG diagnosis from
study visit
Variable AF absent AF present
n 288 (100) 133 (100)
Age (years) 72 ± 12 71 ± 11
Male sex 151 (52) 84 (63)
Ethnicity
Pacific 242 (84) 66 (50)
Maori 5 (2) 11 (8)
Asian 5 (2) 2 (2)
European/other 36 (13) 54 (41)
No prior AF diagnosis 208 (72) 9 (7)
12-ECG diagnosis from study visit
Premature atrial contraction 14 (5) 0 (0)
Premature ventricular contraction 15 (5) 11 (8)
Supraventricular rhythm 1 (0.4) 0 (0)
Supraventricular tachycardia 1 (0.4) 0 (0)
Atrial arrhythmia 1 (0.4) 0 (0)
AV block (2nd-degree or complete) 1 (0.4) 0 (0)
Pacemaker 6 (2) 7 (5)
Junctional rhythm 3 (1) 1 (1)
12-lead ECG heart rate (beats/min) 70 ± 15 76 ± 15
PRV parameters
Standardised ARV (%)† 2.2 ± 2.9 16.2 ± 7.4
RMSSD (ms)† 23 ± 34 139 ± 104
Standard deviation (ms)† 18 ± 28 112 ± 67
Coefficient of variation (%)† 2.1 ± 2.7 12.6 ± 5.7
Relative range (%)† 6.6 ± 10.2 43.2 ± 16.7
Irregular pulse period (%)† 9.1 ± 11.0 50.0 ± 35.0
Pulse rate > 48 beats/minute 277 (96) 125 (94)
KMCM diagnosis
Normal 195 (68) 3 (2)
Possible AF 23 (8) 111 (83)
Unclassified 57 (20) 15 (11)
Blank (no analysis) 13 (5) 4 (3)
5-year AF risk ≥ 5% 185 (64) 71 (53)
High CHADS2 score (≥ 2) 219 (76) 84 (63)
High CHA2DS2-VASc score‡ 274 (95) 130 (98)
Table 1. Characteristics of participants. AF atrial fibrillation, AV atrioventricular, KMCM Kardia Mobile
Cardiac Monitor, PRV pulse rate variability, RMSSD root mean square of successive differences. *Values
are n (column %) or mean ± standard deviation, unless otherwise indicated; †Median ± interquartile range;
‡
CHA2DS2-VASc score ≥ 1 (males) or ≥ 2 (females).
screen for AF less accurately. Fourth, we performed a subgroup analysis (for PRV) that was limited to those
with unclassified/blank KMCM readings and another (for the KMCM) that excluded these readings. Given
the importance of detecting new AF cases, we performed a fifth subgroup analysis in those without a prior AF
diagnosis. Sixth, we restricted analysis to participants aged ≥ 65 years as clinical guidelines suggest opportunistic
screening in this age g roup4. As screening based on multivariable risk models has been suggested as an alterna-
tive to age, we performed a seventh subgroup analysis in those with 5-year AF risk ≥ 5%19. Finally, anticoagulant
therapy (for stroke prevention) has been recommended for AF patients with a CHADS2 score of ≥ 2 or with a
CHA2DS2-VASc score of ≥ 1 (in males) or ≥ 2 (in females)2. As those with these elevated stroke risk scores would
benefit most from AF s creening22, we performed subgroup analyses in these individuals.
For the PRV parameters, we calculated net benefit from decision curve analysis. The decision curve analysis
incorporates the information on both the benefit of correctly predicting the outcome (true-positives) and the
relative harm of over-reporting it (false-positives)—that is, the net benefit8. For instance, after putting these ben-
efits and harms on the same scale (by adjusting for their relative value), a net benefit of 0.1 means that, per 100
patients, there are 10 more benefits than harms8. As decision curves, we made a graphical presentation of the net
benefit over a range of threshold probabilities (or clinical preferences) of the outcome—for each PRV parameter,
for the default assumption that none have AF (not testing anyone for this outcome) and for the assumption that
Scientific Reports | (2021) 11:17721 | https://doi.org/10.1038/s41598-021-97475-1 3
Vol.:(0123456789)www.nature.com/scientificreports/
(a) All parameters
1.0
0.8 0.6
Sensitivity
Parameter
0.4
sARV
RMSSD
SD
0.2
CV
RR
IPP
0.0
0.0 0.2 0.4 0.6 0.8 1.0
1 - Specificity
(b) sARV
1.0
0.8 0.6
Sensitivity
0.4
Readings used to predict AF
0.2
1st
Mean
1st, no non-AF arrhythmias
0.0
0.0 0.2 0.4 0.6 0.8 1.0
1 - Specificity
Figure 1. Receiver operating characteristics curves for AF detection from pulse rate variability by: (a) all
parameters and, (b) sARV. 1st 1st reading, CV coefficient of variation, IPP irregular pulse percentage, RMSSD
root mean square of successive differences, RR relative range, sARV standardised average real variability, SD
standard deviation.
all do (testing everyone for AF). Precision-recall curves were constructed to illustrate the relationship between
PPV (precision) and sensitivity (recall)27. To summarise precision across sensitivities, we quantified area under
these curves (range: 0 to 1), with higher area indicating better overall p recision27. We used more than one
screening measurement to indicate AF as this can increase confidence in p redictions4. We constructed a second
set of curves based on PPV at an AF prevalence of 10%28 to assess performance in a less targeted p opulation18.
Results
There were 421 participants (56% male), 133 of whom were diagnosed as having AF based on their 12-lead ECG
at their study visit. Age was 72 years on average and ranged from 31 to 99 years. Nearly three-quarters (n = 309)
were of Pacific ethnicity. These characteristics and others are summarised in Table 1.
Scientific Reports | (2021) 11:17721 | https://doi.org/10.1038/s41598-021-97475-1 4
Vol:.(1234567890)www.nature.com/scientificreports/
Area under curve (95% confidence interval)
Sample sARV RMSSD SD CV Relative range IPP
Total (n = 421)
1st measurement 0.92 (0.89–0.95) 0.89 (0.85–0.92) 0.89 (0.86–0.93) 0.91 (0.87–0.94) 0.89 (0.85–0.93) 0.86 (0.82–0.90)
2nd measurement 0.93 (0.90–0.95) 0.90 (0.87–0.93) 0.92 (0.88–0.95) 0.92 (0.88–0.95) 0.91 (0.87–0.95) 0.85 (0.81–0.89)
Mean of 2 measure-
0.94 (0.91–0.96) 0.92 (0.89–0.95) 0.92 (0.88–0.95) 0.93 (0.90–0.96) 0.93 (0.90–0.97) 0.87 (0.84–0.91)
ments
Repeated* tenfold
0.89 (0.79–0.97) 0.92 (0.87–0.99) 0.89 (0.79–0.97) 0.90 (0.77–0.98) 0.91 (0.80–0.99) 0.90 (0.78–0.98)
cross-validation
Subgroups
Without non-AF
0.96 (0.93–0.98) 0.91 (0.88–0.95) 0.93 (0.90–0.96) 0.95 (0.92–0.97) 0.92 (0.89–0.96) 0.91 (0.87–0.94)
arrhythmias (n = 365)
Without paced rhythms
0.94 (0.92–0.97) 0.90 (0.87–0.94) 0.91 (0.88–0.94) 0.92 (0.89–0.95) 0.91 (0.87–0.94) 0.87 (0.84–0.91)
(n = 408)
Pulse rate > 48 beats/
0.92 (0.89–0.95) 0.89 (0.85–0.93) 0.90 (0.87–0.94) 0.91 (0.87–0.94) 0.89 (0.85–0.93) 0.88 (0.84–0.91)
min (n = 402)
Unclassified/blank
KMCM readings 0.86 (0.77–0.95) 0.88 (0.81–0.96) 0.86 (0.77–0.95) 0.85 (0.76–0.95) 0.82 (0.71–0.93) 0.76 (0.64–0.89)
(n = 89)
Without prior AF
0.95 (0.91–1.00) 0.95 (0.91–0.99) 0.92 (0.87–0.98) 0.92 (0.85–0.99) 0.92 (0.84–1.00) 0.87 (0.80–0.95)
diagnosis (n = 217)
Age ≥ 65 years (n = 314) 0.91 (0.88–0.95) 0.87 (0.82–0.92) 0.87 (0.82–0.92) 0.89 (0.85–0.93) 0.88 (0.83–0.93) 0.86 (0.82–0.91)
5-year AF risk ≥ 5%
0.89 (0.84–0.94) 0.84 (0.78–0.90) 0.86 (0.81–0.92) 0.86 (0.81–0.92) 0.84 (0.78–0.91) 0.86 (0.81–0.91)
(n = 256)
†
High CHADS2 score
0.91 (0.87–0.95) 0.87 (0.83–0.92) 0.88 (0.84–0.92) 0.89 (0.84–0.93) 0.88 (0.83–0.93) 0.85 (0.80–0.89)
(n = 303)
High CHA2DS2-VASc
0.92 (0.89–0.95) 0.89 (0.85–0.93) 0.90 (0.86–0.93) 0.91 (0.87–0.94) 0.89 (0.85–0.93) 0.86 (0.82–0.90)
s core‡ (n = 404)
Table 2. Discrimination performance of pulse rate variability parameters for detecting AF. AF atrial
fibrillation, CV coefficient of variation, IPP irregular pulse percentage, KMCM Kardia Mobile Cardiac Monitor,
RMSSD root mean square of successive differences, sARV standardised average real variability, SD standard
deviation. *10 times. †CHADS2 score ≥ 2; ‡CHA2DS2-VASc score ≥ 1 (males) or ≥ 2 (females).
PRV for detecting AF. All PRV parameters were substantially higher in people with AF than in those with-
out (Table 1). The discrimination performance of PRV in detecting AF is illustrated in Fig. 1 and summarised in
Table 2, with threshold-specific performances provided in Supplementary Tables 1–3. In the total sample, sARV
had the highest AUC (of 0.92) and IPP had the lowest (AUC = 0.86). Using the mean of the first and second
PRV readings (the median time between these was 95 s) for detection instead yielded higher AUC values (by up
to 0.04). These parameters also performed well in the cross-validation analysis, with AUC values of 0.89–0.92.
When we excluded people with a non-AF arrhythmia (n = 56), AUC increased by 0.02–0.05 to up to 0.96 (for
sARV). At high thresholds, this was due to improvements in mostly specificity as this increased more than sen-
sitivity at a given cut-point (Supplementary Tables 1 and 3). AUC was slightly higher (by up to 0.02) in individu-
als without a pacemaker (n = 408). Exclusion of those with a low pulse rate (< 48 beats/minute; n = 19) did not
alter discrimination performance compared to in the total sample. When analysis was restricted to those with
unclassified/blank KMCM readings (n = 89), AUC values remained high (up to 0.88). Similarly, discrimination
performance was high in those without a prior AF diagnosis (AUC = 0.87–0.95), and in those aged ≥ 65 years or
with elevated 5-year AF risk, CHADS2 and C HA2DS2-VASc scores (AUC = 0.84–0.92).
As demonstrated by decision curve analysis (Fig. 2), compared to the assumptions that none or all had AF,
all measures consistently had higher net benefit over the range of threshold probabilities. Net benefit for the first
reading was highest overall with sARV (Fig. 2a). In comparison, net benefit was higher when the mean of two
readings were used (e.g., exceeding 0.2 over a wider range of thresholds; Fig. 2b).
KMCM for detecting AF. Table 3 shows the diagnostic performance of the KMCM for detecting AF, with
supporting information (classification frequencies) provided in Table 1. Of the 421 KMCM recordings, 198 were
classified as “normal”, 134 “possible atrial fibrillation” and 72 “unclassified”. In the remaining 17 recordings, the
ECG output was blank as a reading could not be obtained despite multiple attempts. On assessing the accuracy
of all recordings, with “unclassified” and blank recordings (both deemed as incorrect) included, the KMCM had
83% sensitivity, 68% specificity and a diagnostic accuracy of 73%. When the “unclassified” and blank recordings
were excluded from the analysis, there were increases in sensitivity (to 97%), specificity (to 89%) and diagnostic
accuracy (to 92%). Overall, the KMCM did not detect 17% of the 133 ECG-determined AF cases; 68% of these
were due to “unclassified” KMCM recordings. Excluding participants with a non-AF arrhythmia increased sen-
sitivity and specificity to 86% and 73%, respectively. Sensitivity was higher (by 3%) in individuals without a pace-
maker. Restricting analysis to those with high C HADS2 and C HA2DS2-VASc scores had little effect on diagnostic
accuracy (71% and 73%, respectively).
Scientific Reports | (2021) 11:17721 | https://doi.org/10.1038/s41598-021-97475-1 5
Vol.:(0123456789)www.nature.com/scientificreports/
(a) 1st reading
0.4
sARV
RMSSD
SD
CV
RR
0.3
IPP
Assuming all have AF
Assuming none have AF
Net benefit
0.2
0.1
0.0
0 10 20 30 40 50 60 70
Threshold probability (%)
(b) Mean of 2 readings
0.4
sARV
RMSSD
SD
CV
RR
0.3
IPP
Assuming all have AF
Assuming none have AF
Net benefit
0.2
0.1
0.0
0 10 20 30 40 50 60 70
Threshold probability (%)
Figure 2. Decision curves for AF detection by pulse rate variability parameters with the: (a) 1st reading and, (b)
mean of 2 readings. Abbreviations are as for Fig. 1.
Positive‑prediction sample. Next, we varied the PRV threshold for AF detection by PRV and plotted the
associated PPV for each corresponding sensitivity value (Fig. 3). When the first PRV recording had to exceed
the threshold, PPV and area under the curves were high (Fig. 3a). This was especially for sARV, CV and relative
range, which had PPV values of > 0.8 across most sensitivities and the highest areas. Consistent with this, maxi-
mum F1 score was highest for these three parameters (Supplementary Table 1). These patters were similar when
we based PPV on an AF prevalence of 10% (Supplementary Fig. 3a).
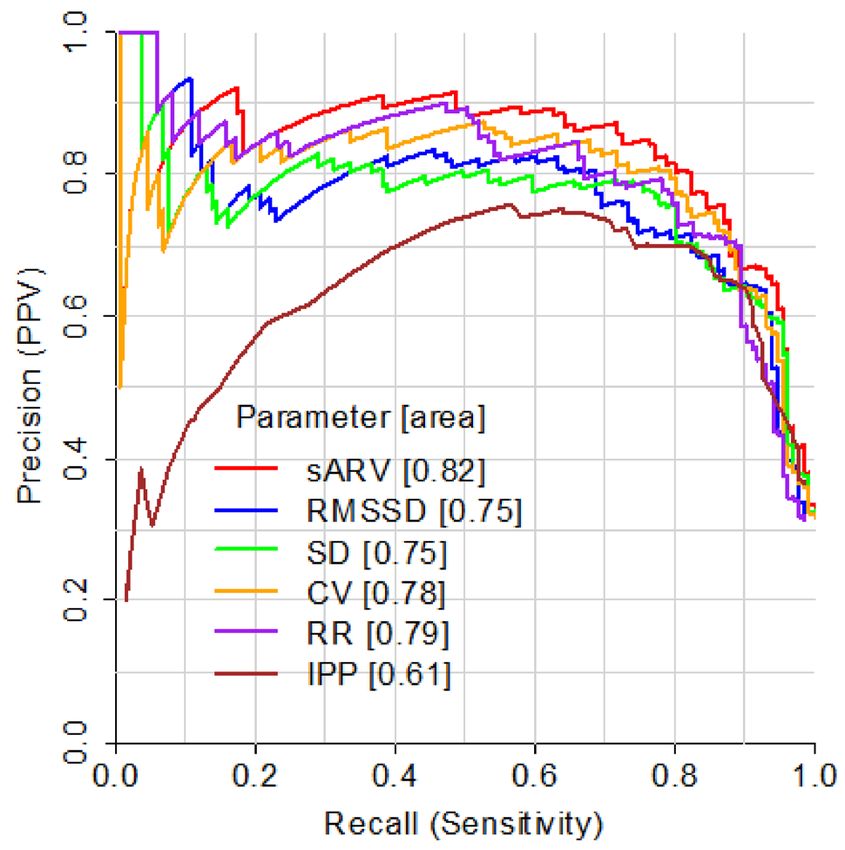
We then focused one of these parameters, sARV, to illustrate the effect of using combinations of measures
(Fig. 3b). PPV was higher (by up to 0.18) when the mean of the two sARV recordings had to exceed the thresh-
old (above sensitivities > 0.6) and when both recordings (not just the first one) had to. This was accompanied
by increases in maximum F1 score (by up to 0.04) and area under curves (Supplementary Table 2). A similar
improvement was observed when the first sARV recording had to exceed the threshold and the KMCM output
did not read “normal”. In comparison, PPV at a given sensitivity was higher (by up to 0.21) when using the
Scientific Reports | (2021) 11:17721 | https://doi.org/10.1038/s41598-021-97475-1 6
Vol:.(1234567890)www.nature.com/scientificreports/
Sample Sensitivity Specificity Diagnostic accuracy (%)
Total (n = 421) 83 68 73
Subgroups
Unclassified/blank readings excluded (n = 332) 97 89 92
Non-AF arrhythmias excluded (n = 365) 86 73 77
Paced rhythms excluded (n = 408) 86 68 74
No prior AF diagnosis (n = 217) 67 67 67
Age ≥ 65 years (n = 314) 83 68 72
5-year AF risk ≥ 5% (n = 256) 79 64 68
High CHADS2 score* (n = 303) 81 67 71
High CHA2DS2-VASc score† (n = 404) 84 68 73
Table 3. Diagnostic performance of the KMCM for detecting AF. AF atrial fibrillation, KMCM Kardia Mobile
Cardiac Monitor. *CHADS2 score ≥ 2; †CHA2DS2-VASc score ≥ 1 (males) or ≥ 2 (females).
mean of two sARV readings in combination with a KMCM reading that did not give a “normal” classification.
Basing PPV on an AF prevalence of 10% yielded similar patterns (Supplementary Fig. 3b). The abovementioned
improvements were observed between sensitivities of 0.65–0.9, corresponding to sARV values of 6–14% (23%
of sample).When we classified sARV predictions based on confidence of predictions, combining measurements
for “uncertain” predictions only significantly improved PPV (Supplementary Fig. 4).
Discussion
This diagnostic study of 421 primary care patients showed that AF determined from a 12-lead ECG can be
detected with PRV using a BP+ device or with a KMCM. Discrimination and precision were higher in people
without a non-AF arrhythmia. The utility of PRV was reinforced by its yield of positive net benefit across a range
of threshold probabilities (or clinical preferences to balance false-positives and false-negatives). Finally, using
combinations of measurements—two PRV ones or both a PRV and a KMCM recording—increased precision
compared with when a single measurement was employed.
BP+ findings. The accuracy of the PRV parameters (percentage of classifications that were correct) across
cut-points reached over 90% (Supplementary Tables 1–3), which is in the range of values observed for this
metric in previous AF diagnostic studies (nearly all on outpatient samples) of other BP monitors4. Further, the
95% confidence intervals for our AUC values encompassed the AUC values reported in a hospital-based study
of the BP+ d evice15. Our work extends these prior findings as we evaluated this device in a different setting (pri-
mary care) using different analytical approaches: in combination with the KMCM and using both decision and
precision-recall curve analyses. Additional novelty is derived from our use of parameters not assessed (sARV,
SD and relative range) in these past studies4 or examined each only in one prior study (RMSSD15 and IPP24).
Our findings are consistent with past studies reporting that, when more than one PRV reading from a BP
monitor indicating AF is required for AF diagnosis, discrimination performance improves22,29. We add to these
past findings by showing that this not only improves PPV at a given sensitivity, but so too does the mean of
two PRV measures. Further, the improvement in screening performance when we excluded (from our analysis)
non-AF arrhythmias is consistent with prior research on BP monitors which reports that these arrhythmias are
present in false-positive groups22,23,30 and specificity increases when they are absent15,22. This should not deter AF
screening in patients with known non-AF arrhythmias as this would lead to missed AF diagnoses and, in cases
of a false-positive AF diagnosis, patients may nevertheless benefit from an ECG for any non-AF abnormalities.
KMCM findings. Compared to KMCM sensitivity and specificity values reported in past diagnostic
studies9–11, the sensitivity we reported when we excluded unclassified and blank recordings from analyses was
similar (97%). But the associated specificity (89%) was lower. If our study had a higher prevalence of non-AF
arrhythmias in those without AF, this could explain the specificity difference as when these cases were excluded
from analyses, specificity increased (by 0.05; Table 3). This is a novel finding and suggests that, when screening
in patients with non-AF arrhythmias, one should be wary of a higher false-positive rate.
Further, sensitivity and specificity were substantially lower when we included unclassified and blank record-
ings (83% and 68%, respectively), which reflects the fact that our unclassified and blank outputs made up a
sizeable proportion (21%) of all KMCM readings. Such recordings increase the risk of missed or delayed AF
diagnoses if KMCM measurement is performed by those who cannot interpret ECGs at all or with sufficient
accuracy. This problem is highlighted by our finding that these readings were responsible for 86% of all unde-
tected AF cases. To address this, it has been suggested that cardiologists can interpret these readings13; but this
requires consideration of their busy workflows. However, in people with unclassified or blank KMCM recordings,
PRV was able to detect AF accurately, with an AUC of up to 0.89. Thus, using the BP+ alongside KMCM would
help to improve AF diagnosis, while minimising cardiologist time commitment.
Strengths and limitations. A strength of the present study is that, for our BP+ results, we evaluated sen-
sitivity, specificity and PPV at multiple cut-points, which allowed us to determine optimal thresholds for AF
Scientific Reports | (2021) 11:17721 | https://doi.org/10.1038/s41598-021-97475-1 7
Vol.:(0123456789)www.nature.com/scientificreports/
(a) All parameters
(b) sARV
Figure 3. Precision-recall curves for AF detection by pulse rate variability (PRV) with: (a) all parameters
and, (b) sARV. 1st first reading, KMCM Kardia Mobile Cardiac Monitor; other abbreviations are as for Fig. 1.
For KMCM curves, AF was indicated when the PRV recording had to exceed the threshold and the KMCM
output did not read “normal.” Values in brackets give area under each curve and F1 scores are reported in
Supplementary Tables 1 and 2.
detection for our study population; not done in past studies using other devices4. Second, we studied people who
are most likely to benefit from opportunistic screening: primary care patients, including those without a prior
AF diagnosis or at high risk of developing AF19 and stroke (elevated C HADS2 and CHA2DS2-VASc scores). As
for limitations, studying primary care patients only may restrict our ability to extrapolate findings more widely.
A second limitation is that not all measurements were carried out simultaneously with the 12-lead ECG, rais-
ing the possibility that AF may have not been consistently present or absent during the ECG and screening
measures. Such inconsistency may add to false positives and false negatives, leading to an underestimation of
diagnostic accuracy; but we expect the likelihood of this to be low given that all measurements were performed
in a narrow time-interval (typically within a few minutes). Third, although the cardiologist who interpreted our
Scientific Reports | (2021) 11:17721 | https://doi.org/10.1038/s41598-021-97475-1 8
Vol:.(1234567890)www.nature.com/scientificreports/
ECGs had > 30 years of cardiology experience, involving additional experienced cardiologists in our ECG diag-
noses may have provided some benefit.
Conclusion
In primary care patients, AF can be detected by PRV accurately and by KMCM, especially when used in combina-
tion and in the absence of non-AF arrhythmias. Performing two PRV measurements reduces misclassification.
Through early AF detection and subsequent treatment, implementing such measurements should have a mean-
ingful impact on the adverse health consequences of AF. For example, a population-based study showed that
elevated RMSSD and CV (indicative of AF) predicted increased risk of cerebrovascular events, even in people
without known AF or cerebrovascular d isease18. Intervention studies would clarify whether performing these
measurements in clinical practice lead to the expected improvements in AF-related health outcomes.
Data availability
No additional data are available. However, the original data that support the findings derived from this study
can be requested by emailing the corresponding author.
Received: 20 May 2021; Accepted: 24 August 2021
References
1. Lin, H. J. et al. Stroke severity in atrial fibrillation: The Framingham study. Stroke 27, 1760–1764 (1996).
2. Lip, G. Y. & Lane, D. A. Stroke prevention in atrial fibrillation: A systematic review. JAMA 313, 1950–1962. https://doi.org/10.
1001/jama.2015.4369 (2015).
3. Kamel, H. et al. Delayed detection of atrial fibrillation after ischemic stroke. J. Stroke Cerebrovasc. Dis. 18, 453–457. https://doi.
org/10.1016/j.jstrokecerebrovasdis.2009.01.012 (2009).
4. Verberk, W. J., Omboni, S., Kollias, A. & Stergiou, G. S. Screening for atrial fibrillation with automated blood pressure measure-
ment: Research evidence and practice recommendations. Int. J. Cardiol. 203, 465–473. https://doi.org/10.1016/j.ijcard.2015.10.
182 (2016).
5. Kane, S. A., Blake, J. R., McArdle, F. J., Langley, P. & Sims, A. J. Opportunistic detection of atrial fibrillation using blood pressure
monitors: A systematic review. Open Heart 3, 1–6 (2016).
6. Taggar, J. S., Coleman, T., Lewis, S., Heneghan, C. & Jones, M. Accuracy of methods for detecting an irregular pulse and suspected
atrial fibrillation: A systematic review and meta-analysis. Eur. J. Prev. Cardiol. 23, 1330–1338. https://doi.org/10.1177/2047487315
611347 (2016).
7. Mulherin, S. A. & Miller, W. C. Spectrum bias or spectrum effect? Subgroup variation in diagnostic test evaluation. Ann. Intern.
Med. 137, 598–602 (2002).
8. Van Calster, B. et al. Reporting and interpreting decision curve analysis: A guide for investigators. Eur. Urol. 74, 796–804. https://
doi.org/10.1016/j.eururo.2018.08.038 (2018).
9. Orchard, J. et al. Screening for atrial fibrillation during influenza vaccinations by primary care nurses using a smartphone elec-
trocardiograph (iECG): A feasibility study. Eur. J. Prev. Cardiol. 23, 13–20. https://doi.org/10.1177/2047487316670255 (2016).
10. Lau, J. K. et al. IPhone ECG application for community screening to detect silent atrial fibrillation: A novel technology to prevent
stroke. Int. J. Cardiol. 165, 193–194. https://doi.org/10.1016/j.ijcard.2013.01.220 (2013).
11. Williams, J., Pearce, K. & Benett, I. The effectiveness of a mobile ECG device in identifying AF: Sensitivity, specificity and predictive
value. Br. J. Cardiol. 22, 70–72. https://doi.org/10.5837/bjc.2015.013 (2015).
12. William, A. D. et al. Assessing the accuracy of an automated atrial fibrillation detection algorithm using smartphone technology:
The iREAD Study. Heart Rhythm 15, 1561–1565. https://doi.org/10.1016/j.hrthm.2018.06.037 (2018).
13. Koshy, A. N. et al. Accuracy of blinded clinician interpretation of single-lead smartphone electrocardiograms and a proposed
clinical workflow. Am. Heart J. 205, 149–153. https://doi.org/10.1016/j.ahj.2018.08.001 (2018).
14. Mant, J. et al. Accuracy of diagnosing atrial fibrillation on electrocardiogram by primary care practitioners and interpretative
diagnostic software: Analysis of data from screening for atrial fibrillation in the elderly (SAFE) trial. BMJ 335, 380–382. https://
doi.org/10.1136/bmj.39227.551713.AE (2007).
15. Lowe, A., Oh, T. H. & Stewart, R. Screening for atrial fibrillation during automatic blood pressure measurements. IEEE J. Transl.
Eng. Health Med. 6, 1–7. https://doi.org/10.1109/JTEHM.2018.2869609 (2018).
16. Sluyter, J. D. et al. Identification of distinct arterial waveform clusters and a longitudinal evaluation of their clinical usefulness.
Hypertension 74, 921–928. https://doi.org/10.1161/HYPERTENSIONAHA.119.12625 (2019).
17. Sluyter, J. D., Camargo, C. A. & Scragg, R. K. R. Ten-second central SBP variability predicts first and recurrent cardiovascular
events. J. Hypertens. 37, 530–537. https://doi.org/10.1097/HJH.0000000000001930 (2019).
18. Sluyter, J. D., Camargo, C. A., Lowe, A. & Scragg, R. K. R. Pulse rate variability predicts atrial fibrillation and cerebrovascular events
in a large, population-based cohort. Int. J. Cardiol. 275, 83–88. https://doi.org/10.1016/j.ijcard.2018.10.026 (2019).
19. Alonso, A. et al. Simple risk model predicts incidence of atrial fibrillation in a racially and geographically diverse population: The
CHARGE-AF consortium. JAHA https://doi.org/10.1161/JAHA.112.000102 (2013).
20. Matlab 2021a. The MathWorks Inc. www.mathworks.com/products/new_products/latest_features.html (2021).
21. Stergiou, G. S., Karpettas, N., Protogerou, A., Nasothimiou, E. G. & Kyriakidis, M. Diagnostic accuracy of a home blood pressure
monitor to detect atrial fibrillation. J. Hum. Hypertens. 23, 654–658. https://doi.org/10.1038/jhh.2009.5 (2009).
22. Wiesel, J., Fitzig, L., Herschman, Y. & Messineo, F. C. Detection of atrial fibrillation using a modified microlife blood pressure
monitor. Am. J. Hypertens. 22, 848–852. https://doi.org/10.1038/ajh.2009.98 (2009).
23. Marazzi, G. et al. Comparison of microlife BP A200 plus and omron M6 blood pressure monitors to detect atrial fibrillation in
hypertensive patients. Adv. Ther. 29, 64–70. https://doi.org/10.1007/s12325-011-0087-0 (2012).
24. Kabutoya, T., Imai, Y., Hoshide, S. & Kario, K. Diagnostic accuracy of a new algorithm to detect atrial fibrillation in a home blood
pressure monitor. J. Clin. Hypertens. 19, 1143–1147. https://doi.org/10.1111/jch.13076 (2017).
25. R Core Team. R: A Language and Environment for Statistical Computing. (R Foundation for Statistical Computing, 2020). www.R-
project.org/.
26. Alakus, T. B. & Turkoglu, I. Comparison of deep learning approaches to predict COVID-19 infection. Chaos Solitons Fractals 140,
11012. https://doi.org/10.1016/j.chaos.2020.110120 (2020).
27. Ni, Y. et al. Towards phenotyping stroke: Leveraging data from a large-scale epidemiological study to detect stroke diagnosis. PLoS
ONE 13, e0192586. https://doi.org/10.1371/journal.pone.0192586 (2018).
28. Wong, H. B. & Lim, G. H. Measures of diagnostic accuracy: Sensitivity, specificity, PPV and NPV. Proc. Singapore Healthc. 20,
316–318. https://doi.org/10.1177/201010581102000411 (2011).
Scientific Reports | (2021) 11:17721 | https://doi.org/10.1038/s41598-021-97475-1 9
Vol.:(0123456789)www.nature.com/scientificreports/
29. Wiesel, J., Arbesfeld, B. & Schechter, D. Comparison of the microlife blood pressure monitor with the omron blood pressure
monitor for detecting atrial fibrillation. Am. J. Cardiol. 114, 1046–1048. https://doi.org/10.1016/j.amjcard.2014.07.016 (2014).
30. Wiesel, J., Wiesel, D., Suri, R. & Messineo, F. C. The use of a modified sphygmomanometer to detect atrial fibrillation in outpatients.
Pacing Clin. Electrophysiol. 27, 639–643. https://doi.org/10.1111/j.1540-8159.2004.00499.x (2004).
Acknowledgements
We thank the study participants. We gratefully acknowledge the staff of the Tongan Health Society, Ratanui
Medical Centre, West Fono Health and South Seas Healthcare for providing access to their patients and facilities.
Author contributions
All authors contributed to the conception and design of the study. J.D.S. and R.A.H.S. contributed to interpreta-
tion of data. J.D.S. contributed to data acquisition and analysis, and drafted the manuscript. All authors critically
revised the manuscript. All gave final approval and agree to be accountable for all aspects of work, ensuring
integrity and accuracy.
Funding
The Health Research Council of New Zealand funded this study and supported J.D.S. with a Sir Thomas Davis
fellowship (Grant 18/258).
Competing interests
The authors declare no competing interests.
Additional information
Supplementary Information The online version contains supplementary material available at https://doi.org/
10.1038/s41598-021-97475-1.
Correspondence and requests for materials should be addressed to J.D.S.
Reprints and permissions information is available at www.nature.com/reprints.
Publisher’s note Springer Nature remains neutral with regard to jurisdictional claims in published maps and
institutional affiliations.
Open Access This article is licensed under a Creative Commons Attribution 4.0 International
License, which permits use, sharing, adaptation, distribution and reproduction in any medium or
format, as long as you give appropriate credit to the original author(s) and the source, provide a link to the
Creative Commons licence, and indicate if changes were made. The images or other third party material in this
article are included in the article’s Creative Commons licence, unless indicated otherwise in a credit line to the
material. If material is not included in the article’s Creative Commons licence and your intended use is not
permitted by statutory regulation or exceeds the permitted use, you will need to obtain permission directly from
the copyright holder. To view a copy of this licence, visit http://creativecommons.org/licenses/by/4.0/.
© The Author(s) 2021
Scientific Reports | (2021) 11:17721 | https://doi.org/10.1038/s41598-021-97475-1 10
Vol:.(1234567890)You can also read