ASSESSMENT OF THE IMPACT OF URBANISATION ON AGRICULTURAL AND FOREST AREAS IN THE COASTAL ZONE OF MOSTAGANEM (WESTERN ALGERIA)
←
→
Page content transcription
If your browser does not render page correctly, please read the page content below
Ekológia (Bratislava) - Journal of the Institute of Landscape Ecology, Slovak Academy of Sciences Vol. 40, No. 3, p. 230–239, 2021
doi:10.2478/eko-2021-0025
ASSESSMENT OF THE IMPACT OF URBANISATION ON AGRICULTURAL
AND FOREST AREAS IN THE COASTAL ZONE OF MOSTAGANEM
(WESTERN ALGERIA)
ABBASSIA MOSTARI 1, KHELOUFI BENABDELI2, TAHAR FERAH2
1
Department of Biology, Faculty of Life Sciences, University Abdelhamid Ibn Badis of Mostaganem, Rue Benkada Tayeb, Mostaganem 27000, Algeria; e- mail:
mostari_abie27@yahoo.fr,ferahtahar@yahoo.fr
2
Laboratary Geo-Environment and spaces development, Faculty of Sciences of Nature and Life, University Mustapha Stambouli of Mascara, BP 305 Sidi Said
Mascara 29000 Algeria; e-mail: kbenabdeli@yahoo.fr
Corresponding author
Received: 25 September 2020 / Accepted: 5 January 2021
Abstract
Mostari A., Benabdeli K., Ferah T.: Assessment of the impact of urbanisation on agricultural and forest areas in the coastal zone of Mostaganem
(western Algeria). Ekológia (Bratislava), Vol. 40, No. 3, p. 230–239, 2021.
The accelerated and uncontrolled urbanisation in the coastal zone of Mostaganem is exclusively at the expense of agricultural and natural areas and
is reflected in the aggravation of their degradation. The study area is a 62-km-long littoral to the west of Mostaganem and includes 11 municipalities.
The Corine Land Cover nomenclature was used by exploiting data from Landsat satellite images over a 30-year period. The exploitation of statistics
related to agricultural and forestry areas reveals a worrying dynamics. All spaces are under pressure mainly due to urbanisation. The phenomena of
urbanization and coastalisation and the development of seaside tourism have increased the pressures on natural heritage to the point of compromis-
ing it. The analysis identified seven thematic object classes for the study area. An assessment of the dynamics of urban, forest and agricultural areas is
an informative indicator of the sustainability of natural areas in the coastline of Mostaganem. The cultivated areas measured from 42,356 ha in 1985 to
38,301 ha in 2015,forest formations from 8207 ha to 9298 ha and urbanised areas from 2604 ha to 5049 ha. The dramatic land use change stimulated
by rapid urbanisation in the study areas has resulted in a fundamental change in the landscape pattern. The thematic maps and the results obtained
through different periods show that the predominant agricultural landscape has been gradually converted into urban areas.
Key words: coastline, dynamic, environment, land change, land cover, thematic maps.
Introduction relating to the enhancement of the Algerian coast through sustain-
able coastal development, the west coast (445 km) which stretches
In recent years, the temporal dimension of landscapes has to be from the river Ouedkiss at the Moroccan border in the west up to
considered as important as the spatial dimension, in order to mount of Dahra in the east, undergoes a worrying degradation.
monitor and assess human and ecological interactions (Hasse et The result is a reconversion of land use resulting in the phenom-
al., 2003; Houet et al., 2010; Li et al., 2016). According to Paegelow enon of silting, regression of agricultural land, large loss of plant
et al. (2014), the exploitation of coastal areas manifests itself in biodiversity and reconfiguration of the coastline. As a result of the
new forms in contradiction with any strategy of well-balanced concentration of the population and industry on the coast, there
and sustainable development of the territory. The problem of sus- has been an increased need for housing, which has led to imple-
tainable management of the Algerian littoral, a vulnerable and mentation of development and urban development plans. The
overexploited environment, lies in an uncontrolled urbanisation coastline has been officially attacked (put in danger) and all the
with all its consequences (Rabehi et al., 2018, 2019a; Otmani et natural ecosystems have been weakened and destroyed since the
al., 2019).The phenomenon puts constant pressure on the natural coastal urban extensions were made to the detriment of the agri-
ecosystems and agricultural land (Boudjenouia et al., 2008; Sem- cultural and forest area. The phenomenon of littoralisation of the
moud, Ladhem, 2015).This pressure is caused by urbanisation and region of Mostaganem has resulted in a major change in the coast-
the installation of industrial and tourist activities (Lagabrielle et al areas dominated by the establishment of summer and secondary
al., 2007; Lestrelin et al., 2007). The coastline is a territory with residences as well as real estate and tourism projects (Ghodbani,
many types of ecosystems, habitats and landscapes that must be Berrahi-Midoun, 2013; Ghodbani et al., 2016).This natural and
preserved. Despite the promulgation of the law n ° 02-02 of 5 Feb- protected area is used to relieve the city of Mostaganem by devel-
ruary 2002 (Journal Officiel de la République Algérienne, 2002) oping housing projects in the agglomerations of Salamandre and
© The Author(s) 2021. This is an open access article distributed under the terms of the CC BY-NC-ND license.
https://content.sciendo.com/view/journals/eko/eko-overview.xml
230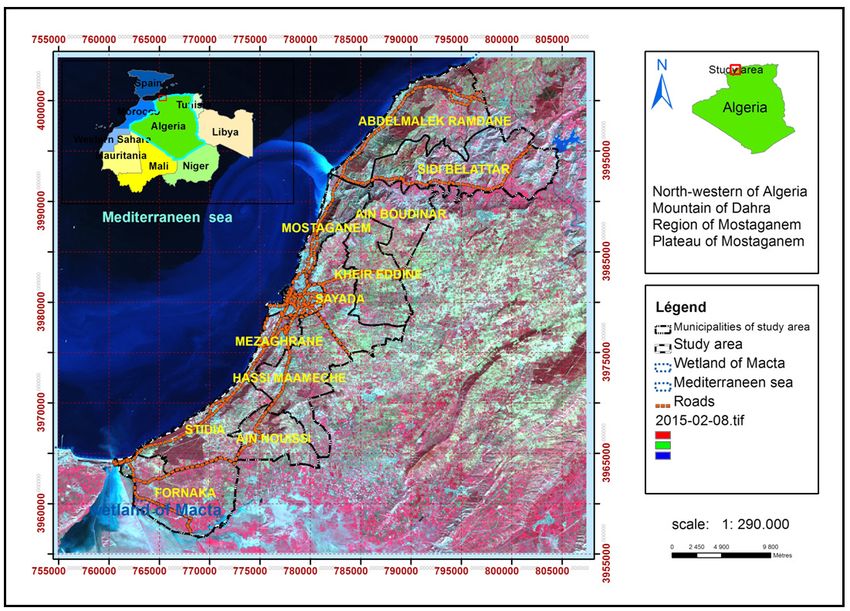
Ekológia (Bratislava) 2021: 40(3): 230–239
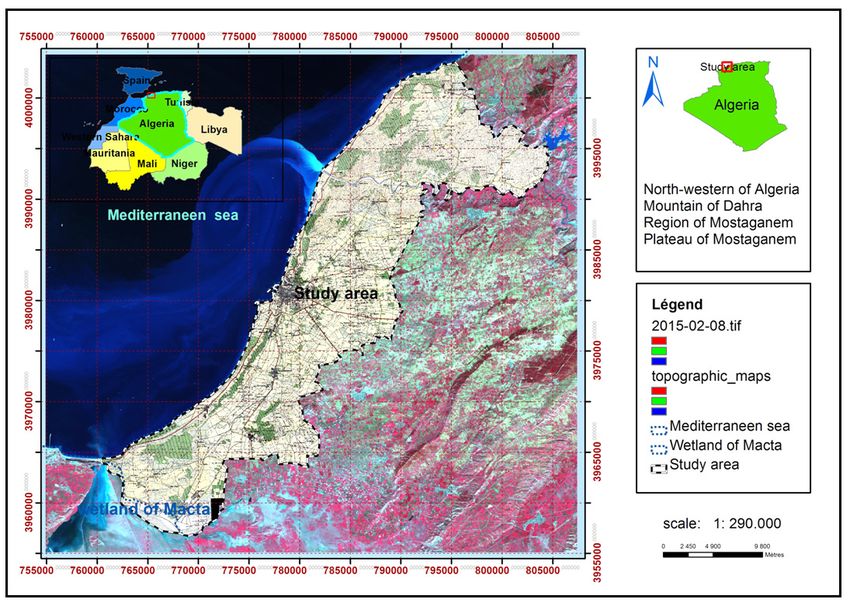
Fig. 1. Geographical location of the study area.
Kharouba (Dirassat, 2008; ANAT, 1997, 2006). All constructions use of remote sensing in monitoring and modelling land use and
are in a linear orientation facing the sea, often even at the edge cover change associated with urbanisation are of great importance
of the shore, despite the legislation wich prohibits urbanisation in understanding how these changes interact with ecological and
on a strip of territory 100-m wide from the shore and 300-m in social processes. The use of spatial tools to illustrate explicit land
the event of fragility of the coastal ecosystem (Ghodbani, Sem- changes is helpful in making land use management decisions and
moud, 2010). The problems caused by urbanisation are enormous sustainable landscape (Gounaridis, 2016; Güngöroğlu et al., 2017;
and varied. Since 1970, the migration of hundreds of thousands Sharma et al., 2018).The approach presented can act as a baseline
of people from rural to urban areas has led to a strong urbani- to continuously monitor land change and to assist ongoing and up-
sation wich is proving multidimensional process that manifests coming land change mapping initiatives.
itself through rapidly changing human population and changing
land cover (Elmqvist et al., 2013). In addition to the natural fac- Material and methods
tors, the anthropogenic factors also have contributed much to the
situation. Human interventions like harbour, road, sandmining, Introducing the study area
tourism, beach resort and construction of stations of desalina-
tion, particularly over the last four decades, have also caused sig- Located north west of Algeria, the study area is a 62-km-long
nificant changes in the coastal environment (Ghodbani et al., 2015; littoral to the west of Mostaganem, which is 124-km long as a
Patra, 2017).This is the case of the littoral of Mostaganem along whole. Its limits are: the estuary of Macta River to the west, Rou-
the coastal municipalities, where increasing conversion of agricul- mane River to the east, the Mediterranean Sea to the north and
tural and natural areas to human‐dominated urban lands capes is the Macta plain to the south. The surface of this area is 56,100 ha,
predicted to lead to a major decline in biodiversity (Benhouhou that is, 13% of the total Mostaganem province surface. The study
et al., 2018). As evidenced by the scientific literature, our results area is geographically located 0°7’21.60”west, 35°47’18.61” north
demonstrate that urbanisation may fundamentally and consist- and 0°23’1.04” east, 36°3’13.28” north. It includes 11 of 32 Mo-
ently alter species composition by exerting a strong filtering effect staganem municipalities: Ain Nouissy, Abdelmalek Ramdane,
on species dispersal characteristics (Piano et al., 2017). As demon- Boudinar, Fornaka, Hassi Maméche, Kheir Eddine, Mezaghrane,
strated by Qiang and Lam (2015) and Aguejdad et al. (2017), the Mostaganem, Sayada, Sidi Belattar and Stidia (Figs 1, 2).
231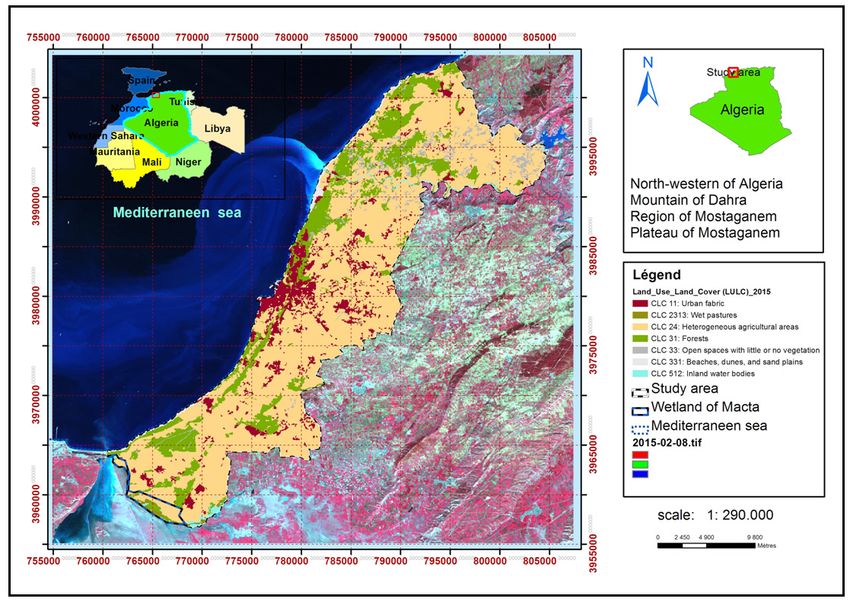
Ekológia (Bratislava) 2021: 40(3): 230–239

                                             Fig. 2.Administrative situation of the study area.

Table 1. List of topographic maps used in this study.

                                                        Topographic maps 1/50 000
                                             1-Sidi_Ali_NJ_31_1_7
 2-Arzew_NI_31_XXIV_2                                                                             4-Mostaganem_NI_31_XIX_1_East
                                             3-Mostaganem_NI_31_XIX_1_ West
 5-Sig_NI_30_XXIV_4_East                     6-Mohamadia_NI_31_XIX_3_West

Cartography                                                               zone study with its communes. To delimit the area of interest,
                                                                          we carried out, as part of a geographic information system (GIS),
The exploitation of six topographic maps at 1/50,000th of 1989            an operation of crossing layers of information. This GIS applica-
(Arzew, Mostaganem, Sidi Ali, Sig and Mohammadia) made it                 tion allowed us to visualise and cut out the study area according
possible to map all the studied municipalities (Table 1).                 to the size of the municipalities concerned by the area of inter-
    To format the map data, we used the Arc G IS 10.0 software            est by using the Comgeo digital file available in Shapefile (Shp)
which allowed us to georeference the maps according to UTM                format. We established the Digital Terrain Model (DTM) of the
projection WGS 84 zone 31 datum. The georeferencing methods               area at 30-m from Shuttle Radar Topography. The physical en-
allowed us to stall and assemble all the maps in order to cre-            vironment of the area is characterised by rugged terrain in the
ate the topographical background of the study area. To achieve            east, especially east of Mostaganem and north of the communes
maps definitively, we proceeded to the technique of mosaicing             of Sidi Belaatar and Abdelmalek Ramdane. The altitude of the
of cards, which makes it possible to assemble and merge all the           terrain varies between 0 and 415 m. The upper altitudinal ranges
maps as a single map to find the geographical situation of the            (260–415 m) largely occupy the eastern part of the area, particu-

232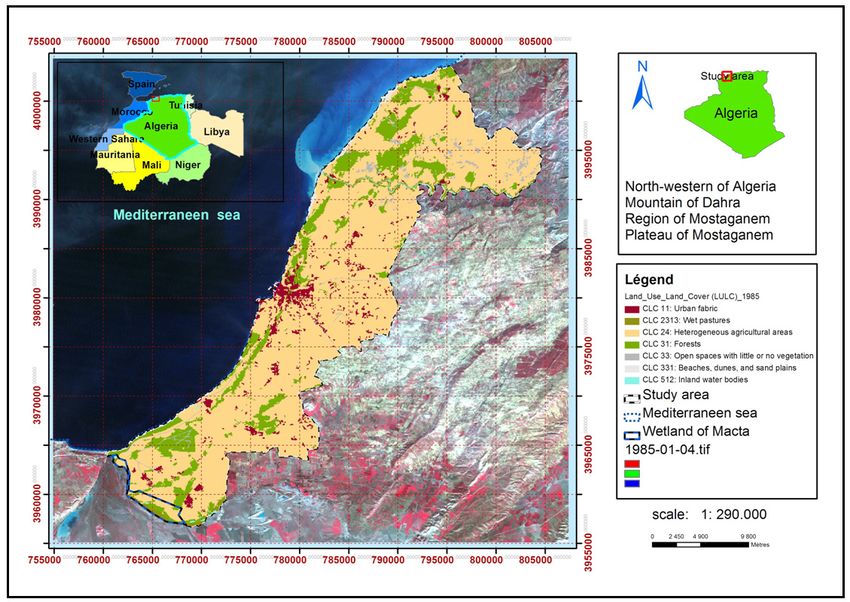
Ekológia (Bratislava) 2021: 40(3): 230–239

larly those in the municipality of Sidi Belaatar. From the DTM         Table 2. List of satellite imagery used in this study.
30-m resolution, a slope map is established, characterised by
grades of slopes that vary between 0 and 90%; the 25% class dom-        1985 Period maps       1995 Period maps          2015 Period maps
inates the study area. The south and southwest exposures domi-          1-1985-01-04.tif       4-1995-07-27.tif          9-2010-06-18.tif
nate. The hydrographic system consists of a set of wadi, which are      2-1987-03-31.tif       5-1995-08-12.tif          10-2010-08-05.tif
all oriented to the north to dump in the Mediterranean Sea. The         3-1990-11-18.tif       6-1997-02-06.tif          11-2014-07-31.tif
network is classified in to six orders. Among the big wadis, men-                              7-2003-05-22 .tif         12-2014-12-22.tif
tion should be made of the permanent wadi of Cheliff, the largest                              8-2007-05-09.tif          13-2015-02-08.tif
in Algeria which constitutes the common boundaries between                                                               14-2015-08-03.tif
Mostaganem, Abdelmalek Ramdane, Ain Boudinar and Sidi Be-
laatar. The permanent water of this wadi revitalises the lands and
the grounds of proximity by its use in agriculture. The study area
is served by a system of important access roads. It is composed of     ing data from Landsat satellite images with a resolution of 30 m
national road, railways and agroforestry tracks.                       (Robert, 2016) (Table 2).
                                                                            The Global Positioning Satellite (GPS) tool was used to locate
Image processing                                                       field samples. To classify the thematic objects present in the area,
                                                                       CLC classification was used. The latter is a standard European
The aim of the study is to assess the land cover and land use          typology based on the classification of Corine and Ramsar. It
changes along the coastline of Mostaganem in the last three dec-       is modified and developed according to the requirement of the
ades. To allow us to realise our aim of conducting a spatiotem-        Mediterranean basin. It describes the occupancy and land cover
poral study over a period of 30 years of land use we used the          units present in the Mediterranean (Beltrame et al., 2014; Weise
optical data of the American Landsat satellite because it provides     et al., 2012). The chosen method is based on the segmentation
satellite images that cover the desired time period (1985–2015).       and supervised automatic classification of the processed images
This satellite is characterised by a good temporal and spatial reso-   focused on a segmentation of the scenes with an average toler-
lution. Images are acquired during the period by the Thematic          ance of 10, in order to obtain segments or simply forms of the-
Mapper (TM) sensor ‘30m’ Enhanced Thematic Mapper (ETM)                matic objects of average sizes. To assign the shape segments, we
‘28.5 m’ having almost the same spatial resolution (30 m).To save      used multisource data (management documents, cartography,
the computing time and storage space for the optical disk data,        Google Earth images, studies and field observations).
we have cut raw satellite images using the ArcGIS10.0 software
according to the size of the study area. To format the scenes, we      Results
performed a geometric and radiometric correction on the im-
ages. For this, we used the techniques of coregistration and ra-       Three different satellite images were used to analyse the dynam-
diometric correction of the thumbnails. This technique allowed         ics of the occupation of the studied space (winter 1985, 1995 and
us to render all the images on the same place (superimposable          2015) (Fig. 3).
pixels) and the radiometric values on the same level (usable pix-          The analysis identified seven thematic object classes for the
els). To delimit the study area through a GIS, an operation of         study area, which are described and coded as follows :agricul-
crossing information layers using the Comgeo digital file avail-       tural training (CLC24), forestry formations (CLC31), natural wet
able in Shapefile (Shp) format was used.                               meadows (CLC2313), water chart (CLC512), dunes-sands and
                                                                       beaches (CLC331), open space with or without little vegetation
Classification of units of land use                                    (CLC33), artificial milestones or urbanized areas (CLC11).

This study proves that integration of GIS and remote sensing           Spatiotemporal occupation and land cover at different
technologies is an effective tool for urban planning and manage-       dates
ment (Mallupattu, Reddy, 2013; Duraisamy et al., 2018).To carry
out the spatiotemporal study of land use over a 30-year period,        In the year 1985, the supervised classification enabled us to draw
Corine Land Cover (CLC) nomenclature was used by exploit-              a distribution map of the units of occupation and land cover for

Table 3. Dynamics of land occupation in the study area (in ha).

 Units of occupation and land cover             1985(ha)                1995(ha)                  2015(ha)                      Gap(ha)
 Agricultural training                           42 356                  39 570                    38 301                        -4055
 Forestery formations                             8 207                   9 196                     9 298                         1091
 Natural wetmeadows                                794                     781                       425                          -369
 Water chart                                       246                     264                       462                           216
 Dunes , sands and beaches                         394                     237                       381                           -13
 Unproductive land                                 900                    2 084                     1 589                          689
 Artificial milestones
                                                  2 604                   3 672                      5 049                       2245
 (Urbanised area)

                                                                                                                                          233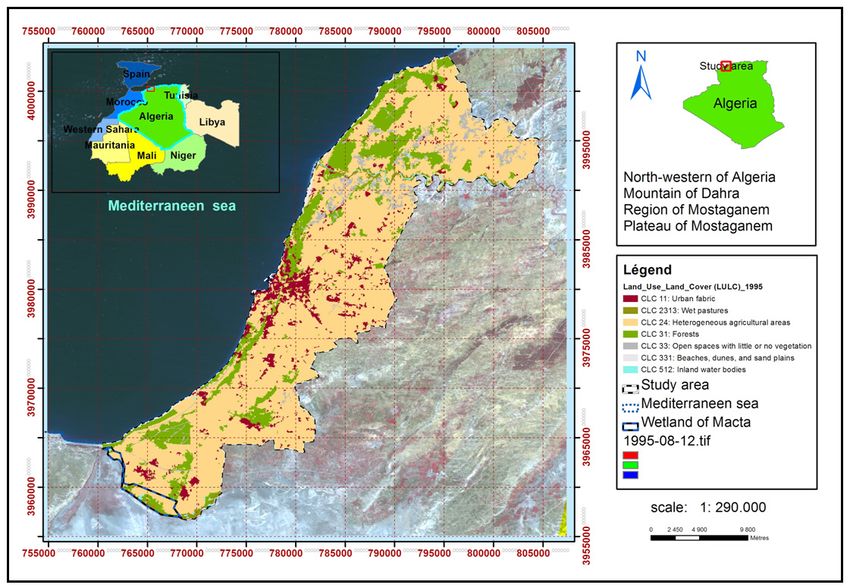
Ekológia (Bratislava) 2021: 40(3): 230–239

                                                                     the study area (Fig. 4), where the seven thematic categories were
                                                                     present. Plant formations covered 92% of the area, urbanisa-
                                                                     tion was only 4.7% and unoccupied areas covered the remaining
                                                                     2.3%. In the year 1995, plant formations covered 88% of the total
                                                                     area and urbanisation and unexploited land accounted for 6.6
                                                                     and 4.2%, respectively (Fig. 5). During the period 2015, plant
                                                                     formations covered 85%, urbanisation 9% and unexploited areas
                                                                     accounted for 3.7% (Fig. 6).

                                                                     Analysis of results

                                                                     The most urbanisation-threatened natural areas represent 73.5%
                                                                     of the total area, that is, an average annual loss of more than 146
                                                                     ha. Spaces that have increased are urban spaces; the unexploited
                                                                     spaces are also destined for urbanisation and have increased by
                                                                     689 ha or a total of 3134 ha, which represents 5.6% of the total
                                                                     area. Thus, the average annual growth rate of urban space is of
                                                                     the order of more than 104 ha (Table 3).
                                                           A
                                                                     Spaces having increased

                                                                     It is the urban space that has experienced the greatest increase
                                                                     compared to other spaces, mainly at the expense of agricultural
                                                                     land and coastal landscapes (dunes) (Table 4).
                                                                          The municipalities with the highest rate of urbanisation
                                                                     are Mostaganem, Kheir Eddine, Sayada, Hassi Maméche and
                                                                     Mezghrane, totalling more than 1823 ha or more than 74%, giv-
                                                                     en their proximity to the coast (Table 4, Fig. 7).

                                                                     Spaces experiencing regression

                                                                     The agricultural areas that occupy the flat lands and areas near
                                                                     the sea have been most heavily urbanised as shown in Table 5.
                                                                     Natural meadows have also declined and the situation is sum-
                                                                     marised in Table 6.

                                                           B         Summary of observations

                                                                     As shown in Table 7, it is the urban space that is experiencing the
                                                                     greatest growth; this increase has happened to the detriment of
                                                                     the agricultural area which is characterised by sandy-clay soils
                                                                     near the sea that are very popular for market gardening,

                                                                     Discussion

                                                                     Analysis of the spatiotemporal data of the extent of artificialisa-
                                                                     tion shows that the urbanised surfaces since 1985 have expe-
                                                                     rienced extensions. The largest were located at the chief towns
                                                                     of Mostaganem (672 ha), Kheir Eddine (360 ha), Sayada (356
                                                                     ha), Hassi Maméche (222 ha), Mezghrane (213 ha), Abdelmalek
                                                                     Ramdane (166 ha) and Fornaka (118 ha). The extension of ur-
                                                                     banised areas in 30 years has been estimated as 4% of the total
                                                                     area. The artificial areas were previously occupied by agriculture
                                                                     (3%) and forest formations (1%). Elaboration of classification
                                                                     of the different areas covered by the seven land cover categories
                                                           C         makes it possible to better understand and analyse the dynam-
                                                                     ics of land occupation from 1985 to 2015.Statistical analysis of
 Fig. 3. Landsat TM satellite image extract of study area in three   data shows that these areas have undergone a change in their use,
 dates. (A:1985 , B:1995 , C:2015 )                                  since the areas of vegetation formation (agriculture + forestry)

234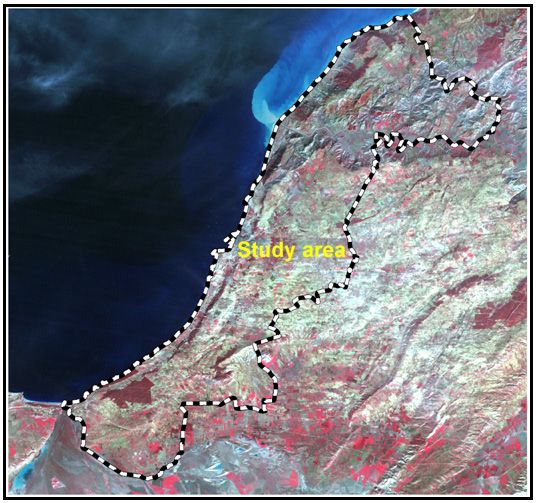
Ekológia (Bratislava) 2021: 40(3): 230–239

Fig. 4. Map of occupation and land cover (period 1995).

Fig. 5. Map of occupation and land cover (period 1995).

                                                                                           235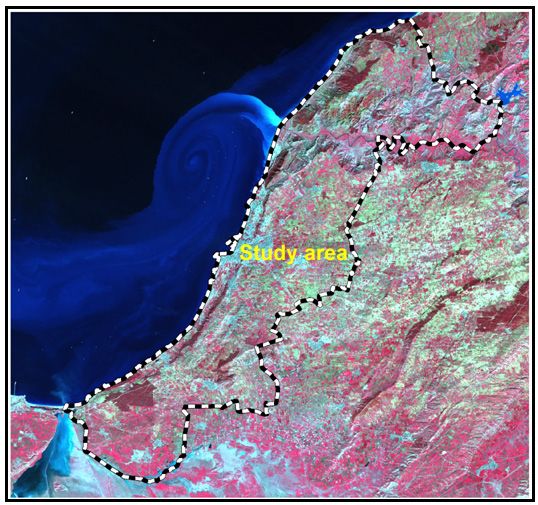
Ekológia (Bratislava) 2021: 40(3): 230–239

                                        Fig. 6. Map of occupation and land cover (period 2015).

Table 4. Dynamics and evolution of urban space in the study area (in ha).

 Municipalities                    1985 (ha)          1995(ha)              2015(ha)       1985 to 2015 gap (ha)           Rate (%)
 Mostaganem                          749                1 008                 1 421                 672                      27.5
 Kheir Eddine                        324                 426                   684                  360                     14.72
 Sayada                              267                 449                   623                  356                     14.56
 Hassi Mameche                       233                 294                   455                  222                      9.08
 Mezaghrane                          183                 364                   396                  213                      8.71
 Abdelmalek Ramdane                  170                 217                   336                  166                      6.79
 Fornaka                             252                 361                   370                  118                      4.82
 Ain Nouissi                         150                 202                   251                  101                      4.13
 Stidia                              133                 144                   214                  81                       3.31
 Sidi Belattar                        73                 106                   161                  88                       3.60

have experienced a loss of 3310 ha, that is, an average annual         soils of strong agronomic potential mainly for market garden-
loss of 110 ha. The urbanised areas initially estimated at 2604 ha     ing, vineyards and arboriculture. Global patterns of urbanisation
in 1985 occupied an area of 5049 ha in 2015, an estimated dif-         have had significant implications for biodiversity. Habitat con-
ference of 2445 ha and an average annual extension of 81.5 ha.         version driven by urbanisation will be important in the future
The area occupied by water surfaces initially estimated at 246 ha      in coastal systems as well as biomes that are disproportionately
in 1985 covered 462 ha in 2015, an increase of 216 ha induced          urbanised (McDonald et al., 2013). Coastal protection in the
by the Macta natural reserve or an average annual increase of          Mostaganem region and its great biodiversity (Yahi et al., 2012;
7.2 ha. The predominantly agricultural region of Mostaganem is         Vela et al., 2016) depend on the analysis of land use dynamics.
turning back under the effect of the urbanisation policy towards       Actions in support of ecosystem services should be considered
a touristic and metropolitan vocation. During the three decades        in planning and management plans (Xu et al., 2016). Accord-
of study, the pressure of urbanisation remains the strongest and       ing to the results obtained, the spatiotemporal difference in total
is imposed by demographic explosion. Thus, it is the agricul-          area per land use category gives an indication of the amount of
tural area which remains the most threatened, while it contains        land that is undergoing change from year to year. As mentioned

236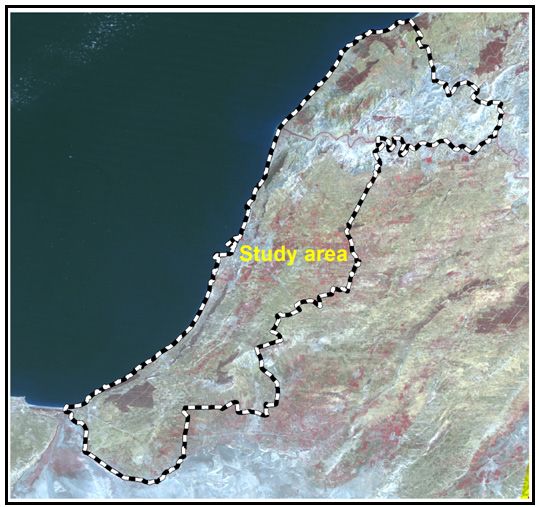
Ekológia (Bratislava) 2021: 40(3): 230–239

                                Fig. 7. Urban dynamics during the periods 1985, 1995 and 2015.

Table 5. Dynamics of agricultural space in the eleven municipalities.

 Municipalities                         1985 (ha)          1995 (ha)        2015 (ha)       1985-2015 Gap (ha)         Rate (%)
 Mostagnem                                2306               1483             1126                -1180                 -29.12
 Kheir Eddine                             4310               4207             3920                 -390                  -9.62
 Sayada                                   4042               3879             3686                 -356                  -8.78
 Fornaka                                  4676               4794             4657                  -19                  -0.46
 Hassi Mameche                            5281               5212             4972                 -309                  -7.62
 Mezaghrane                               1209               1019             1009                 -200                  -4.93
 Abdelmalek Ramdane                       5242               4652             4556                 -686                 -16.93
 Ain Nouissi                              2571               2470             2411                 -160                  -3.94
 Stidia                                   3460               3402             3376                  -84                  -2.07
 Sidi Belattar                            5998               5627             5520                 -478                 -11.79
 Ain Boudinar                             3124               2732             2935                 -189                  -4.66

Table 6. Dynamics of natural medows (area in ha).

 Municipalities                         1985(ha)            1995(ha)         2015(ha)               Gap                 Rate (%)
 Mostaganem                                30                  46               12                  -18                   4.83
 Kheir Eddine
 Sayada
 Fornaka                                   286                313               251                 -53                   14.24
 Hassi Mameche
 Mezaghrane
 Abdelmalek Ramdane                         45                 36               28                  -17                   4.56
 Ain Nouissi
 Stidia
 Sidi Belattar                             286                216                75                 -211                  56.72
 Ain Boudinar                              109                144                36                  -73                  19.62
 Total                                     756                755               402                 372

                                                                                                                                   237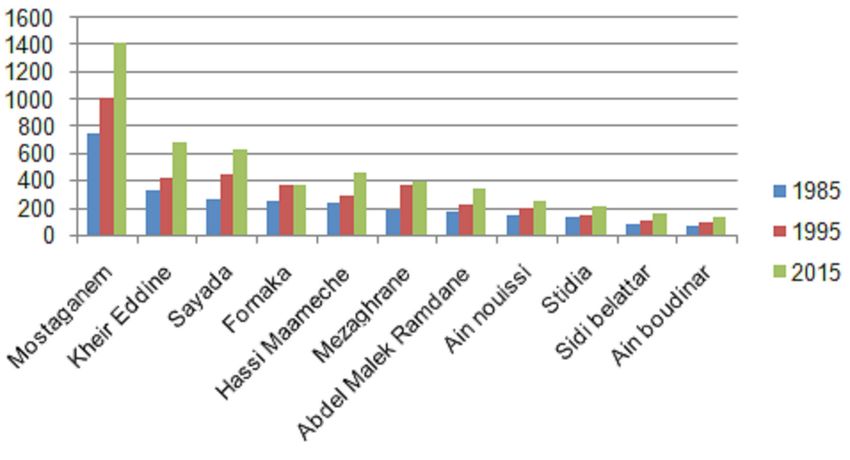
Ekológia (Bratislava) 2021: 40(3): 230–239

Table 7. Evolution of units of land use between 1985 and 2015 in the study area.

 Categories                                 Period 1985                        Period 1995                       Period 2015                  Gap
                                     Surface ha        Rate %            Surface ha      Rate %             Surface ha     Rate %
 Plant formations                      51 334            92                49 547          89                 48 024         86.5              -5.5
 Water bodies                           246             0.40                264            0.5                  462           0.8              0.4
 Unproductive land                      1317            2.30                2321            4                  1970           3.5              1.2
 Artificial milestones                  2604            4.70                3672           6.6                 5049            9               4.3

previously, the estimated quantity and characterisation of change        help in achieving the aim. This leads to the preservation of soils,
is dependent on spatial scale. It is related to many factors including   ecosystems and natural landscapes and safeguarding of the plant
soil type (Daoudi, Sitayeb, 2020), climate, topography, urbanisa-        heritage (Berezowska-Azzag, 2013). Unfortunately, these elements
tion and demographic pressure (Tomlinson et al., 2018; Rabehi            are not really taken into account despite the existence of legisla-
et al., 2018, 2019b). Application of satellite imaging methods has       tion; it is the land crisis that prevails. One of our aims is to pro-
resulted in digital map products that are reproducible, consistent       vide support for the principals strategies and tools belonging to
and up-to-date. The maps developed are compiled based on geo-            sustainable land cover, land use planning and management by the
graphical and alphanumeric data. Analysis of the results obtained        thematic typology identified in this process. The proximity of the
shows that the soils of the zone have undergone a great change           study area to the Mediterranean Sea, its geographical position and
in their land use. Agricultural and forest ecosystems have been          its adaptive relief to all occupation units and land covers make it a
strongly impacted by the change; it has caused a loss of 5% of the       highly diversified area. The ecological inventory is reflected in the
total area. The converted areas are currently occupied by artifi-        existence of different types of soils, highly diversified forests, plains
cial spaces and unproductive soils which cover 4% and 1% of the          ,wetlands classified as a Ramsar site such as Macta wetlands and
total study area, respectively. The predominant negative trend in        key biodiversity areas (KBAs) Dahra mountains , habitats with
the Land use and land cover classes can also be attributed to the        plant biodiversity that we must preserve. In the coastal areas, KBAs
expansion. The primary cause of these losses is the expansion of         are mainly threatened by urbanisation, excessive tourism pres-
urban development (Awuh et al., 2018; Elmqvist et al., 2010).            sure and pollution, fire and overgrazing (Benhouhou et al., 2018;
                                                                         Menoueret al., 2017), as in other cities of Algeria. Reconciliation
                                                                         between economic and social development (Khelil et al., 2019;
Conclusion
                                                                         Boubekri et al., 2018), spatial planning, ecotourism(Bernard et al.,
                                                                         2016) and protection of natural resources are the key to sustainable
The overall evolution of the different types of land use is sum-
                                                                         development of the Algerian coastline.
marised by a regression of the space occupied by plant formations
by 5.5%, which is an increase of 1.2% of the unproductive space
and 4.3% of the artificialised space. The study of the dynamics of       References
land use in the Mostaganem region reveals a trend which is na-
                                                                         Aguejdad, A., Houet, T. & Hubert-Moy L. (2017). Spatial validation of land
tional, showing diversion of agricultural land with high agronom-             use change models Using multiple assessment techniques: A case study
ic potential towards urbanisation. This phenomenon has already                of transition potential models. Environmental Modeling Assessment, 22,
been underlined by Bendjaballah Boudemagh in 2013, who es-                    591‒606. DOI: 10.1007/s10666-017-9564-4.
timated that in Algeria, 162,000 ha of farmland have been urban-         ANAT, National Agency for Spatial Planning (1997). Planner planning and ur-
ised for more than 50 years. Despite the existence of legislation for         ban planning of Mostaganem.
                                                                         ANAT, National Agency for Spatial Planning (2006). Revision of the master
protecting it, the coastal area remains the prey of urban planning.           plan of planning and urban planning of the Mostaganem group Sayada-
During the last 30 years (1985–2015), landscapes of the 11studied             Mazagran.
municipalities have undergone a change in their assignments and          Awuh, M.E., Officha, M.A., Okolie, A.O. & EneteI C. (2018). Land-use/land-
the most impacted municipalities are Mostaganem, Sidi Belaatar,               cover dynamics in Calabar metropolis using a combined approach of re-
Kheir Eddine, Sayada, Hassi Maméche, Mezghrane, Abdelmalek                    mote sensing and GIS. Journal of Geographic Information System, 10(4),
                                                                              398‒414. DOI: 10.4236/jgis.2018.104021.
Ramdane and Fornaka. The impact of the change is translated on           Beltrame, C., Guelmami, A. & Perennou C. (2015). Trends in land cover
the ground by the conversion of surfaces of vegetal formations                change in coastal wetland around the mediterranean basin. Survey find-
into artificial and unproductive surfaces. Converted surfaces cover           ings from 1975 to 2005. Journal of Mediterranean Geography, 125, 97‒111.
6% of the total area of all municipalities. It should be noted that           DOI: 10.4000/mediterranee.8046.
in terms of management and protection of the coast in Algeria,           Bendjaballah Boudemagh, O. (2013). Urban policies, agriculture and land mar-
                                                                              ket: What future for periurban agriculture in Constantine? Algeria. Cahier
much remains to be done. It turns out that the littoral law encoun-           Agricole, 22(6), 544‒551. DOI: 10.1684/ag.0670.
ters serious implementation difficulties (Kacemi, 2011). Even if         Benhouhou, S., Yahi, N. & Vela E. (2018). Key Biodiversity Areas (KBAs) for
the forest area shows a slight increase, our results show that the            plants in the Mediterranean region. Chp 3 Algérie. In M. Valderrabano, T.
state of degradation is quite advanced since more than 85% of                 Gil, V. Heywood & B. De Montmollin (Eds.), Conserving wild plants in the
these ecosystems are degraded low formations (based mainly on                 south and east Mediterranean region (p. 161). Gland, Málaga: IUCN. DOI:
                                                                              10.2305/IUCN.CH.2018.21.en.
bushy species). Application of the principles of sustainable devel-      Berezowska-Azzag, E. (2013). Intelligence urbaine au-delà d’une planification.
opment, whose objectives are to maintain balance between urban                Courrier du Savoir, 16, 55‒63. http://revues.univ-biskra.dz/index.php/cds/
development and preservation of agricultural and forest lands, will           article/view/387

238
Ekológia (Bratislava) 2021: 40(3): 230–239
entific World Journal, ID 268623. DOI: 10.1155/2013/268623.
Bernard, S., Roche, Y. & Sarrasin B. (2016). Écotourisme, aires protégées et ex- McDonald, R., Marcotullio, P.J. & Güneralp B. (2013).Urbanization and global
pansion agricole: Quelle place pour les systèmes socio-écologiques locaux? trends in biodiversity and ecosystem services. In T. Elmqvist, M.J. Fragkias,
Canadian Journal of Development Studies, 37(4), 422‒445. DOI: 10.1080/02 J. Goodness, B.P. Güneralp, J. Marcotullio, R.I. McDonald, S. Parnell, M.
255189.2016.1202813. Schewenius, M. Sendstad,M. & C. Wilkinson (Eds.), Urbanization, biodi�
Boubekri, I., Caveen, A., Djebar, A., Amara, R. & Mazurek H. (2018). Structure versity and ecosystem services: challenges and opportunities. A global assess�
and spatio-temporal dynamics of the artisanal small-scale fisheries at the ment (pp. 31‒52). Netherlands: Springer. DOI: 10.1007/978-94-007-7088-
future MPA of “Taza” (Algerian coast, SW Mediterranean). Mediterranean 1_3.
Marine Science, 19(3), 555‒571. DOI: 10.12681/mms.16192. Menouer, O., Sahah Zerouala, M. & Dahmen A. (2017). The « Fahs »:A challenge
Boudjenouia, A., Fleury, A. & Tacherift A. (2008). Suburban agriculture in Setif for coastal tourism requalification in Algiers? Etudes Caribéennes, 36. DOI:
(Algeria): Which future in face of urban growth? Biotechnologie, Agronomie, 10.4000/etudescaribeennes.10829.
Société et Environnement, 12(1), 23‒30. http://popups.ulg.ac.be/1780-4507/ Otmani, H., Belkessa, R., Rabehi, W., Guerfi, M. & Boukhdiche W. (2019). Dégra-
index.php?id=2128. dation des dunes côtières algéroises entre pression de l’urbanisation et con-
Daoudi, K. & Sitayeb T.(2020). Effects of land use changes on the soil physico- séquences sur l’évolution de la ligne de rivage. Geo-Eco-Marina, 25, 131‒145.
chemical properties in south-western Algeria. Ekológia (Bratislava), 39(3), DOI: 10.5281/zenodo.3609777.
224–235. DOI: 10.2478/eko-2020-0017. Paegelow, M., Camacho Olmedo, M.T., Mas, J.F. & Houet T. (2014). Benchmark-
Dirassat (2008). Schéma directeur d’aménagement de l’aire métropolitaine d’Oran. ing of LUCC modelling tools by various validation techniques and error
Studyoffice mission report. analysis. Cybergeo, 701. DOI: 10.4000/cybergeo.26610.
Duraisamy, V., Bendapudi, R. & Jadhav A. (2018). Identifying hotspots in land Patra, S. & Shukla J. (2017). Assessment on physical and anthropogenicactivities
use land cover change and the drivers in a semi-aridregion of India. Environ. and its impact on coastal sand dunes, West Bengal. Journal of Geography,
Monit.Assess., 190(9), 535. DOI: 10.1007/s10661- 018-6919-5. Environment and Earth Science International, 11(3), 1‒8. DOI: 10.9734/
Elmqvist, T., Fragkias, M.J., Goodness, J., Güneralp, B.P., Marcotullio, J., McDon- JGEESI/2017/35657.
ald, R.I., Parnell, S., Schewenius, M., Sendstad, M. & Wilkinson C. (Eds.) Piano, E., De Wolf, K., Bona, F., Bonte, D., Bowler, D.E., Isaia, M., Lens, L., Mer-
(2013). Urbanization, biodiversity and ecosystem services: Challenges and op� ckx, T., Mertens, D., Van Kerckvoorde, M., De Meester, L. & Hendrickx F.
portunities. A global assessment. Netherlands: Springer. DOI: 10.1007/978- (2017). Urbanization drives community shifts towards thermophilic and
94-007-7088-1. dispersive species at local and landscape scales. Glob.Change Biol., 23, 2554–
Ghodbani, T. & Berrahi-Midoun F. (2013). Littoralization in western Algeria: 2564.DOI: 10.1111/gcb.13606.
Multiscalar approaches to interactions men areas-ecosystem. Space Popula� Qiang, Y. & Lam S.N. (2015). Modeling land use and land cover changes in a
tions Societies, 1‒2, 231‒243. http://journals.openedition.org/eps/5488 vulnerable Coastal region using artificial neural networks and cellular au-
Ghodbani, T., Kansab, O. & Kouti A.(2016). Development of tourism in Alge- tomata. Environment Monitoring and Assessment, 187, 57. DOI: 10.1007/
ria facing the issue of coastal areas protection. The Mostaganem coast case s10661-015-4298-8.
study. Etudes Caribéennes, 33‒34. DOI: 10.4000/etudes caribeennes.9305. Rabehi,W., Guerfi, M. & Mahi H. (2018). Mapping the vulnerability of the Bay of
Ghodbani, T., Milewski, A. & Bellal S. (2015). The wetlands of the Terga area, a Algiers a socio-economic and physical approach to understanding the coast.
vulnerable coastalecosystem in the southern Mediterranean (western Alge- Méditerranée, 19. http://journals.openedition.org/mediterranee/8625.
ria). Méditerranée, 125, 153‒164. DOI: 10.4000/mediterranee.8104. Rabehi,W., Guerfi, M. & Mahi H. (2019a). La baie d’Alger, un espace côtier prisé,
Ghodbani, T. & Semmoud B. (2010). Coastal urbanization in Algeria, processes entre pressions d’urbanisation et gouvernance territoriale. Geo-Eco-Marina,
and environment impacts: The case of the bay Aïn el Turck. Etudes Caribée� 25, 113‒130. DOI: 10.5281/zenodo.3609744.
nnes, 4431. http://journals.openedition.org/étudescaribéennes/4431. Rabehi, W., Guerfi, M., Mahi, H. & Rojas-Garcia E. (2019b). Spatiotemporal
Gounaridis, D., Apostolou, A. & Koukoulas S. (2016). Land cover of Greece, monitoring of Coastal urbanization dynamics: Case study of Algiers’ Bay,
2010: a semi-automatedclassification using random Forests. Journal of Maps, Algeria. Journal of the Indian Society of Remote Sensing, 47, 1917‒1936. DOI:
12(5), 1055–1062. DOI: 10.1080/17445647.2015.1123656. 10.1007/s12524-019-01037.
Güngöroğlu, C., Kavgac, A., Coşgun, U., Çalıkoğlu, M., Örtel, E. & Balpınar N.
Robert, S. (2016). Between urban sprawl and densification: An accurate ap-
(2017). Applicability of European landscape typology in Turkey (Çakırlar
proach of coastal urbanization in Provence. Cybergeo, 764. DOI: 10.4000/
Watershed case/Antalya). Landscape Research, 43(6), 831‒845. DOI:
cybergeo.27451.
10.1080/01426397.2017.1386776.
Semmoud, B. & Ladhem A. (2015). Periurban agriculture faced with agrarian
Hasse, J.E. & Lathrop R.G. (2003). Land resource impact indicators of urban
vulnerabilities in Algeria. Territoire en Mouvement, Revue de Géographie et
sprawl. Applied Geography, 23, 159‒175.DOI: 10.1016/j.apgeog.2003.08.002.
Aménagement, 25‒26. DOI: 10.4000/tem.2845.
Houet, T., Verburg, P.H. &Loveland T.R. (2010). Monitoring and modeling
Sharma, R., Nehren, U., Rahman, S.A., Meyer, M., Rimal, B., Seta, G. & Baral
landscape dynamics. Landsc. Ecol., 25, 163–167. DOI: 10.1007/s10980-009-
H.(2018). Modeling land use and land cover changes and their effects on
9417-x.
biodiversity in central Kalimantan, Indonesia. Land, 7, 57. DOI: 10.3390/
Journal Officiel de la République Algérienne (2002). Lois n° 02-02 du 5 février
2002 relative à la protection et à la valorisation du littoral (pp.18‒22). land 7020057.
Kacemi, M. (2011). Protection and development of the coastal areas in Algeria: Tomlinson, U., Dragosits, P., Levy, E., Thomson, A.M. & Moxley J. (2018). Quan-
Legislation and instruments. The case of Oran’s coastal areas. Etudes Car� tifying gross vs. net agricultural land use change in Great Britain using the
ibéennes, 20, 5959. DOI: 10.4000/etudescaribeennes.5959. integrated administration and control system. Sci. Total Environ., 628–629,
Khelil, N., Larid, M., Grimes, S., Le Berre, I. &Peuziat I. (2019).Challenges and 1234–1248. DOI: 10.1016/j.scitotenv.2018.02.067.
opportunities in Promoting integrated coastal zone management in Alge- Vela, E. (2017). From the biodiversity inventory to conservation priorities in the
ria: Demonstration from the Algiers coast. Ocean and Coastal Management, Mediterranean basin hotspot: can wefill knowledge gaps? Thesis presented for
168, 185‒196. DOI: 10.1016/j.ocecoaman.2018.11.001. the diploma of accreditation to direct research, University of Montpellier,
Lagabrielle, E., Metzger, P., Martignac, C., Lortic, B. & Durieux L. (2007). Land France.
use trends on ReunionIsland (1989-2002). M@ppemonde, 86. http://mappe- Weise, K., Wolf, B., Fitoka, E., Van Valkengoed, E., Bonino, E., Hansen, H. &
monde.mgm.fr/num14/ articles/art 07205. Paganini M. (2012). Glob wetland II. A regional pilot project of the Ramsar
Lestrelin, G., Augusseau, X., David, D., Bourgoin, J., Lagabrielle, E. & Lo Seen convention on wetlands. Symposium Panel ESRIN. Frascati, Italy, 23-27 Feb.
D. (2017).Collaborative landscape research in reunion sland: Using spatial 2012.
modelling and simulation to support territorial foresight and urban plan- Xu, Q.R., Yang, Y.X., Dong, Y.X., Liu, L. & Run Q. (2016). The influence of rapid
ning. Applied Geography, 78, 66‒77. DOI: 10.1016/j.apgeog.11.003. urbanization and land use changes on terrestrial carbon sources/sinks in
Li, Y., Zhang, X., Zhao, X., Cao, S.M. & Cao H. (2016). Assessing spatial vulner- Guangzhou, China. Ecological Indicators, 70, 304–316.DOI: 10.1016/j.ec-
ability from rapid urbanization to inform coastal urban regional planning. olind.2016.05.052.
Ocean and Coastal Management, 123, 53‒65. DOI: 10.16/J.ocecoaman.2016. Yahi, N., Vela, E., Benhouhou, S., De Belair, G. & Gharzouli, R. (2012). Identify-
01.010. ing important plants areas (Key biodiversity areas for plants) in northern
Mallupattu, K.P. & Reddy J.S. (2013). Analysis of land use/land cover changes Algeria. Journal of Threatened Taxa, 4(8), 2753–2765. DOI: 10.11609/JoTT.
using remote sensingdata and GIS at an urban area, Tirupati, India. The Sci� o2998.2753-65.
239You can also read