Challenges and Opportunities for Conservation, Agricultural Production, and Social Inclusion in the Cerrado Biome
←
→
Page content transcription
If your browser does not render page correctly, please read the page content below
Challenges and Opportunities for Conservation, Agricultural
Production, and Social Inclusion in the Cerrado Biome

Technical Annex: The Agriculture Sector, Agriculture Supply
                 Chains, and Transportation Infrastructure
August 2016

This technical annex accompanies the “Challenges and Opportunities for Conservation, Agricultural Production, and Social
Inclusion in the Cerrado Biome” report, developed for the Climate and Land Use Alliance by CEA Consulting.
The full report and associated materials can be found at: www.climateandlandusealliance.org/reports/cerrado/
                                                               v
Table of Contents

Introduction                             3
Overview of agriculture in Brazil        6
Overview of agriculture in the Cerrado   12
Agriculture in Matopiba                  16
Soy and the soy supply chain             27
The beef and milk supply chain           40
Pasture intensification                  55
Agricultural certifications              61
Transportation infrastructure            65

                                              2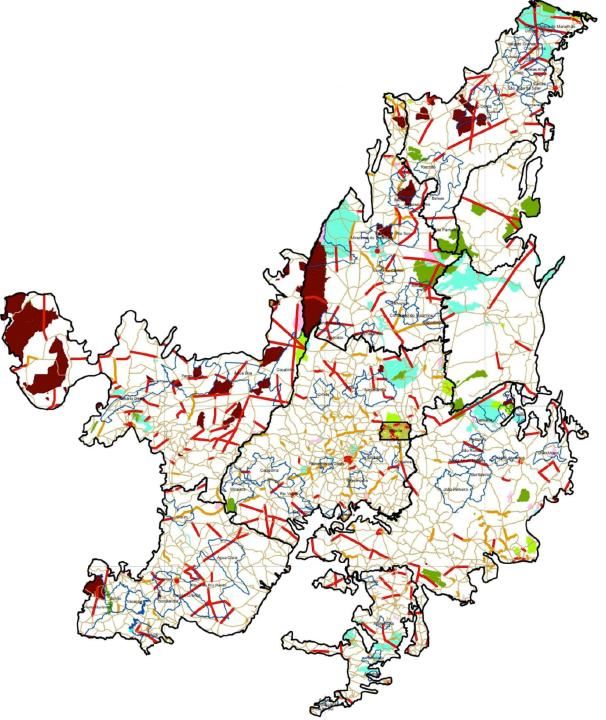
AGRICULTURE

This section was produced in partnership with AgroIcone

                                                                        3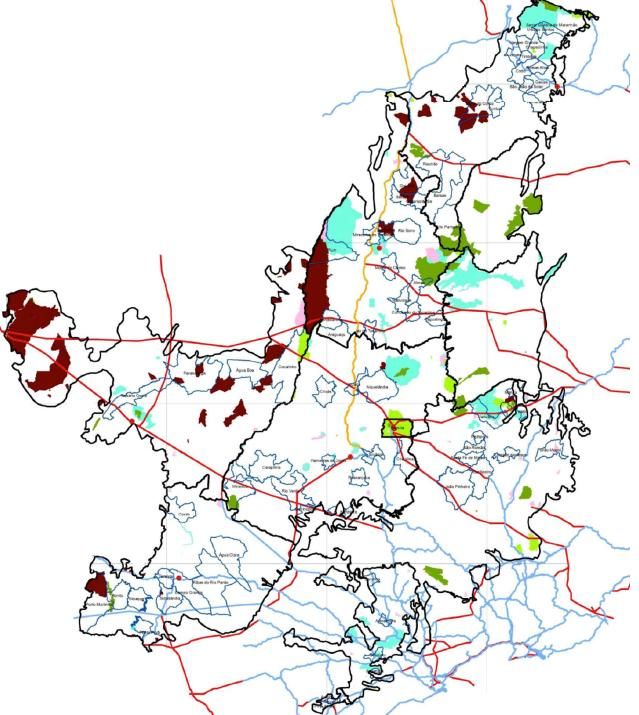
Agriculture in the Cerrado

Historical background and overview
• Beginning in the mid 1970s, agricultural production in the Cerrado expanded greatly – through
  a large scale national investment in agricultural research and development. Today, it is one of
  the most intensive and productive agricultural regions in the world.
• In the twenty years between 1991 and 2011, the value of Brazil’s agricultural exports increased
  ten-fold, from USD 7.9 billion to USD 81 billion.1 The Cerrado has been at the heart of this
  growth. Today, the biome accounts for about 40 percent of the total GDP from Brazil’s
  agricultural sector.2

Notes on this section:
•    Much of the agricultural data is provided by state rather than biome, so much of the information presented here is not perfectly aligned to
     the biome.
•    Comprehensive information on the agricultural sector is limited by the fact that the latest Agricultural Census was published in 2006 and
     there are no current plans for another census. As a result, a number of the charts in this chapter only provide data through 2006.

Sources: (1) FAOSTAT, 2015. (2) MMA, 2014.
                                                                                                                                                   4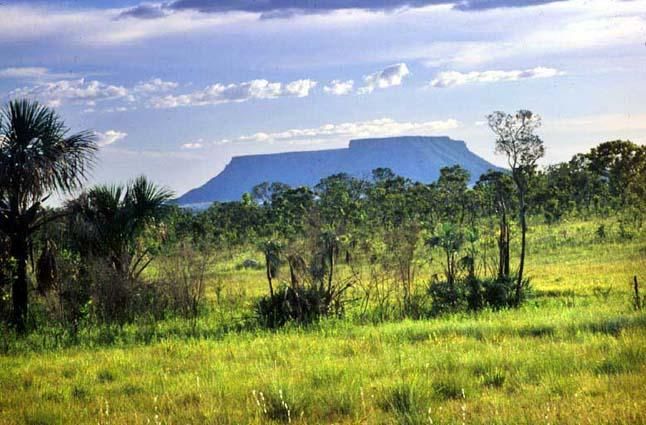
Agriculture in the Cerrado

Soy
• Soy production has grown at a rapid clip in the past few decades. Planted area has tripled
  since the mid 1990s and export value has quadrupled since 2006. Soy accounts for almost
  40% of Brazil’s agricultural exports, by value.1
• Of the Cerrado states, Mato Grosso has by far the most land area planted with soy, but
  Matopiba is growing in importance for soy production.2
Beef
• Brazil has the largest commercial cattle herd in the world and is the #2 producer and
  exporter of beef globally. However, the majority of Brazil’s beef is consumed domestically. 3
• The processing segments of the supply chain is highly concentrated for both soy and beef.
• The beef sector is not growing as quickly as the soy sector. Slower growth and a trend
  towards intensification could free up land for crop expansion onto former pasture lands.

Sources: Photos by CEA, from western Bahia. (1) MDIC, AgroIcone. (2) IBGE - Produção Agrícola Municipal, via AgroIcone. (3) USDA, 2015.
                                                                                                                                          5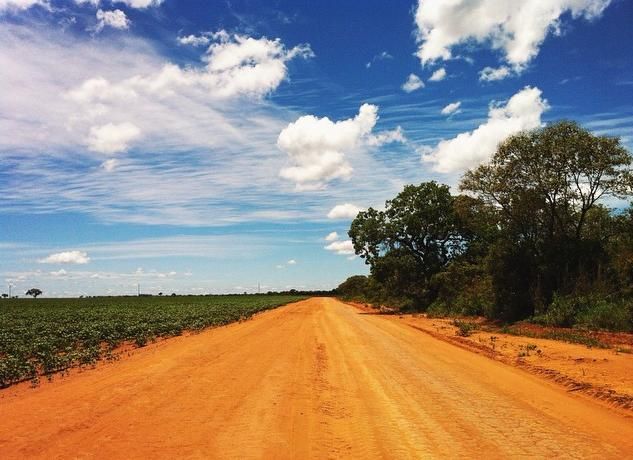
AGRICULTURE
OVERVIEW OF AGRICULTURE IN BRAZIL

                                    6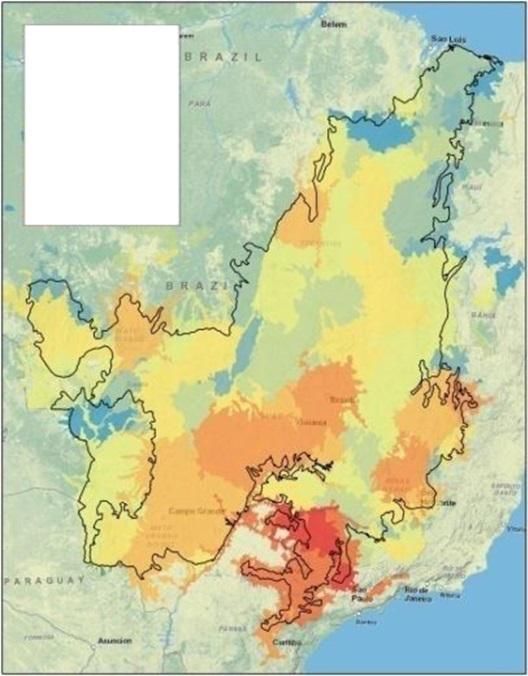
Brazil is a top global producer and exporter of agricultural
    commodities
                          Brazil’s agriculture, world share 2014/2015, %1
                0%                20%    40%               60%        80%         100%

                                                                         1
Orange juice
                                                                         1               • Brazil is important to world food
                                                                                           production.
                                                       1
       Sugar                                                                             • Brazil leads world production
                                                       1
                                                                                           and export of orange juice,
                                                   2                                       sugar, and coffee.
  Soybeans
                                                   2                                     • It is second for production and
                                               4                                           export of soybeans, producing
   Chickens
                                               1                                           30% of the world’s soybeans
                                           1                                               and accounting for almost 40%
      Coffee                                                         Indicates
                                           1                     x                         of global soybean exports.
                                                                     world rank
                                     2                                                   • Brazil is the world’s second top
         Beef                                                                              exporter of beef.
                                     2
                                    3
        Corn                                           Production
                                    2
                              5                        Exports
     Cotton
                              3
                              4
         Pork
                              4

    Source: Data from USDA.
                                                                                                                               7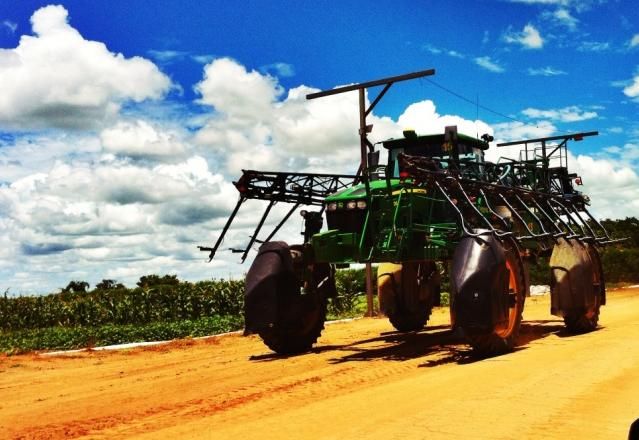
Agriculture exports account for over 40% of Brazil’s total exports by
              value
                                                                    Brazil’s trade balance
                300

                                  5 year increments                                              1-year increments

                                                                                                                                                      • Brazil has exported
                250
                                                                                                                                                        about $100 billion
                                                                                                                                                        USD worth of
                                                                                                                                                        agricultural
                200                                                                                                                                     commodities, on
                                                                                                                                                        an annual basis,
                                                                                                                                                        over the past few
US$ billion

                150                                                                                                                                     years, and
                                                                                                                                                        imported about
                                                                                                                                                        $30 billion.
                100                                                                                                                                   • Brazil’s total
                                                                                                                                                        exports are worth
                                                                                                                                                        about $230 billion
                 50                                                                                                                                     USD.
                                                                                                                                                      • The agriculture
                                                                                                                                                        sector is important
                   0                                                                                                                                    for maintaining
                           1990

                                      1995

                                                 2000

                                                            2005

                                                                      2006

                                                                                 2007

                                                                                          2008

                                                                                                   2009

                                                                                                           2010

                                                                                                                     2011

                                                                                                                              2012

                                                                                                                                      2013

                                                                                                                                               2014
                                                                                                                                                        Brazil’s trade
                                                                                                                                                        balance.
                                      Brazil Exp Total              Brazil Imp Total             Agribusiness Exp           Agribusiness Imp

              Source: Ministério da Agricultura. Chart and text adapted from AgroIcone.                                                                                       8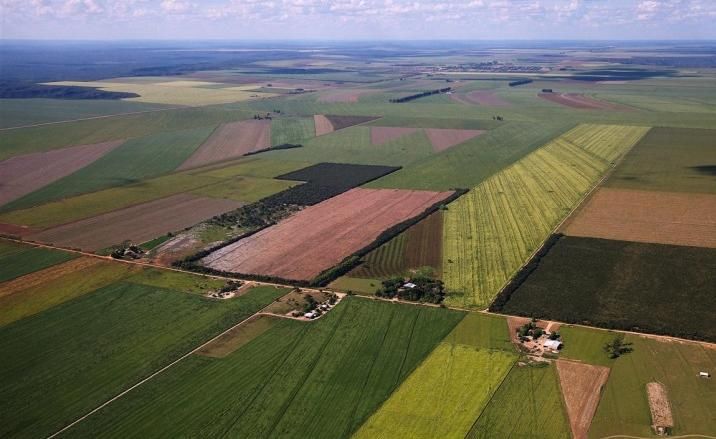
Agriculture is an important, but not leading, sector for foreign
investment

                           Foreign investment in Brazil
               $12                                                                                      Metallic mineral
                                                                                                        extraction

               $10                                                                                      Oil extraction and
                                                                                                                                     Brazil’s agriculture
                                                                                                        related services             sector averaged USD
                                                                                                                                     $350 million in foreign
               $8                                                                                       Agriculture, livestock and   investment per year
                                                                                                        services related to these    from 2007 to 2009,
                                                                                                        activities
                                                                                                                                     hitting almost USD
US $ Billion

                                                                                                        Activities of suport the     $500 million in 2008.
               $6
                                                                                                        mineral extracion
                                                                                                                                     However, it lags far
                                                                                                                                     behind mineral and oil
                                                                                                        Silviculture, Forest
               $4                                                                                       exploitation                 extraction.

                                                                                                        Non-metallic mineral
               $2                                                                                       extraction

                                                                                                        Fishing and acquaculture
               $0

                                                                                                        Coal extraction

Source: Bacen, http://www.bcb.gov.br/rex/ied/port/ingressos/htms/index1.asp?idpai=INVEDIR, via AgroIcone.
                                                                                                                                                               9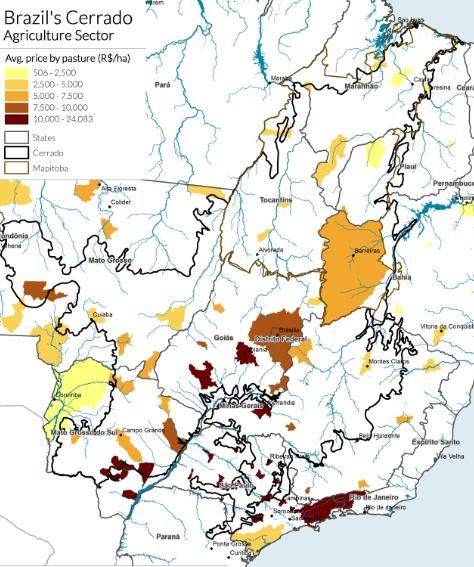
Soy and beef are the commodities most linked to deforestation,
especially in Matopiba
Soy export value - all of Brazil
35
30 Soy
• Soy production has grown
US $ Billions
25
at a rapid clip in the last
20
Soybean oil few decades. Planted
15 Soybean meal area has tripled since the
10 Soybean mid-1990s. Soy accounts
5 for almost 40% of Brazil’s
agricultural exports, by
0
value.
1997
1998
1999
2000
2001
2002
2003
2004
2005
2006
2007
2008
2009
2010
2011
2012
2013
2014
Beef export value - all of Brazil
8
7
6 Beef
Salted meat
US $ Billions
5
Casings
• Brazil has the largest
4 commercial cattle herd in
Offals
3 the world and is the #2
Processed meat
2
producer and exporter of
Fresh beef beef globally.
1
0
2006
1997
1998
1999
2000
2001
2002
2003
2004
2005
2007
2008
2009
2010
2011
2012
2013
2014
Source: MDIC, via AgroIcone. 10Pesticides, nutrient pollution, soil erosion, and genetic engineering are
significant concerns for Brazilian agriculture
• Pesticides are a major concern in the Cerrado because of the human and ecosystem health impact.
Brazil is now the world’s largest buyer of pesticides, and some pesticides that are outlawed in the
United States and/or Europe are still allowed in the Cerrado, with pesticide companies and users
arguing that the needs in the Cerrado’s tropical climate differ from those of more temperate regions.
However, cases such as an accidental crop-dusting of a school which sent 30 children and teachers to
the hospital have fueled a strong anti-pesticide movement.1
• Nutrient pollution from excess nitrogen and phosphorous from crop agriculture, is a growing concern
in the Cerrado. These nutrients can pollute surface and groundwater (aquifers) and causing algae
blooms that strangle aquatic ecosystems. Left unchecked, nitrogen pollution of drinking water sources
can lead to major health effects such as “blue baby syndrome.”2
• Soil erosion impacts the long-term productivity of crops and pastures. Unchecked overgrazing in
particular can cause erosion, compaction, and destruction, especially in sensitive riparian areas. Soil
erosion also leads to significant carbon loss in the Cerrado.
• Genetic engineering is a concern for many Brazilians because of its possible effects on human health
and its potential to contaminate non-GMO crops. 60% of cotton, 54% of corn, and 91.8% of soy grown
in Brazil are now genetically engineered.3,4
Sources: (1) Prade 2015. (2) Neto et al. 2011. (3) Thuswol 2013. (4) Reuters Brasil 2014. 11AGRICULTURE
OVERVIEW OF AGRICULTURE IN THE CERRADO
12Cropland and pastureland currently account for almost half of the land cover in the Cerrado • The southern Cerrado states of Mato Grosso do Sul, Sao Paulo, and Goiás are dominated by pasture and croplands. • Minas Gerais and Mato Grosso are also used extensively for pasture and cropland. • The northern part of the biome is still largely covered with natural vegetation. Source: CEA and Greeninfo Network, using data from LAPIG Maps. 13
Agricultural production in the Cerrado states nearly doubled between
                         2005 and 2010
                                              Total agricultural production in Cerrado states
                          900
                          800
Millions of tonnes

                          700
                          600
                                                                                                                                                         • Major increases in crop
                          500
                                                                                                                                                           production occurred in the
                          400                                                                                                                              Cerrado states between 2005
                          300                                                                                                                              and 2010.
                          200                                                                                                                            • Soy is one of the main
                          100                                                                                                                              growth crops in the Cerrado,
                            -                                                                                                                              and its planted area has
                                     1990         1995         2000         2005         2010        2011         2012         2013
                                                                                                                                                           more than tripled since 1990.
                                                                                                                                                         • The southern Cerrado’s
                                           Planted soy area by states - Cerrado                                                                            planted soy area is far larger
                                                                                                                                                           than Matopiba’s, but both
                          20                                                                                           São Paulo
                          18                                                                                                                               are growing.
                                                                                                                       Minas Gerais
                          16                                                                                                                             • Matopiba accounts for about
                                                                                                                       Mato Grosso do Sul
  Millions of hectares

                          14                                                                                                                               16% of planted soy area in
                          12                                                                                           Goiás
                                                                                                                                                           the Cerrado.
                          10                                                                                           Mato Grosso
                           8
                                                                                                                       Tocantins
                           6
                           4                                                                                           Maranhão
                           2                                                                                           Piauí
                           0                                                                                           Bahia
                            1990 1992 1994 1996 1998 2000 2002 2004 2006 2008 2010 2012

                         Source: Pesquisa Agrícola Municipal,  via AgroIcone, April 2015.                              14
For sugarcane and soy, planted area (rather than productivity gains)
has driven yield growth in recent years
Soybean productivity in Cerrado and planted area Corn productivity in Cerrado and planted area
5 20 6 12
Planted area - million hectares
Planted area - million hectares
Productivity - thousand kg/ha
Yield: 108% Yield: 16% 18
Productivity - thousand kg/ha
5 Yield: 72% Yield: 39% 10
4 Area: 3% Area: 78% 16
14
Area: 3% Area: 28%
4 8
3 12
10 3 6
2 8
2 4
6
1 4 1 2
2
0 0 0 0
2003
2010
1990
1991
1992
1993
1994
1995
1996
1997
1998
1999
2000
2001
2002
2004
2005
2006
2007
2008
2009
2011
2012
2013
1999
2010
1990
1991
1992
1993
1994
1995
1996
1997
1998
2000
2001
2002
2003
2004
2005
2006
2007
2008
2009
2011
2012
2013
Soybean planted area Soybean productivity Corn planted area Corn productivity
Sugarcane productivity in Cerrado and planted area
100 9
Yield: -2% Yield: 14% • Soybeans have the greatest planted area
Planted area - million hectares
90
Productivity - thousand kg/ha
8
80 Area: 31% Area: 113% in Brazil among the agricultural crops.
7
70 6 • Planted area for both soy and sugarcane
60 has more than doubled since 2000, while
5
50
4 yield has remained relatively constant.
40
30 3 • Corn yield have managed to grow
20 2 considerably since 2000.
10 1
0 0
2002
1990
1991
1992
1993
1994
1995
1996
1997
1998
1999
2000
2001
2003
2004
2005
2006
2007
2008
2009
2010
2011
2012
2013
Sugarcane planted area Sugarcane productivity
Data from Pesquisa Agrícola Municipal; charts adapted from AgroIcone. 15AGRICULTURE
AGRICULTURE IN MATOPIBA
16Farm size in the Cerrado
• Farms in Matopiba tend to be small, with the exception of Tocantins.
• Matopiba has about 50% more family farms than the southern Cerrado.
Average farm size of Cerrado states – 2006
500
450
Hectares
400
Matopiba
350
300
250
200
150
100
50
0
Mato Grosso Mato Grosso Goiás São Paulo Minas Gerais Tocantins Maranhão Bahia Piauí
do Sul
17Matopiba is dominated by small family farms while larger agribusiness
farms characterize the southern Cerrado
Number of farms (units)
Matopiba Southern Cerrado
1.2 1.2 • The total farm area
1.0 1.0 in Matopiba states is
Mato Grosso
0.8 0.8 do Sul 66.5 Mha. About
Tocantins Mato Grosso 30% (21 Mha) of this
Millions
Millions
0.6 0.6
Piauí Goiás area is in family
0.4 Maranhão 0.4 farms and about
São Paulo
0.2 Bahia 0.2 70% (45.5 Mha) is in
Minas Gerais non-family farms.
0.0 0.0
Family Not family Family Not family • Family farms
farming farming farming farming
account for about
85% of farm units in
Area (hectares) Matopiba.
• While non-family
Matopiba 140
Southern Cerrado farms cover twice
140
120 120 the area of family
São Paulo
100 100 farms in Matopiba,
Millions
80
Piauí
80 Minas Gerais non-family farms
Millions
60 Tocantins 60 cover almost seven
Mato Grosso do
40 Maranhão 40 Sul
times the area of
20 Bahia 20 Mato Grosso family farms in the
- -
rest of the Cerrado.
Family Not family Family Not family
farming farming farming farming
Source: IBGE - Censo Agropecuário. http://www.sidra.ibge.gov.br/bda/tabela/listabl.asp?c=1109&z=p&o=2&i=P 18Farmland is dominated by owner-farmers everywhere, though a
significant share of the land area is under administrator ownership
800
Number of farms in each ownership type by state, 2006
700
Matopiba states starred
600
Thousands of farms
500
Occupant
400
Administrator
300
200
Leessee/Partner
100 Owner
-
Bahia Minas Maranhão Piauí São Paulo Goiás Mato Mato Tocantins
Gerais Grosso Grosso do
Sul
50 Area of land in each ownership type by state, 2006
Matopiba states starred
40
Millions of hectares
30
Occupant
20 Administrator
Leessee/Partner
10
Owner
-
Mato Minas Mato Bahia Goiás São Paulo Tocantins Maranhão Piauí
Grosso Gerais Grosso do
Sul
Source: IBGE - Censo Agropecuário. 19Average land prices in the Cerrado have increased rapidly since 2009,
but land in Matopiba is still relatively inexpensive
Agricultural land average price in Cerrado states, 2009 - 2014
30
+12%
25
Thousands R$/hectare
Matopiba
+21% +22%
20
+16%
+21%
15 +20%
10 +24% +9%
+16%
5
0
X% PI MA BA TO MT MS MG GO SP
Compound
Annual Pasture land average price in Cerrado states, 2009 - 2014
+14%
Growth 16
Rate
Thousands R$/hectare
14
Matopiba
12 +20%
10 +18% +16%
8
+19%
6 +23% +12%
4
+25%
+12%
2
0
PI MA TO BA MT MS MG GO SP
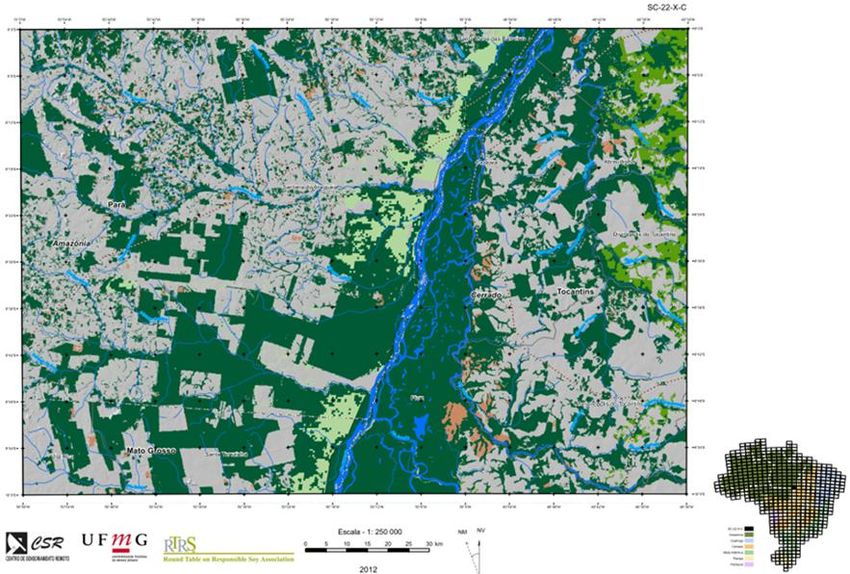
Source: Agrianual. Charts adapted from AgroIcone. 20Cheaper land prices in Matopiba make it an attractive area for
agricultural expansion
Avg. price by pasture (R$/ha)
506 - 2,500 Map of land prices in the Cerrado, 2012
2,500 - 5,000
5,000 - 7,500
Lower
7,500 - 10,000
10,000 - 24,083
States
Cerrado
Matopiba
Higher
Pasture land price map made by GreenInfo Network with data from
Agrianual, provided to CEA by AgroIcone. The Agrianual land price
database is incomplete, explaining why the map only shows select
areas. Land prices map on the right-hand side is from WWF, 2013. 21Currently, about 10% of the major agricultural crops and 20% of the
cattle produced in the Cerrado come from Matopiba
Soybean Sugarcane 1%
Bahia
3%
2% Maranhão 0%
4% 5% 3% 0%
7% 10%
Piauí • Mato Grosso dominates
11% Tocantins 10% soybean and corn
18% Goiás
3% production and also has the
Mato Grosso
6% largest cattle herd.
Mato Grosso do Sul
60%
10%
• Sao Paulo dominates
Minas Gerais
sugarcane production.
47%
São Paulo • Goiás and Mato Grosso do
Sul are leaders for corn and
soy.
Corn Cattle head • Maranhão is the only
Matopiba state with
3% 1% Bahia
1%
significant sugarcane
8% 4% Maranhão 8% 8% production; Matopiba also
1%
6%
Piauí has little corn production.
14% 15% 18% 6%
Tocantins • Cattle and soy dominate in
Goiás Matopiba.
Mato Grosso 16%
15%
Mato Grosso do Sul 16%
39% Minas Gerais
21%
São Paulo
Source: Pesquisa Agrícola Municipal, via AgroIcone. Link: http://www.sidra.ibge.gov.br/bda/tabela/listabl.asp?c=1612&z=p&o=28. 22Soy and corn production are growing in the Cerrado
Soybean production in Matopiba by state
3.0
2.5
2010
• The three “micro
2.0
regions” with the highest
Millions
2011
1.5 soy and corn production
2012
in Matopiba are Gerais
1.0 2013
de Balsas (Maranhão),
2014
0.5 Alto Parnaiba Piauiense
(Piauí) and Barreiras
0.0
Maranhão Tocantins Piauí Bahia (Bahia).
• In recent years, soy
production has grown
3.0 Corn production in Matopiba by state most rapidly in Tocantins.
2.5 • Corn production has
2010
grown rapidly in
2.0
Maranhão, Piauí, and
Millions
2011
1.5 Bahia.
2012
1.0 2013
2014
0.5
0.0
Maranhão Tocantins Piauí Bahia
Source: IGBE, via AgroIcone 23Grain storage capacity is a gap in the region and is concentrated in
Western Bahia
Storage facilities in Matopiba
Storage capacity by area
0 – 60 t
60 – 150 t
150 – 300 t
300 – 1,000 t • The Barrieras (Bahia)
microregion is has the
1.000 – 3,307 t
most developed
Warehouse agricultural storage
capacity, followed by
Gerais de Balsas
(Maranhão). Regions
are shown in blue on
the map.
Source: EMBRAPA, 2014, via AgroIcone. 24Matopiba states receive far less agricultural credit than southern
Cerrado states
Rural credit distributed in 2013
20
• Minas Gerais and Sao
Paulo receive by far the
18
most lending of the
Cerrado states, receiving
16
about R$18 billion in
14
2013.
• Mato Grosso and Goiás
12 comprise a second tier,
each receiving around
Billions R$
10 R$12 billion in 2013.
• Aside from Bahia,
8 Matopiba Matopiba states each
received less than R$2
6
billion in 2013.
4
2
0
MG SP MT GO MS BA TO MA PI
Source: Bacen: http://www.bcb.gov.br/pt-br/sfn/credrural/sicor/matrizinformacoes/Paginas/pgRegiaoUf.aspx, via AgroIcone 25The Matopiba states have lower Human Development Index (HDI)
scores than states in the southern Cerrado
HDI in Cerrado municipalities (2010)3
• The Human Development Index (HDI)
is a blended metric that integrates
0.44 – 0.58
health, education, and income
indicators. It was created by the 0.58 – 0.64
United Nations Development Program, 0.64 – 0.69
in 1990.1 0.69 – 0.74
• HDI is a 0-1 scale. In 2010, the country 0.74 – 0.85
with the highest score was Norway
(0.94) and the lowest was Niger (0.32).
• Matopiba states (Maranhão, Tocantins,
Piauí and Bahia), in the northern part
of the biome, have lower HDI scores
than southern Cerrado states.
Sources: (1) UNDP, 2013. (2) World Bank 2015. (3) CEPF 2015 26AGRICULTURE
SOY AND THE SOY SUPPLY CHAIN
27Soybean production is concentrated in southern Cerrado, Mato Grosso, and
western Bahia; high yield areas are dispersed
Soybean crop production in 2013 Soybean crop yield in 2013
Source: Produção Agrícola Municipal via AgroIcone 28Soy prices have skyrocketed
Average price in R$/ton by crop
900
750 • Growth in soy prices has far
outpaced sugarcane and
600
corn, leading it to be the
fastest expanding crop in
Price crop (R$)
the Cerrado.
450 • Sugarcane prices have
hardly increased since 1995
300 • Corn prices have fluctuated
since 2009, with modest
overall growth.
150
0
1995 2000 2005 2009 2010 2011 2012 2013
Sugarcane Soybean Corn
Source: data from Pesquisa Agrícola Municipal; chart adapted from AgroIcone. 29Soy production of Tocantins and Maranhão have comparable yields to
the rest of the Cerrado; Bahia and Piauí lag behind
Soy yield by state in the Cerrado, 2013 (kg/ha)
3,500
Matopiba
3,000
2,500
kg / hectare
2,000
1,500
1,000
500
0
Goiás São Paulo Mato Minas Mato Tocantins Maranhão Bahia Piauí
Grosso Gerais Grosso do
Sul
Source: IBGE - Produção Agrícola Municipal, via AgroIcone 30Crushing industry: Process Industrial soy oil derivatives: The
whole soybeans into meal and refined oil can be further processed
into margarines, mayonnaise, and
Soy supply chain oil. Soybean meal in the
domestic market goes to the vegetable fats, which are intended
feed industry. Other processed primarily for the domestic market
products can also be sold to the through wholesale distributors and
food, chemical and retailers.
pharmaceutical industries.
A
Production Soybean Industrial oil
Inputs Originators Distribution
81.7 m ton crushers derivatives
West Distributors:
Seeds Salad
Central Link the
46.8% Private crushing and
Warehouse companies Wholesale soy
Fertilizers South Dressing
A
derivatives
37.1% industries to
A A A A the final
Pesticides Margarine
Southeast Agricultural consumers.
cooperatives Retail
6.4%
A
Machinery Northeast Mayonnaise
A Coop-
6.4% Trading eratives Institutional
companies Market
Other North Other
3.3% A
A
A
Originators: Transact
International A A A
with producers /
market US$ Feed industry Domestic
cooperatives in order to
22.8 billion Meat industry Market
acquire soybeans and
sell to the foreign
A
market and to the Other
crushing industry. This industries Note:A Values, when mentioned, for 2013. Source: Ministério
a step can be skipped. da Agricultura; IBGE - Produção Agrícola Municipal. 31Strategic Importance of this Sector
oy Complex – 2013
Brazilian soy supply chain by the numbers
million tons
Exportations
Export 12 million
Meal Meal 15.0 tons
Domestic market
29.328 million tons Dom. Consumption
16 million tons
Production
Production Crushing
Processing 14.2
82 million tons
82.3 36 million tons Export
38.5 Exportations
Oil 1 million tons
Oil 1.7
7 million tons Domestic market
7.4 Dom. Consumption
6 million tons
5.7
Biodiesel
2.0
Exportations Biodiesel
38.5 2 million tons
Export
43 million tons
ABIOVE 7
Source: ABIOVE & MDIC-Secex, via AgroIcone. 32Bunge, Cargill, ADM, and Louis Dreyfus dominate Brazilian soy trading
Active crushing units in Cerrado by company, 2014 • There are around 30 companies or
Company Units Location Company Units Location Company Units Location cooperatives trading soy in the
Bunge 6 BA, GO, MS, MT, PI Agrex 1 GO Oleoplan 1 BA Cerrado region, with 42 soybean
Cargill 5 BA, GO, MG, MS, MT Amaggi 1 MT Olvebasa 1 BA crushing units between them,
ADM 4 GO, MG, MS, MT Araguassú 1 MT Olvego 1 GO
including 10 inactive units.
Caramuru 3 GO, MT Cereal 1 GO Producampo 1 MT • The top 10 companies with the largest
Granol 3 GO, SP Clarion 1 MT Selecta 1 MG installed crushing capacity represent
Algar Agro 2 MA, MG Correcta 1 MS Sodru 1 SP
Brejeiro 2 GO, SP Dureino 1 PI Sperafico 1 MT
55% of the total industry capacity in
Comigo 2 GO Grupal 1 MT Tauá 1 MT Brazil.
Louis • In 2014, Bunge, Cargill, ADM, and
Dreyfus 2 GO, MT Lasa 1 GO
Sina 2 SP Noble 1 MT
Louis Dreyfus exported USD$ 17
billion (Bunge - $6 billion; Cargill - $4
billion; Louis Dreyfus - $3.5 billion;
ADM - $3.3 billion). These four
Major exporting companies by value companies exported 55% (USD$ 17.2
21
billion) of the total soy complex
18
exported by Brazil in 2014 (USD$ 31.4
15
billion).
Billion USD
12
• In recent years, the Brazilian soybean
9
crush industry has become more
6
concentrated due to mergers and
3
acquisitions in the late 1990s, when
0
2005 2006 2007 2008 2009 2010 2011 2012 2013 2014
international companies bought small
and medium national industries.
ADM Bunge Cargill Louis Dreyfus
Sources: Table - ABIOVE. Chart - MDIC-Secex. Both graphics and slide text adapted from AgroIcone. 33Soybean crushing capacity is concentrated in the southern Cerrado
and the far Southern region of Brazil
Soybean crushing capacity
200
175 • In the past 10 years crushing
capacity has increased by 37%
Thousand tons/day
150
125 in Brazil, from 132 to 180
100 thousand tons/day.
75 • In the same period, crushing
50 capacity in the Cerrado
25 increased by 48%, from 104 to
0 109 thousand tons/day.
2002
2005
2008
2011
1997
1998
2000
2001
2003
2004
2006
2007
2009
2010
2012
2013
2014
• MT/MS/GO comprise 41% of
Brazil Cerrado
Brazilian soybean crushing
capacity, while states in the far
South comprise 38%.
Crushing capacity in 2014 • Matopiba’s crushing capacity is
45 currently very limited.
40 • Since 2004, crushing capacity
35
has increased about 96% in MT,
Thousand tons/day
30
25
50% in RS, 37% in GO, and 45%
20 in MS.
15
10
5
0
MT PR RS GO SP MS MG BA SC PI AM MA
Source: ABIOVE. Charts adapted from AgroIcone, slide test partially adapted from AgroIcone. 34Whole soybean exports are growing while soybean meal and oil
exports are declining
Brazilian soy exports by type1
50 • In the 1990’s, soybean meal
45 was the main soy product
40
35
exported by Brazil.
• Starting in 2000, China began to
Million tons
30
25 invest it its own crushing
20
15 capacity and started to import
10 more grain than meal.
5
0
• Domestic consumption of
soybean meal has increased
2007
1997
1998
1999
2000
2001
2002
2003
2004
2005
2006
2008
2009
2010
2011
2012
2013
2014
significantly in the last decade,
Soybean Soybean meal Soy oil mainly due to expansion and
concentration of Brazilian meat
Brazilian soybean destination2 production.
90 • Since 2005 an increasingly
75 greater proportion of Brazilian
Million tons
60 soybeans have been exported,
45
while the amount consumed
domestically fluctuates
30
considerably year over year.
15
0
2001
1997
1998
1999
2000
2002
2003
2004
2005
2006
2007
2008
2009
2010
2011
2012
2013
Domestic Consumption Exports
Sources: (1) Data source: MDIC, chart adapted from AgroIcone. (2) Data source: Pesquisa Agrícola Municipal / MDIC-Secex, chart adapted from AgroIcone. This graph is for soybeans, in
particular – does not include soybean meal or soy oil. Some slide text adapted from AgroIcone. 35Domestic consumption of soybean meal has increased, while major
international buyers have gained a preference whole soybeans
Whole soybean export Soy oil export destinations, • China imports the vast
destinations, 2014 2014 majority of Brazilian
soybeans (71% in
2014).
China India
3%
2% 15% 15% • India and China each
Spain 33% China
7% import about one third
4% Netherlands Bangladesh
of Brazil’s soybean oil
5% Thailand 7% Algeria exports.
United States 8% Cuba
71% • As of 2014, the main
Other Other
30% Brazilian soybean meal
importers are the
Netherlands, France,
Germany and Thailand.
Brazilian soybean meal export Brazilian soybean meal export • China used to buy
destinations in 1998 destinations in 2014 more soybean meal
from Brazil, but it has
7% 11% invested in its own
crushing capacity and
37% 19%
Germany
39% 14% now imports the
2% France lower-value whole
9%
Thailand soybeans.
23% Netherlands
12% 26%
China
1%
Others
Source: MDIC-Secex, via AgroIcone. 36Globally, the Unites States and Brazil dominate soybean exports and
China now accounts for nearly 65% of soybean imports
Soybean exporters
120
• US (49 million tons) and Brazil (46
100 million tons) are the largest
80 exporters of soybeans, globally,
Million tons
60
followed by Argentina (8 million
tons) and Paraguay (5 million tons)
40
as of 2014/15.
20
• Brazil soybean exports increased
0 by 128% in last decade, followed
by Paraguay (67%) and US (63%).
Argentinian exports decreased by
United States Brazil Argentina Paraguay Other 16%.
Soybean importers • In the last decade China’s soybean
120 imports have increased by 187%,
100
while imports by Japan and the EU
have decreased by 32% and 13%,
80
Million tons
respectively.
60
40
20
0
China European Union Mexico Japan Other
Source: chart data from USDA, charts adapted from AgroIcone. Slide text adapted from AgroIcone. 37Growth in soybean production is expected to continue at a fast pace
• From 2014 to 2024, the Brazilian
Soybean long-term projection government predicts an increase in
120
soybean production of 37%, reaching 118
million tons by the 2023/24 growing
season.
100
• In the same period, domestic consumption
80
and exports are expected to increase by
about 26% and 44% respectively.
Million tons
60 • The increase in domestic consumption will
be caused by higher demand from the feed
40 industry and for biodiesel production.
• The planted soybean area is expected to
20 increase by 10 million hectares over the
next 10 years, reaching 40 million hectares
0 in 2024.
o The planted area is expected to increase,
mainly in the Matopiba states.
o In Mato Grosso, soybean area is expected
Production Consumption Exports to expand, primarily over degraded
pasture areas.
Source: Chart data from Ministério da Agricultura, chart adapted from AgroIcone. Slide text partially adapted from AgroIcone. 38Soybean meal and oil production are projected to grow more slowly;
oil will likely remain mostly domestically consumed
Soybean meal long-term projection
40 Soybean Meal
35 • Between 2013/14 and 2023/24,
30 soybean meal production is expected
Million tons
25
20
to increase by about 25%, reaching 35
15 million tons in 2023/24.
10 • Growth is expected to be primarily
5 driven by domestic consumption.
0
• The Brazilian government estimates
that in 2023/24, about 54% of soybean
Production Consumption Exports
meal production will be consumed
domestically, and 45% will be exported.
Soybean oil long-term projection
Soybean Oil
10
9 • Between 2013/14 and 2023/24, the
8
7
Brazilian government estimates an
Million tons
6 increase of about 26% in soybean oil
5
4 production, reaching 9 million tons in
3 2023/24.
2
1 • Domestic consumption and exports are
0 expected to increase by about 23%
and 18%, respectively.
Production Consumption Exports
Source: Chart data from Ministério da Agricultura, chart adapted from AgroIcone. Slide text partially adapted from AgroIcone. 39AGRICULTURE
THE BEEF AND MILK SUPPLY CHAIN
40The cattle herd is dispersed throughout Brazil, with significant stocks in
the Cerrado and Amazon
Cattle herd in Brazil, beef and dairy, 2013
• Cattle for beef and milk are
major agricultural products in
Brazil for both domestic
consumption and export.
• Cattle, especially beef cattle, is
present in the frontier areas,
and pasture is often the first
productive use of lands
converted from natural
vegetation.
• Soy and other crops are more
profitable uses of land, so
often recently deforested land
spends a few years as
Legend pastureland before being
90 to 54,175 head converted to cropland.
54,176 to 118,456 head
118,457 to 222,810 head
222,811 to 547,022 head
547,023 to 3,766,176 head
No data
Source: IBGE - Pesquisa Pecuária Municipal. 41Beef cattle are dispersed around the country, while dairy cattle are
concentrated in southeastern Brazil
• While cattle for beef in Brazil are spread throughout the Cerrado (especially south & west) and the
Amazon, cattle for dairy are concentrated in the southeast part of Brazil.
• Consequently, dairy cattle are likely a less direct driver of deforestation; the soy used in their feed is likely
the main driver of deforestation from the dairy industry.
Beef cattle in Brazil Milk cows in Brazil
291 to 10,095 head 30 to 5,023 head
10,096 to 19,736 head 5,024 to 9,679 head
19,737 to 39,965 head 9,680 to 17,299 head
39,966 to 72,142 head 17,300 to 29,614 head
72,143 to 172,988 head 29,615 to 49,229 head
172,989 to 450,002 head 49,230 to 82,928 head
450,003 to 3,648,728 head 82,929 to 467,000 head
No data No data
Source: IBGE – Censo Agropecuário & IBGE – Pesquisa Pecuária Municipal 42Beef production is expected to grow 20% by 2040; milk production is
projected to grow 30% in that timeframe
Beef long-term projection for Brazil Beef projections
14 • Roughly 2% growth per year is expected in
12
beef production through 2024.
Million tons
10
• Between 2014 and 2024 Brazilian beef
8
consumption is expected to increase by
6
4
16%, from 7.7 million to 9 million tons.
2 • In the same period, a growth of about 40%
0 in exports is expected, from 2.1 million to
2014 2015 2016 2017 2018 2019 2020 2021 2022 2023 2024 2.9 million tons. This represents, on
Production Consumption Exports average annual growth rate of 3.4%.
Milk projections
Milk long-term projection for Brazil
• Between 2013/14 and 2023/24,
60 1,200
projections show an increase of about 30%
50 1,000 in milk production, from 36 million to 46
Thousand tons
Million tons
40 800 million tons.
30 600 • Brazilian milk consumption is expected to
increase by about 27% in the next 10
20 400
years, from 38 million to 48 million tons.
10 200
• Exports will increase by about 34% in the
0 0 same period, reaching 191 thousand tons.
• Import projections show a decrease by
about 9% in the period, from 1.1 million to
Production Consumption Imports Exports 991 thousand tons.
Source: Ministério da Agricultura. Charts and some text adapted from AgroIcone. 43Brazil has one of the largest commercial cattle herd in the world
• 5 countries share 79% of the world’s
cattle: India (367 million head), Brazil
World cattle herd
(258 million), China (151 million), USA
1400
(125 million) and the EU (117 million).
1200
• Brazil has the largest commercial herd
in the world (much of India’s herd is
1000 outside of the market).
• Between 2000 and 2013 the Brazilian
Million animals
800 cattle herd increased by nearly 40%,
while India’s expanded by only 9%.
600 During that same time the other major
cattle-producing countries declined:
400
o China, -7%
o USA -10%
200
o EU -10%
0 • The total world cattle herd decreased
2000 2002 2004 2006 2008 2010 2012 2014 by 3% between 2000 to 2014 from
1.32 billion head to 1.28 billion head.
India Brazil China USA European Union Other
Source: data from USDA, chart adapted from AgroIcone. Slide text a partially adapted from AgroIcone. 44The US, Brazil, EU, and China lead in beef consumption
World beef production
60 Production
• Brazil ranks second in global beef production.
50
• In 2014 Brazilian production represented 16% of
40 world production, 32% higher that its share in
Million tons
30 2000 (12%).
20
• From 2000 to 2014, US and EU production
decreased by around 10%, while production in
10
Brazil, China and India increased by 49%, 34% and
0 170% respectively. These five countries accounted
2000 2002 2004 2006 2008 2010 2012 2014
for two-thirds of global beef production in 2014.
USA Brazil European Union China India Other
Consumption
World beef consumption
60 • World beef consumption increased by 9%, from
2000 to 2014, reaching 58 million tons.
50
• In the last decade, Brazilian beef consumption
40 increased by 29% and Chinese beef consumption
Million tons
30 increased by 48%. On the other hand, the US, and
20
EU Argentina consumption decreased by about
10%, 8% and 2%, respectively.
10
• In 2014, Brazil, China, US, EU, and Argentina
0 together consumed 63% of the total world beef.
2000 2002 2004 2006 2008 2010 2012 2014
USA Brazil European Union China Argentina Other
Source: data from USDA, chart adapted from AgroIcone. Slide text a partially adapted from AgroIcone. 45Since 2000, Brazil’s beef exports have increased five-fold, while China
emerged as a major importer
World beef exporters
10 Exporters
• The main beef exporters in 2014 were India
8
(2.1m tons), Brazil (1.91m), Australia (1.85m),
Million tons
6
USA (1.17m) and New Zealand (0.6m).
4
• According to the USDA, from 2000 to 2014,
2 beef exports increased considerably in India
0 and Brazil, by about 505% and 291%,
respectively.
India Brazil Australia USA New Zealand Other
World beef importers Importers
8 • Main beef importers in 2014 were the US
7
(1.34 m tons), Russia (920 thousand tons),
6
Million tons
5 Japan (740 thousand tons), Hong Kong (650
4 thousand tons) and China (417 thousand
3
2
tons).
1 • Between 2000 and 2014, China had the
0 largest increase in beef imports, about
2,506%, albeit off of a small base.
USA Hong Kong Russia Japan China Other
Source: data from USDA, chart adapted from AgroIcone. Slide text a partially adapted from AgroIcone. 46Most Brazilian beef is consumed domestically; Russia and Hong Kong*
account for nearly half of Brazilian beef imports
Brazilian beef destination
10
9
• About 80% of Brazilian beef
8 production is consumed
7 domestically, and 20% is exported,
Million tons
6
5 although exports have been
4 growing slightly faster than
3
2
domestic consumption.
1 • Beef production increased about
0
2000 2002 2004 2006 2008 2010 2012 2014 50% from 2000 to 2014, reaching
nearly 10 million tons.
Domestic Consumption Exports
• The main beef exporting states in
Top export destinations for Brazilian beef 2014 were SP (439 thousand tons),
1.8 MT (279 thousand tons), GO (228
1.6 thousand tons), MS (165 thousand
1.4 tons) and RO (134 thousand tons).
1.2
Billions USD$
1.0
• Key end buyers in 2014 were Hong
0.8 Kong (25%), Russia (20%),
0.6 Venezuela (11%) and Egypt (11%).
0.4
0.2
0.0
*It isn’t clear from the data what the final
destination is for exports to Hong Kong. It
may serve as an intake port for beef
consumption in mainland China, or may
be part of a processing and re-export
Source: MDIC via AgroIcone.
hub.
47Brazil’s cattle herd has been fairly stable over the last 10 years
250 Head of cattle in Brazil
200 • States with at least part of
their area in the Cerrado
150
are home to about 60% of
Non-Cerrado states
Millions of cattle
100
Brazil’s cattle herd. (Note
Cerrado states that this graph shows Cerrado
50 states, not the Cerrado Biome.)
• In 2013 Mato Grosso had
0 over 28 million head,
1990
1995
1991
1992
1993
1994
1996
1997
1998
1999
2000
2001
2002
2003
2004
2005
2006
2007
2008
2009
2010
2011
2012
2013
Minas Gerais 24 million,
Goiás and Mato Grosso do
Sul about 21 million, and
160 São Paulo and Bahia each
Head of cattle in Cerrado states had about 10 million head.
140 Piauí
• Tocantins and Maranhão
120 Maranhão had about 8 million head
100 Tocantins in 2013, while Piauí had
Millions of head
80
São Paulo less than 2 million.
Bahia
60
Mato Grosso do Sul
40
Goiás
20 Minas Gerais
0 Mato Grosso
1990 1992 1994 1996 1998 2000 2002 2004 2006 2008 2010 2012
Source: IBGE - Pesquisa Pecuária Municipal, via AgroIcone. 48Beef cattle supply chain
Suppliers: Primary Industrialization: Marketing:
Activities related to producers: Primary processing Wholesalers & exporters
animal health, Companies or Slaughter and initial These actors often also
nutrition, and farmers that breed break-down of animals. provide storage & delivery.
genetics. and fatten the
Secondary processing Retailers
animals. Often there
Incorporates meat into Sell beef directly to
are multiple steps in
food products or consumer. Retailers include
this part of the
further processes meat grocery stores, restaurants,
chain.
products. and food services providers.
Suppliers Primary Industrialization Marketing Consumption
producers
Primary Wholesaler
processing or Exporter
Input Agricultural industrial-
Suppliers companies iztion Final
Retailer
customer
Secondary Collective /
Carrier Farmers
processing institutional
agents
indutrial- food
ization companies
Source: Ministério da Agricultura, via AgroIcone. 49The top three beef cattle companies in Brazil – JBS, Marfrig, and
Minerva – control 36% of slaughter capacity
The top 3 Brazilian beef cattle companies
% of beef cattle Number and location of
Company slaughter slaughterhouses2
capacity1
• Total: ~50 total units in Brazil
• Cerrado: ~20 units in or near the Cerrado
22% • Matopiba: 1 unit in Maranhão; 4 units in
Pará near the Cerrado (Tocantins), 1 unit
near Belém
• Total: ~20 total units in Brazil
• Cerrado: ~10 units in or near the Cerrado
9% • Matopiba: No identified units in
Matopiba states
• Total: ~8 units in Brazil
5% • Cerrado: ~5 units in or near the Cerrado
• Matopiba: 1 unit in Tocantins
Sources: (1) Valor Economico, 2011 via AgroIcone. (2) ABIEC website, accessed September, 2015. http://www.brazilianbeef.org.br/mapadasplantas.asp. 50Slaughterhouses are concentrated in southern Cerrado states,
although Rondonia and Para have significant slaughter capacity
Major slaughterhouses
• Slaughterhouses have settled near the Pasture
producing regions, mostly in the southern Slaughterhouse
Cerrado states. Matopiba region
Protected areas and
• There are 260 slaughterhouses registered in indigenous lands
the SIF (Federal Inspection Service). In MT State boundaries
there are 37; in MS - 35; SP - 30; MG - 29; GO -
26; RO - 18.
Number of slaughterhouses
6 Southern Cerrado Matopiba
5
4
Millions
3
2
1
0
Sources: Map via AgroIcone. Some text adapted from AgroIcone. Chart data from Ministério da Agricultura via AgroIcone. 51Brazil’s dairy sector (production value USD$37 m) is almost as important
economically as its beef sector (production value USD$50 m)
Production value of beef and dairy in Brazil, 2012
• Fresh or chilled cattle meat in 2012
was valued at $34 million USD.
1% Frozen cattle meat was valued at
1% 0%
$12 million USD. Together they
2% account for over 90% of the value of
beef cattle production, and 53% of
15%
overall cattle production (including
dairy).
39%
Fresh or chilled cattle meat
Frozen cattle meat
Cattle edible offal
27%
Dairy production
Preparation of the milk
Leather & skin of cattle
14% Cattle fat, sheep or goats
1% Cattle fat, raw sheep or goats
Spoils raw, inedible
Source: IBGE – Pesquisa Industrial Anual – Produto, via AgroIcone. 52The dairy industry is less concentrated than the cattle industry
Top 10 companies in milk purchased (thousand liters)1 Distribution of dairy companies in Brazil2
Company 2013 2014
1 DPA/Nestlé 2,033,000 2,000,000
2 BRF 1,377,264 1,424,626
3 CCPR/ ITAMBÉ 1,056,264 1,222,373
4 LATICÍNIOS BELA VISTA 828,630 1,032,098
5 CASTROLANDA, BATAVO e CAPAL 548,674 765,938
6 EMBARÉ 527,721 563,952
7 AURORA 499,500 518,900
8 DANONE 448,716 457,690
9 CONFEPAR 411,037 418,975
10 JUSSARA 330,380 348,125
• In recent years, the dairy industry has become more concentrated, with some companies gaining
market share in both the purchase of milk and in end markets.
• Main international companies in this sector are DPA/Nestlé and Danone; they represented 28% of the
total milk bought by the top 10 companies of this sector in 2014.
• BRF is the second largest company in milk purchased and the largest Brazilian national company in the
sector.
• Most dairy processing is located in the largest milk producing states of MG, GO, PR and RS.
Sources: (1) Associação Brasileira dos Produtores de Leite via AgroIcone. (2) G100 Associação Brasileira de Pequenas e Médias Cooperativas e Empresas de Laticínios. (3) Slide text adapted
from AgroIcone. 53Brazil’s dairies lag behind other major milk producers in terms of yield
• World milk yield increased by
World dairy milk yield in 2014 21% from 2000 to 2014,
12
reaching over 4 tons/cow.
10
• From 2000 to 2014 the milk
Tons/cow
8
6 yield growth was most
4 significant in Ukraine (94%),
2 Argentina (43%), EU (34%), and
0
USA (22%). In Brazil the yield
improved 17% during this
period.
• Brazil’s dairy productivity is
lower than other major milk
producing countries.
Data source: BGE - Pesquisa Pecuária Municipal; charts and text adapted from AgroIcone. 54AGRICULTURE
PASTURE INTENSIFICATION
55Pasture intensification can spare land, provide room for expansion of
crops, and improve cattle productivity
• Pasture intensification increases productivity from a given unit of land through improved
forage quality, instead of expanding production by expanding the land footprint.
• Pastures intensification can: 1) reduce the land footprint needed to produce cattle, thus
reducing pressure on forests, 2) free up land that soy and other crops can expand onto, thus
reducing pressure on forests, and 3) reduce the enteric fermentation emissions associated
with the cattle herd by improving their diets.
• In general, Brazil has relatively low density of cattle per hectare (less than one head of cattle
per hectare) spread out over ~160 Mha1 (roughly 20% of Brazil’s total area). There is
considerable room for intensification and efforts are already being made on the part of the
government, trade associations, and NGOs, to intensify through restoration of degraded
pastures. Current cattle production is mostly low-density2
Sources: (1) IBGE, Agricultural Census, 2006.
(2) Tollefson 2010. 56The land sparing effects of pasture intensification could be very
significant
In theory, intensification has a high GHG mitigation
potential because it helps avoid cattle-driven Change in LULUCF GHGs caused by cattle
deforestation. Increasing the productivity of pastures intensity tax or subsidy policy scenarios (2030)2
might save 250-450 Mt CO2e per year by 2030.
• Strassburg et al. 2013 modeled intensification on
Brazil’s 115 Mha of cultivated pasturelands and
found that intensification might prevent land use
change emissions of ~400 Mt CO2e per year
(assuming continuation of current deforestation
trends), while reductions in enteric fermentation
could mitigate ~50 Mt CO2e per year in 2030. 1
• Cohn et al. 2014 did a similar analysis, investigating
the effects of a government subsidy for intensive
cattle production or a tax on extensive cattle
production.2
o Both a tax and subsidy yield ~400 Mt CO2e per
year by 2030 from decreases in deforestation in
Brazil. (middle graph)
o Intensification driven by subsidies would
presumably increase the herd size and thus
enteric fermentation emissions, while
intensification driven by taxes would
presumably decrease herd size and thus enteric
fermentation – both effects would be marginal
(Cattle intensification and use of mixed systems can meet the demand
for land from expanded crop production in Brazil
• According to one modeling effort, future crops will demand an area of 33.5 Mha across all of
Brazil. (By way of comparison, the area of the entire Cerrado is 200 Mha). If these crops
were distributed across mixed agropastoral (crop-livestock) and silvopastoral (crop-planted
forest) systems, then the area might be significantly larger (~60 Mha).
• This need could be accommodated
using the existing footprint of Future demand for land from crops and planted forest (Mha) can
be met by expanding onto land spared by intensification of cattle
agriculture by intensifying agriculture
and then expanding onto newly freed- 1
up lands. 6
• According to this modeling effort,
Brazilian cultivated pasturelands are
only at 32-34% of their potential 8
productivity currently.
• Increasing productivity to 49-52% of
its potential would allow for
agricultural production without
expanding the overall footprint of 18
agriculture.
• This would save 14.3 Gt CO2e, almost
all in avoided deforestation.
-34
Cattle Soybean Maize Sugarcane Planted Total
forest
Source: Strassburg et al., 2014. 58The Cerrado has significant pastureland that is suitable for crop
production
Pastureland suitable for agriculture*
Pampas Pantanal Caatinga Atlantic Forest Cerrado Amazon
20
18
16
14
Million hectares
12
10
8
6
4
2
0
Source: Soares-Filho, et al, 2014. *Without considering climatic or land-use zoning restrictions, per biome (colors) and state (horizontal axis). 59In theory, no additional vegetation needs to be cleared
• Assuming very modest levels of cattle Possible land use scenario in 2040 that avoids
intensification and use of mixed crop- further conversion of natural vegetation
livestock and crop-forestry systems,
demand for agricultural products in 2040
can be met without expanding the overall
footprint of agriculture (see right).
• An alternative scenario where cattle
production is concentrated in high
productivity areas would potentially even
free up additional land to be reforested.
• The challenge is that, while such an
allocation may make sense at the national
level, it may not reflect the needs of
individual landowners, each of whom are Sugarcane
likely to seek to maximize their own Reforestation
Agropastoral (AU/ha)
economic gain from the land that they 0.00-1.00
control. This may involve expanding 1.01-2.00
2.01-5.35
production into areas of native vegetation. Silvipastoral (AU/ha)
0.00-1.00
1.01-2.00
2.01-5.35
Traditional Cattle Ranching (AU/ha)
0.00-1.00
1.01-2.00
2.01-5.35
Source: Strassburg et al., 2014.
60AGRICULTURE
AGRICULTURAL CERTIFICATIONS
61The Roundtable for Responsible Soy (RTRS) certification has the
backing of global soy traders, but has had limited impact to date
RTRS was established in 2006 and is a multi-stakeholder initiative of the mainstream soy
industry, including retailers, producers, the feed industry, NGOs, and banks.1
• RTRS has over 150 members from more than 120 countries. Its RTRS-certified soy program
was launched in 2011.
• RTRS has a goal of reaching 10 million tonnes of certified responsible soy worldwide by 2017. 2
Brazil’s total soy production in 2014 was 90 million tones. In 2014, 1.5 million tonnes of RTRS-
certified soy were produced, accounting for less than 1% of global soy trading.3
• RTRS soy cannot be produced on land deforested after 2009. RTRS also promotes increasing
productivity and other best agricultural practices.4
• The price premium for RTRS soy is very low, and little public pressure has been exerted on this
segment of the supply chain (traders) , which reduces the incentive for buyers to buy RTRS-
certified soy.
Supply and demand of RTRS soy6
• RTRS recently completed a map to guide future 1.4
expansion of soy in Brazil and Paraguay. These 1.2
Millions of tonnes
maps identify High Conservation Value (HCV) 1.0
0.8
areas with a vision towards incorporating them 0.6
into sourcing standards; discussions of how to 0.4
use this map are ongoing. 0.2 * *
0.0
• Amaggi is a leader in RTRS certifications; as of 2011 2012 2013 2014
2014, 42% of RTRS certified soy came from Stock/credits left over from previous year
Amaggi and its suppliers.5 Production
* Indicate incomplete data
Sales (report was issued in 2014)
Sources: (1) WWF, 2015. (2) ResponsibleSoy.com, 2015. (3) IISD.org, 2015. (4) RTRS, 2011. (5) Juliana Lopes interview, Amaggi. (6) WWF, 2014. 62RTRS’ mapping effort for responsible soy expansion is very detailed
Guide for responsible soy expansion
RTRS members must embed in procurement and investment strategies
RTRS criteria for soy
expansion
Not permitted
Areas have value;
depends on HCVA
assessment
Law adequate
No native
vegetation, law
adequate
63In addition to RTRS there are several other initiatives and certifications
that have emerged for soy in Brazil
Alianca da Terra is a Brazilian NGO focused on sustainable farming
• Alianca da Terra (ADT) maintains a Registry of Social-Environmental Responsibility (RSR).
The main goal of the RSR is to help guide landowners through the key criterion of the RTRS
certification.2
• In 2008, ADT began working with ADM on the “Doing it Right” program, which is focused
on entering ADM’s suppliers into the RSR. Today it has registered over 500 properties.2
• ADM and Alianca da Terra have also joined the SojaPlus program (see below).3
SojaPlus is the Brazilian soy industry’s main soy sustainability initiative4
• Launched in 2011, the Soja Plus program is the result of a partnership between ABIOVE
(the Brazilian Vegetable Oil Industry Association) and APROSOJA (the Mato Grosso State
Soybean and Corn Producers Association). The initiative was started in Mato Grosso but
aims to eventually expand to Minas Gerais, Mato Grosso do Sul, and Paraná.5
• SojaPlus is a comprehensive sustainability and best practices program. It is not centered
around a certification program, but nonetheless offers certification to participating farms
through a third party audit.5
• The main activities of SojaPlus involved farm trainings and rural assistance with technology
and best agricultural practices.6
Sources: (1) Alianca da Terra, 2015. (2) IFC, 2015. (3) ADM, 2013. (4) ABIOVE, 2010. (5) Silva, 2015. (6) ABIOVE 2010. 64AGRICULTURE
TRANSPORTATION INFRASTRUCTURE
65Brazil is making significant investments in transportation infrastructure
in the Cerrado
Lack of transportation infrastructure has been a limiting factor for agriculture in the Cerrado
• It is generally cheap to produce agricultural crops in the Cerrado, but relatively expensive
to bring them to market. As transportation infrastructure improves, it has the potential to
improve the economics of production and speed the expansion of agricultural
development near transportation corridors.
Brazil’s Logistics Investment Program (LIP), first announced by President Rousseff in 2012, will
lead to significant investment in road and rail transport in the Cerrado and elsewhere in Brazil. 1
• Scope: R$198 billion. R$ 69 billion from 2015-2018, and $129 billion after 2018.
• R$ 66b will be spent on roads; R$ 86b on railways, R$ 37 on ports, and R$ 8.5 on airports.
The third phase of Brazil’s Growth Acceleration Program (PAC-3) focuses on expanding
investment in infrastructure to stimulate the productive sectors, including: 2
• a host of new hydropower plants
• the completion of the North-South railway
• support for a East-West railway (to connect Brazil to the Pacific Ocean)
• expansion of the highway system
Sources: (1) McKenna, 2012. (2) KPMG. “Investing in Brazil: A land of opportunities,” November, 2012, http://bit.ly/22JwQTl. 66Brazilian roads are currently the backbone of agricultural transport in
the Cerrado
Brazil’s major roadways
• There are 213,000 km of paved roads
in Brazil; another 21,00 km are under
currently construction.
• Roads help make land accessible and
usable at a lower cost, driving
deforestation in the surrounding
areas.
Share of total road length among Cerrado states2
14% Mato Grosso
Mato Grosso do Sul
6% 30%
Goais
3% Minas Gerais
6% Sao Paulo
Maranhao
7% Tocantis
21%
9% Piaui
4% Bahia
Sources: Ministério dos Transportes, via AgroIcone. Pie chart data source: DNIT. Chart adapted from AgroIcone. 67Cerrado highways: existing, planned, and under construction
Legend
CAR-FIP priority municipalities
Existing highways
Planned highways PAC plans for highway expansion
Highways under construction include:1
Indigenous area • the construction and paving of
Federal protected area BR-235 in Piauí
Federal sustainable use area • the paving of BR-163 in Mato
State protected area
State sustainable use area
Grosso
• the construction of the BR-158
and BR-242 in Mato Grosso
• the duplication of the BR-080
in Goiás
• construction of the BR-350 in
Mato Grosso do Sul
• the construction of the BR-080
passages in Mato Grosso and
Goiás.
Source: map – MMA. “Marco de Gestão Ambiental e Social – MGAS.” 2014. (1) “Transportes 2014 e Resultados 2011 a 2014,” Ministério dos Transportes. 68Cerrado railways: existing, planned, and under construction
Legend
CAR-FIP priority municipalities
Existing railways
Planned railways
Railways under construction
Indigenous area
Federal protected area • Ambitious railways
Federal sustainable use area schemes, including a
State protected area
State sustainable use area
north-south trunk link
being constructed
through Tocantins and
Goiás, would link
Cerrado breadbaskets
to demand centers and
ports on both the East
and West coasts of the
continent.
Sources: map – MMA. “Marco de Gestão Ambiental e Social – MGAS.” 2014. 69There are plans to greatly increase rail capacity in the Cerrado in
support of agricultural transport
Planned expansion of Cerrado’s
Railroad infrastructure is slated to expand throughout the Cerrado, main North-South railway1
including through two high-profile projects.
Bacarena
The North-South railway1
Acailandia
• The partially-complete North-South railway will be a major route for
grain export from the Cerrado. Legend
• Between 2011 and 2014 over 900km of railway was constructed. Existing railways
Planning stage
Under construction
Palmas
Completed
Twin Ocean Railroad In operation
• China recently proposed a Brazil’s existing and planned railways4
5,300km, USD$10 billion railway N-S trunk line Ouro Verde
that would cut across the Minas de Goiás
Anapolis
Gerais, Goiás, Mato Grosso, the
Southern Amazon, and Peru.
Feasibility studies are underway.2
Estrela D’Oeste
• The railway would slash the cost of
shipping agricultural products to Panorama
Asia. Part of proposed
Twin Ocean route
• Critics worry that it would threaten
uncontacted Amazon tribes and the Chapeco
rainforest.3 Dashed lines =
planned railways
Rio Grande
Sources: (1) Ministério dos Transportes, 2014. (2) Lee, 2015; (3) Watts, 2015. (4) Ministério dos Transportes, via AgroIcone. 70You can also read