Assessment of downward draught in high-glazing facades in cold climates - experimental and CFD study into draught control with a 21-type radiator
←
→
Page content transcription
If your browser does not render page correctly, please read the page content below
E3S Web of Conferences 246, 02002 (2021)                                                                 https://doi.org/10.1051/e3sconf/202124602002
Cold Climate HVAC & Energy 2021

        Assessment of downward draught in high-glazing facades in
        cold climates – experimental and CFD study into draught control
        with a 21-type radiator
        Karl-Villem Võsa1*, Andrea Ferrantelli1, and Jarek Kurnitski3,1,2
        1
          Department of Civil Engineering and Architecture, Tallinn University of Technology, 19086 Tallinn, Estonia
        2
          Department of Civil Engineering, Aalto University, 00076 Aalto, Finland
        3
          Smart City Center of Excellence, Tallinn University of Technology, 19086 Tallinn, Estonia

                      Abstract. This paper investigates the interaction of a radiator’s thermal plume and downdraught of cold
                      glazed surfaces. Draughts in working areas are one of the most common thermal comfort complaints in
                      modern buildings. A typical solution for dealing with these draughts is positioning the heat emitters such as
                      radiators or convectors under the windows. However, with thermally efficient envelopes, the internal loads
                      compromise a relatively high fraction of the heating demand and the emitters are working under partial loads
                      in modern buildings. This study comprises two parts: an experimental phase in the EN442 standardized test
                      chamber with a 21-type radiator, and a CFD simulation phase, where the model is validated and applied
                      under an expanded set of boundary conditions. The expanded simulation set results provide preliminary
                      insight into sizing and design. More specifically, the thermal plume can be parametrised with a velocity and
                      temperature value along with the room air and glazing temperatures for a broader analysis and assessment
                      of the risk of draught.

        1 Introduction                                                           EN 16798-1:2019 [5] and the classic Fanger’s approach
                                                                                 [6]. These are aided by numerical simulations based on
        Thermal comfort constitutes a central topic in the                       Computational Fluid Dynamics (CFD), aimed at
        management of modern buildings, as it is closely related                 modelling the thermal environment inside the enclosure
        to the well-being of tenants; in office buildings, this is               in the presence of ventilation and draught. Their efficacy
        also strictly related to the productivity of employees [1],              in tracking the downdraught in function of the enclosure
        [2]. One of the biggest sources of complaint from the                    design has been proven by a number of validated studies
        occupants in working areas consists of indoor air                        (see e.g. [7], [8] and references quoted therein). For
        temperature fluctuations, thermal asymmetry and                          instance, it was shown a decade ago that even windows
        draught of cold air near the windows [2]. The latter is                  with low U-value can create thermal discomfort
        generally defined as air movement that induces an                        conditions if they are taller than 2m [9].
        unwanted cooling effect on the body [3]. It can                              Nevertheless, given the importance of describing the
        accordingly originate from personal or displacement                      physical processes in function of the enclosure design,
        ventilation systems, or occur as a downdraught from the                  the existing research efforts have not yet answered a
        cold windows, which is induced by buoyancy effects.                      very specific inquiry: how should a radiator located
            A typical solution for contrasting the formation of                  under a window be designed and sized in order to
        such downdraught is positioning heat emitters such as                    counteract the downdraught movement?
        radiators or convectors under the window, however this                       In this paper we attempt to answer this question by
        does not eliminate the problem per se. Unfortunately,                    performing both experiments and CFD simulations
        the most common procedure is overheating the space,                      specifically aimed at this goal. Field measurements of
        with higher supply air temperature than the design value                 temperature and velocity of the air surrounding a panel
        (for instance, 21°C instead of 17°C) [2].                                radiator installed close to a cold window were taken at
            An immediate drawback is clearly an increase in the                  the EN 442 test chamber, which is conforming to
        heating costs due to the air heating mode by means of                    European      standard      specifications [10].       The
        ventilation. Furthermore, air heating is well-known to                   experimental results were then used to calibrate and
        induce larger vertical temperature stratification in the                 validate CFD simulations performed with the software
        space, which is detrimental to thermal comfort [4].                      ANSYS Fluent [11], to investigate whether a specific
            Downdraught assessment towards thermal comfort                       range of inlet temperature made it possible to counteract
        is usually performed by following ISO 7730:2005 [3],                     the downdraught.

        * Corresponding author: karl-villem.vosa@taltech.ee

   © The Authors, published by EDP Sciences. This is an open access article distributed under the terms of the Creative Commons Attribution License 4.0
   (http://creativecommons.org/licenses/by/4.0/).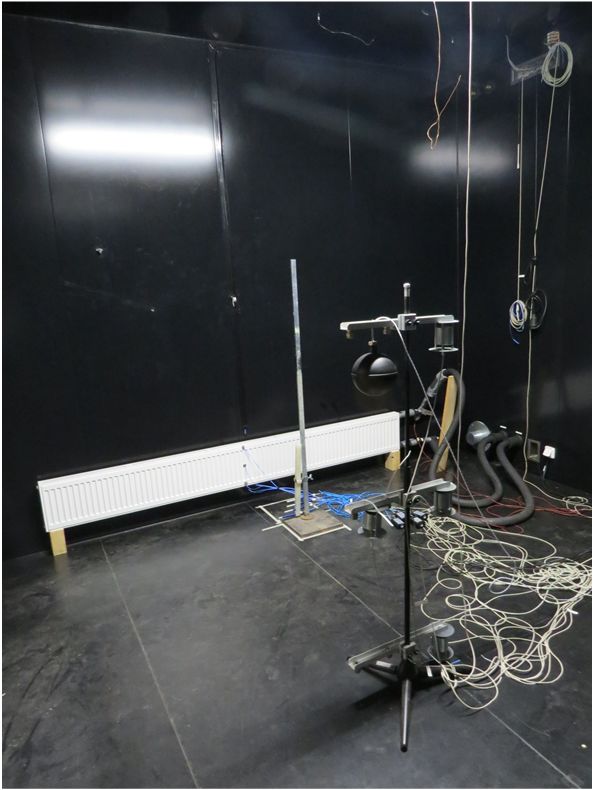
E3S Web of Conferences 246, 02002 (2021)                                                        https://doi.org/10.1051/e3sconf/202124602002
Cold Climate HVAC & Energy 2021

        Figure 1 View of the experimental set-up in Figure 2 Example of surface temperature Figure 3 Array of thermo-anemometers for
        the EN 442 test chamber.                    sensors. Radiator front surface sensors plume     velocity    and    temperature
                                                    shown in the picture.                   measurement.

       2 Methods                                                              The wall behind the radiator was chosen to imitate a
                                                                          glazed surface corresponding to a triple glazed window
       We investigated the interaction of the radiator’s thermal          on the building envelope. More specifically, the surface
       plume and the cold window draft in four distinct steps.            temperature boundary condition of 15 °C was chosen as
       First, we chose a radiator to study and established the            a reference for +20 °C internal air temperature and -20
       boundary conditions required for the experimental                  °C outdoor air temperature. The rest of the surface
       phase, based on typical Nordic conditions. Next, we                temperatures, that is the floor, ceiling, back wall and
       carried out a set of experimental measurements in the              side walls, were targeted to be identical to the indoor air
       EN 442 test chamber to serve as a reference and                    temperature of 20 °C. Water-side supply temperature of
       validation case for the CFD simulations. The                       40 °C was chosen for the radiator, with the expected
       measurements results were then used as boundary                    return temperature of around 33 °C and the exact value
       conditions in a CFD simulation in ANSYS Fluent. This               depending on the actual heat balance of the chamber.
       simulation model was fine-tuned to match the                       Our initial calculations estimated the radiator heat
       experimental velocity and temperature fields, then                 output to be 460 W based on these boundary conditions.
       extended to different inlet boundary conditions to                 Full overview of the boundary conditions is shown in
       investigate the behaviour of the thermal jets at lower             Table 2.
       heat outputs.
                                                                          Table 2 Boundary conditions of the experimental phase.
       2.1 Reference measurements
                                                                                     Boundary condition                  Value
           The experimental basis for this research comes from              Supply temperature                           40 °C
       a set of laboratory measurements concluded in February               Return temperature                           33 °C
       2020. These measurements were carried out in the EN                  Room air temperature                         20 °C
       442 test chamber [10]. A 21-type radiator with                       Wall temperature behind radiator             15 °C
       dimensions 2600 mm x 300 mm (see Table 1 below)                      Wall temperature of surrounding walls        ~20 °C
       was tested in steady state conditions.

       Table 1 Parameters of the radiator under study.                    2.2 Sensor positioning

                Radiator parameter                    Value                   The positioning of measurement sensors was
                        Type                           21                 chosen to characterise the thermal plume of the radiator
                       Height                      h=300 mm               along with the boundary conditions required for the later
                        Width                     w=2600 mm               CFD simulations. This meant that a finer grid of velocity
                Nominal heat output               Pnom=1979 W             and temperature measurements was necessary above the
                 Radiator exponent                  n=1.2803              radiator; each and every surface temperature needed to
           Logarithmic mean temperature                                   be measured as well. Ideally, more than one surface
                                                  Δtln=49.83°C            temperature sensor should be used for each surface.
          difference at nominal conditions
                                                                          However, due to practical limitations and to the special
                                                                          design on the EN 442 test chamber, a single temperature
                                                                          sensor was used for each enclosing surface.

                                                                     2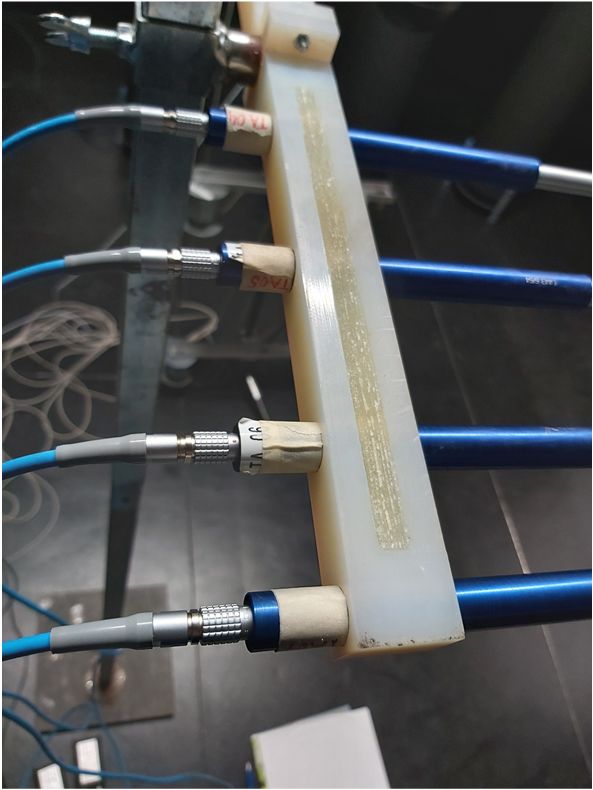
E3S Web of Conferences 246, 02002 (2021)                                                       https://doi.org/10.1051/e3sconf/202124602002
Cold Climate HVAC & Energy 2021

         Figure 4 Sensor setup in the test chamber – whole room.                          Figure 5 Sensor setup. Plan view.

                                                                         and sufficient to describe the underlying phenomena in
                                                                         sufficient detail. This assumption greatly reduced the
                                                                         risk of singular solutions, as well as the computing
                                                                         power necessary for residual convergence due to a
                                                                         considerably smaller number of mesh nodes than in 3D.
                                                                              The radiator itself was not modelled into detail; it
                                                                         was rather implemented as a velocity inlet and a pressure
                                                                         outlet together with the front surface of the radiator, as
                                                                         seen in Figure 7. The channel near the outlet was
                                                                         included for numerical stability only, the interior panels
                                                                         of the radiator have a zero heat flux boundary condition.
                                                                         The heat output of the radiator is thus characterized by
                                                                         the heat flux from the inlet and the sum of convective
                                                                         and radiation heat transfer from the front panel. This
                                                                         approach enables us to easily parametrize the thermal
                                                                         plume from the radiator.

       Figure 6 Sensor setup near the radiator. Multiple
       measurements positions were needed due to limited number of
       thermo-anemometers.

       Due to the constant cooling of all enclosing surfaces
       with embedded piping in the sandwich panel, the
       temperature variation along the surface is minimal,
       especially considering the high flow volumes and low
       temperature rises in the cooling water being used. For
       the radiator surface, a three-point measurement was
       taken instead. The detailed positioning of the sensors is
       shown in Figure 4, Figure 5 and Figure 6.

       2.3 CFD simulations
                                                                         Figure 7 Boundary conditions near the radiator.

       2.3.1 Reference case
       Ansys Fluent was used for the CFD simulations. We
       opted for a 2D simulation as the flow field near the
       central plane of the radiator should be well-developed

                                                                     3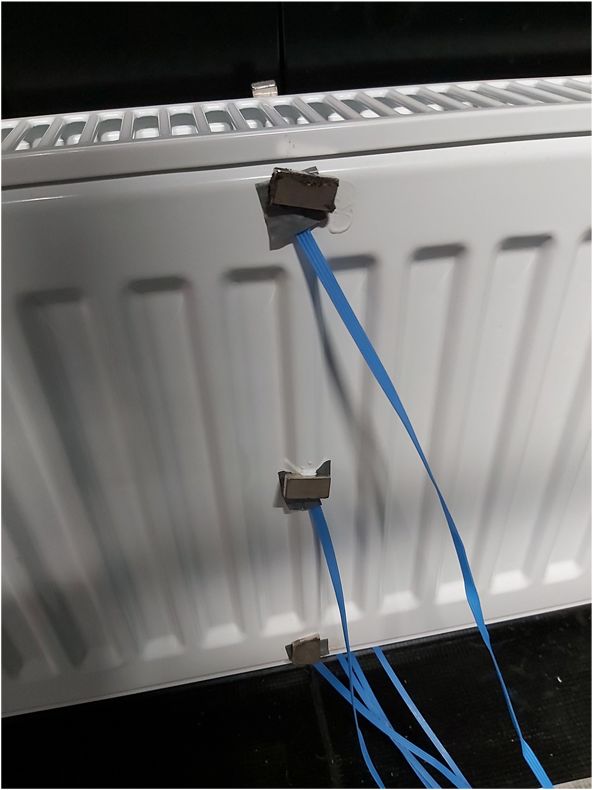
E3S Web of Conferences 246, 02002 (2021) https://doi.org/10.1051/e3sconf/202124602002
Cold Climate HVAC & Energy 2021
The standard k-ϵ turbulence model was chosen for
the flow modelling, as it is sufficiently robust and
accurate for this setup and range of fluid velocities. An
enhanced wall treatment model was used for the near-
wall flow modelling, with thermal effects and full
buoyancy effects enabled [11]. A Surface-to-Surface
radiation modelling was also added, with the inlet, outlet
and radiator interior surfaces being excluded from
irradiating surfaces and view factor calculations. For
buoyancy effects, the air was assumed to follow the
incompressible ideal gas law, with the operating
pressure at standard atmospheric pressure of 101 325 Pa.
It was necessary to introduce a source term Sh in the
energy equation to account for some fundamental
differences between the 2D and 3D setups:
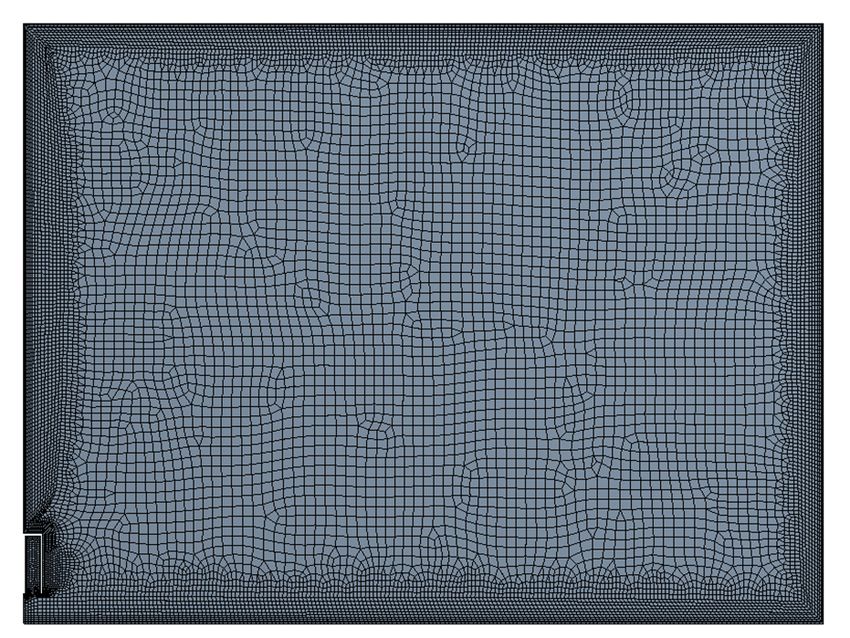
Figure 8 2D mesh for CFD calculations.
The generated 2D mesh consists of 15236 nodes and (1)
14913 elements (Figure 8). Inflation layers were used
near wall boundaries to achieve a y+
E3S Web of Conferences 246, 02002 (2021)                                                      https://doi.org/10.1051/e3sconf/202124602002
Cold Climate HVAC & Energy 2021

       Table 4 - Boundary and zone conditions for additional
       simulations.

                                        Source
                                                     Air
                      Inlet              term
        Simulation                              temperature,
                   temperature             Sh
           no.                                   volumetric
                       °C                value
                                              3  average °C
                                        W/m
              0
                           32.08          -4.0            20.14
         (reference)
              1            30.00          -3.7            20.13         Figure 10 Room air temperatures at different heights
              2            28.00          -3.0            20.07
              3            26.00          -2.0            20.03
              4            25.00          -1.8            19.94
              5            24.00          -1.3            19.97
              6            23.50          -0.3            20.08
              7            23.00          0.0             20.08
              8            22.00          0.3             19.94

       3 Results

       3.1 Experimental measurements
       The main results of the experimental measurements are
       captured in Figure 9 to Figure 12. On all figures, the
       mean values and standard deviations of the measured              Figure 11 Enclosing surface temperatures.
       parameter values are shown. These were calculated from
       a 45-minute period once steady-state conditions had
       been achieved in the laboratory. The laboratory
       measurements had very little variation, with standard
       deviation values up to only 0.16 °C. This provides an
       excellent basis for CFD analysis and comparison.
           It can be seen from Figure 13 that an upward thermal
       plume occurred during the measurements. A significant
       acceleration of the plume occurs after exiting the top
       grille of the radiator, with the exit velocity of around
       0.10 m/s and a peak velocity around 0.30 m/s near                Figure 12 Radiator surface temperatures.
       h=1.00 m. Also note the initial adherence of the jet to
       the cold wall and the gradual widening of its front at
       higher measurement points. The shape of this contour
       and the velocity values will be crucial for validating the
       CFD simulation results.

       Figure 9 Flow temperatures through the radiator.

                                                                        Figure 13 Measured velocity contour above the radiator.

                                                                    5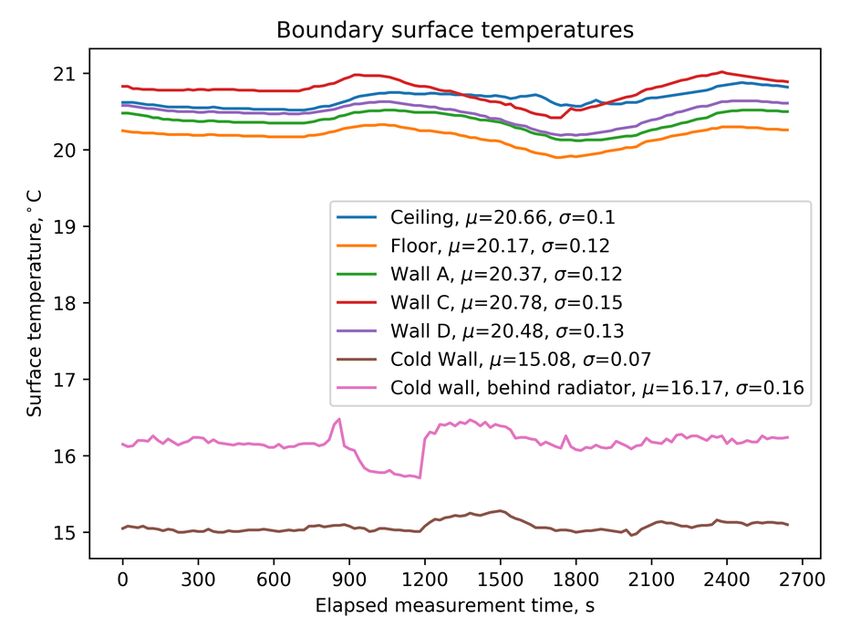
E3S Web of Conferences 246, 02002 (2021)                                                         https://doi.org/10.1051/e3sconf/202124602002
Cold Climate HVAC & Energy 2021

                                      Figure 14 Velocity contour of the reference case CFD simulation.

                                                                          the simulation. Furthermore, the flow-field itself is not
                                                                          actually constant, but fluctuates due to turbulence.
       3.2 CFD – reference case simulation
                                                                          Using mean values from the 45-minute measurement
       The CFD simulations show promising results as can be               period in the experiment and pseudo-transient method in
       seen in Figure 14. The behaviour of the plume near the             the CFD still makes the results comparable.
       radiator and cold wall is similar to that seen in the
       experimental phase. The attachment, acceleration and               Table 5 Air velocities at measurement points, experimental
                                                                          and CFD simulated values.
       gradual expansion of the jet is even more evident from
       the CFD result as the fine mesh provides greater detail
                                                                            Pos. Distance from boundary (mm)
       than a limited number of sensors in the experimental
                                                                            no. Air velocity, experimental/CFD (m/s)
       setup.
                                                                                                      50
           The numerical values for all measured values in the
       experimental setup were extracted from the CFD results                1                     0.04/0.03
       at the same locations. These results are summarized in                       10          45           80     115
       Table 5 and Table 6 below. The goal here was to match                 2   0.05/0.11 0.13/0.09 0.15/0.13 0.05/0.05
       the air temperature values at the middle two                                 10          60          130     200
       measurement points to those measured in the                           3   0.28/0.35 0.13/0.14 0.08/0.03 0.06/0.04
       experimental phase. In the CFD results, the jet is seen to            4   0.31/0.36 0.23/0.20 0.07/0.06 0.06/0.03
       develop in such a way that the temperature values at                  5   0.26/0.35 0.28/0.25 0.14/0.11 0.07/0.04
       h=1.30 m are slightly lower than at h=0.75 m. This is                 6   0.14/0.32 0.25/0.28 0.21/0.15 0.13/0.06
       due to the 1.30 m point being in a more stagnant region
       of the stream, while the 0.75 m point is at the end of the         Table 6 Room air temperatures in the middle of the room,
       jet from the radiator, after having travelled along the            experimental versus CFD simulated values.
       cold wall, ceiling and back wall. Accordingly, the
       thermal gradient within the room does not perfectly                                                   Air temperature
                                                                              Measurement height
       match that of the one in the experimental setup.                                                     Experimental/CFD
                                                                                     (m)
       However, the temperature difference between the                                                             (°C)
       ceiling and floor is similar, 0.82 °C in the experiment                         0.05                    19.99/19.57
       and 0.95 °C in the simulation.                                                  0.75                    20.20/20.25
           There of course exists some variation in the velocity                       1.30                    20.34/20.20
       values due to the crude way the radiator is modelled in                         2.95                    20.81/20.52

                                                                     6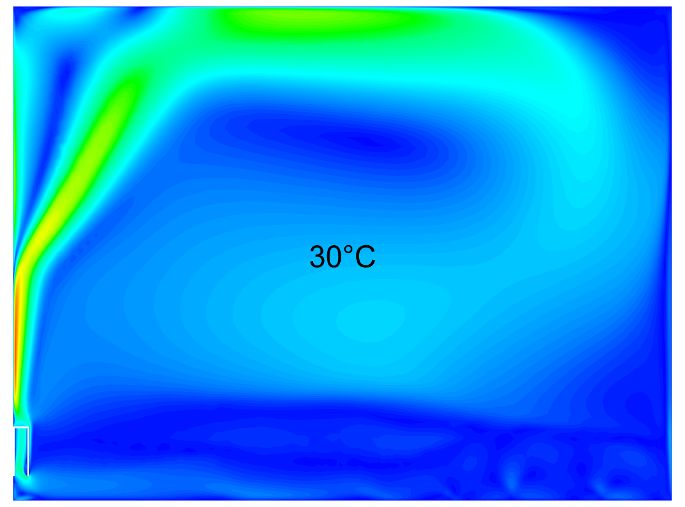
E3S Web of Conferences 246, 02002 (2021)                                                               https://doi.org/10.1051/e3sconf/202124602002
Cold Climate HVAC & Energy 2021

       Figure 15 Series of velocity contours for decreasing inlet and radiator front surface temperatures.

       3.3 CFD – additional simulations                                        The immediate implication is that we could run a steady
                                                                               state simulation without loss of phenomenological
       The progression of the thermal plume with decreasing                    accuracy. Parametrising the heat output of the radiator
       inlet temperatures is shown in Figure 15. From inlet                    in our simplified method also allowed us to model the
       temperature 32 to 30 °C, we notice that the detachment                  interaction of thermal plumes without great
       height of the plume is lower, and that the velocity                     computational cost.
       dissipates faster. Notice that the velocity vectors near                     The development of the downdraught occurred
       the cold wall are downward. We see a further decrease                   around the inlet temperature of 23.5 °C. This
       in the detachment heigh and even lower velocities at                    corresponds to 30% of the heat output from the
       inlet temperatures from 28 °C to 25 °C. At 24 °C, the jet               experimental setup. In other words, at the experimental
       deflects just as it leaves the top grille towards the room.             boundary conditions, the downdraught develops when
       At inlet temperature 23.5 °C, the downward draft from                   there is a 70% internal heat gain load relative to the heat
       the cold wall overcomes the thermal plume from the                      losses, e.g. from occupants, devices or solar gains.
       radiator and we see that the jet turns downwards and                         It is also noteworthy that the inlet temperature has a
       towards the floor as it exits the top of the radiator grille.           considerably higher impact on the peak velocity and the
       There are no significant changes when going down to                     development of the jet relative to the initial velocity of
       inlet temperatures of 23 and 22 °C.                                     the plume. The bigger temperature difference between
                                                                               the inlet and room air temperature means there is a
       4 Discussion                                                            bigger induction air volume near the plume.

       As remarked in Section 3.1, the measurements in the
       European standard chamber provided a tight data                         5 Conclusions
       distribution with a very small variance; the controlled                 In this study, we investigated the downdraught from
       environment thus allowed for some precise validation                    cold window surfaces and its interaction with thermal
       and calibration of the model (Table 3 and Table 5).                     plumes from a 21-type radiator. We compared CFD
                                                                               simulation results from FLUENT ANSYS to our

                                                                          7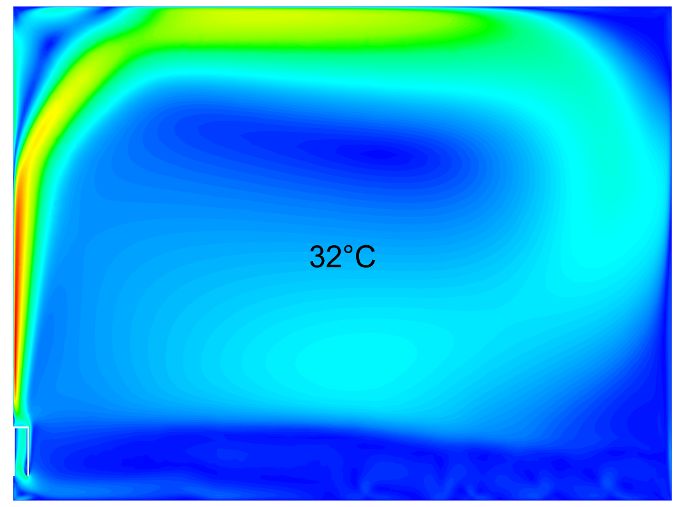
E3S Web of Conferences 246, 02002 (2021) https://doi.org/10.1051/e3sconf/202124602002
Cold Climate HVAC & Energy 2021
experimentally measured flows and conducted an Interpretation of Thermal Comfort Using
extended set of simulations with different thermal plume Calculation of the PMV and PPD Indices and
temperatures. We found that, at the specified boundary Local Thermal Comfort Criteria,” International
conditions, the downdraught is counteracted by the Organization for Standardization, Geneva,
radiator plume for inlet temperatures above 23.5 °C. Switzerland, 2005.
Within this study, only the effect of inlet temperature [4] M. Maivel, A. Ferrantelli and J. Kurnitski ,
under fixed boundary conditions was analysed. The “Experimental determination of radiator,
same approach can be expanded to include the underfloor and air heating emission losses due to
parametrisation of the cold wall temperature and room stratification and operative temperature
temperature. For future research, we propose to study variations,” Energy And Buildings, vol. 166, pp.
the behaviour of the plume interaction as a combination 220-228, 2018.
of the following parameters:
room (average) air temperature tair [5] CEN, “EN 16798-1:2019,” European Committee
for Standardization, Bruxelles, Belgium, 2019.
inlet temperature over air temperature Δtin
cold wall temperature under air temperature [6] P. Fanger, A. Melikov, H. Hanzawa and J. Ring,
Δtwall “Air turbulence and sensation of draught,”
inlet velocity vin Energy And Buildings, vol. 12, pp. 21-39, 1988.
Using the temperature differences as parameters [7] X. a. T. Z. Deng, “Numerical analysis of local
offers greater flexibility and better describes the thermal comfort in a plan office under natural
phenomena. An extensive parametric study could ventilation,” Indoor and Built Environment, vol.
describe the plume conditions required to avoid 29, no. 7, pp. 972-986, 2020.
downdraught and offer key insight into dimensioning [8] D. Markov, N. Ivanov, G. Pichurov, M.
and selection for heat emitters, especially under partial Zasimova and et al., “On the Procedure of
heating loads. Draught Rate Assessment in Indoor Spaces,”
Furthermore, the parametrisation of the boundary Applied Sciences, vol. 10, no. 15, p. 5036, 2020.
conditions with our simple model is a viable method for
[9] A. Jurelionis and E. Isevičius, “CFD predictions
an extended study of the phenomena. For future
of indoor air movement induced by cold window
research, such an extended study could describe the
surfaces,” Journal of Civil Engineering and
thermal plume parameters, and by implication, the
Management, vol. 14, no. 1, pp. 29-38, 2008.
design and sizing of the radiator required to minimize
the risk of downdraught. [10] CEN, “EN 442-2:1996/A2:2003, Radiators and
Finally, we remark that the EN 442 test chamber is a Convectors Part 2: Test Methods and Rating,”
controlled environment. It would be thus valuable to CEN, Brussels, Belgium, 2003.
extend the current setup to a dynamic assessment that [11] ANSYS, “ANSYS Workbench User's Guide,”
would account for transient thermal processes induced 2020. [Online]. Available:
by varying solar radiation and occupancy. http://orange.engr.ucdavis.edu/Documentation12
.1/121/wb2_help.pdf.
This research was supported by Purmo Group and the Estonian
[12] A. Li, “Extended Coanda Effect and attachment
Centre of Excellence in Zero Energy and Resource Efficient
Smart Buildings and Districts ZEBE, grant 2014-
ventilation,” Indoor and Built Environment, vol.
2020.4.01.15-0016, funded by the European Regional 28, no. 4, pp. 437-442, 2019.
Development Fund. We thank Mikko Iivonen from Purmo
Group for all help in laboratory measurements arrangements.
References
[1] I. Balazova, G. Clausen, J. H. Rindel, T. Poulsen
and D. . P. Wyon, “Open-plan office
environments: A laboratory experiment to
examine the effect of office noise and
temperature on human perception, comfort and
office work performance,” in Indoor Air 2008,
Copenhagen, Denmark, 2008.
[2] M. Kiil, A. Mikola, M. Thalfeldt and M.
Kurnitski, “Thermal comfort and draught
assessment in a modern open office building in
Tallinn,” in E3S Web of Conferences 111, 02013
(2019), Bucharest, Romania, 2019.
[3] E. I. 7. ISO, “Ergonomics of the Thermal
Environment - Analytical Determination and
8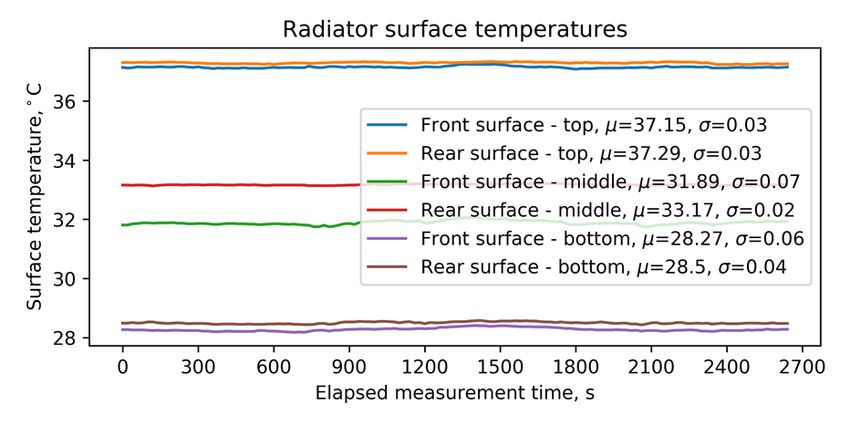

You can also read


