Assessing agriculture's vulnerability to drought in European pre-Alpine regions - NHESS
←
→
Page content transcription
If your browser does not render page correctly, please read the page content below
Nat. Hazards Earth Syst. Sci., 23, 45–64, 2023
https://doi.org/10.5194/nhess-23-45-2023
© Author(s) 2023. This work is distributed under
the Creative Commons Attribution 4.0 License.

Assessing agriculture’s vulnerability to drought in
European pre-Alpine regions
Ruth Stephan1 , Stefano Terzi2,3,4 , Mathilde Erfurt1 , Silvia Cocuccioni2 , Kerstin Stahl1 , and Marc Zebisch2
1 Faculty  of Environment and Natural Resources, University of Freiburg, Tennenbacher Str. 4, 79085 Freiburg i. Br., Germany
2 Institute for Earth Observation, Eurac Research, Viale Druso 1, 39100 Bolzano, Italy
3 Center for Global Mountain Safeguard Research, Eurac Research, Viale Druso 1, 39100 Bolzano, Italy
4 Institute for Environment and Human Security (UNU-EHS), United Nations University,

Platz der Vereinten Nationen 1, 53113 Bonn, Germany

Correspondence: Ruth Stephan (ruth.stephan@hydrology.uni-freiburg.de)

Received: 3 August 2022 – Discussion started: 12 August 2022
Revised: 5 December 2022 – Accepted: 22 December 2022 – Published: 12 January 2023

Abstract. Droughts are natural hazards that lead to se-           drought that could enable better preparedness. Apart from
vere impacts in the agricultural sector. Mountain regions are     region-specific differences, in both study regions the pres-
thought to have abundant water, but have experienced un-          ence of irrigation infrastructure and soil texture are among
precedented drought conditions as climate change is affect-       the most important conditions that could be managed to
ing their environments more rapidly than other places. The        some extent in order to decrease the regions’ vulnerability.
effect radiates by reducing water availability well beyond        Throughout the analyses, the study benefited from the ex-
the mountains’ geographical locations. This study aims to         change with the experts by getting an in-depth understanding
improve the understanding of agriculture’s vulnerability to       of the regional context with feedback relations between the
drought in Europe’s pre-Alpine region, considering two case       factors contributing to vulnerability. Qualitative narratives
studies that have been severely impacted in the past. We ap-      provided during the semi-structured interviews supported a
plied a mixed-method approach combining the knowledge             better characterization of local vulnerability conditions and
of regional experts with quantitative data analyses in order      helped to better identify quantitative indicators as proxies to
to define the region-specific vulnerability based on experts’     describe the selected vulnerability factors. Thus, we recom-
identified factors. We implemented two aggregation meth-          mend applying this mixed-method approach to close the gap
ods by combining the vulnerability factors that could be sup-     between science and practitioners.
ported with subregional data. Whereas the equal weighting
method combines all factors with the same weight, the ex-
pert weighting method combines the factors with varying
weight based on the expert’s opinion. These two methods re-       1   Introduction
sulted in vulnerability maps with the expert weighting show-
ing a higher vulnerability, and partly relocating the medium      Past and recent droughts have led to severe environmental,
and lower vulnerabilities to other subregions within the case     social, and economic impacts in many regions of the world.
study regions. In general, the experts confirmed the result-      The combination of climate change exacerbation and the ris-
ing subregions with higher vulnerability. They also acknowl-      ing pressures on water demand from socio-economic activ-
edged the value of mapping vulnerability by adopting differ-      ities affects the intensity and frequency of drought condi-
ent aggregation methods confirming that this can serve as a       tions (Van Loon et al., 2016; IPCC, 2022). This is partic-
sensitivity analysis. The identified factors contributing most    ularly relevant in mountain regions where climate change
to the regions’ vulnerability point to the potential of adap-     effects are occurring more rapidly than in other places,
tation strategies decreasing the agriculture’s vulnerability to   with consequences on their water tower role and water pro-
                                                                  vision to downstream areas (Beniston and Stoffel, 2014;

Published by Copernicus Publications on behalf of the European Geosciences Union.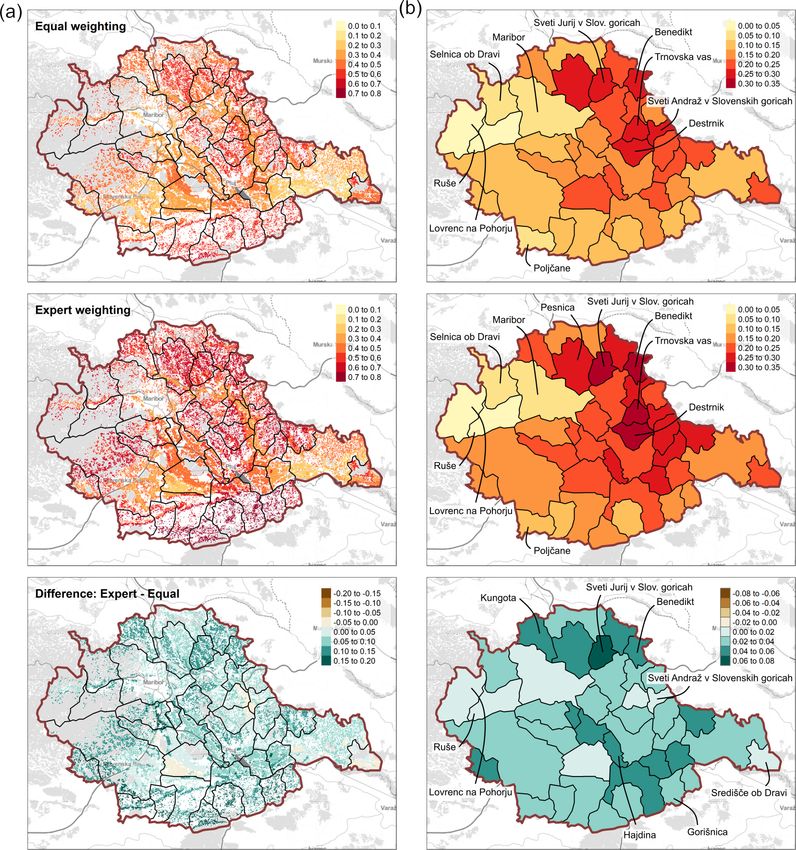
46                     R. Stephan et al.: Assessing agriculture’s vulnerability to drought in European pre-Alpine regions

Immerzeel et al., 2020; Terzi et al., 2021). Recent drought        are freely available. Additionally, data on past drought im-
events highlighted the vulnerability of the European Alps and      pacts are also often only available on a large scale but are
areas dependent on water from the Alps such as pre-Alpine          necessary for an effective validation of the assessment. Re-
regions to unexpected conditions of reduced water availabil-       gional datasets on socio-economic conditions are indeed of-
ity (Hanel et al., 2018; Laaha et al., 2017). Stephan et al.       ten lacking, leading to an underrepresentation or omission of
(2021) showed that within the European Alps a wide range           regional risk conditions. Therefore, regional or local studies
of drought impacts occurred in different socio-economic sec-       often follow a qualitative approach to assess vulnerability,
tors, with agriculture and the public water supply most im-        e.g. by involving the local communities in the process of un-
pacted.                                                            derstanding the vulnerability dimensions (Ayantunde et al.,
   Drought impacts are triggered by the natural hazard it-         2015; Birhanu et al., 2017; Martin et al., 2016). The results
self, such as the intensity, duration, frequency, and extent of    of these two approaches have rarely been combined or com-
water deficits, but local exposure and vulnerability charac-       pared.
teristics shape them (Hagenlocher et al., 2019). While the            For these reasons, this study considers the impact chains
drought hazard components have been investigated and a set         (IC), a mixed-method approach recognized as a valuable
of indices are already established and available to describe       methodology to integrate both quantitative and qualitative in-
hydroclimatic variations in terms of precipitation (e.g. SPI)      formation into the description of the hazard, exposure, and
and evapotranspiration (e.g. SPEI) in the Alpine region (e.g.      vulnerability components for advancing the assessments of
Haslinger and Blöschl, 2017), the characterization of drought      drought risk conditions (Schneiderbauer et al., 2020; Ze-
vulnerability and exposure still remains a challenge. Multi-       bisch et al., 2021). The IC provides a guideline to system-
ple conceptual frameworks of vulnerability in the context of       atically identify, select, and assess relevant factors involved
natural hazard assessments have been developed (Birkmann           in risk processes through the combination of quantitative data
et al., 2013; González Tánago et al., 2016). The Intergovern-      with information coming from local experts and stakeholders
mental Panel on Climate Change (IPCC) provides the risk            (GIZ and EURAC, 2017). This process is particularly impor-
concept definition, where exposure refers to “the presence         tant for evaluations of the vulnerability and exposure com-
of people, livelihoods, species or ecosystems, environmen-         ponents since no standard set of factors exists to identify and
tal functions, services, and resources, infrastructure, or eco-    characterize vulnerability to drought in agriculture.
nomic, social, or cultural assets in places and settings that         Besides the identification of vulnerability factors, expert
could be adversely affected” by a drought hazard and vul-          knowledge is used to weigh different factors in the map-
nerability refers to the “the propensity or predisposition to      ping of an overall vulnerability index (Zebisch et al., 2021).
be adversely affected” (IPCC, 2012, p. 1048) due to the sys-       This is often adopted when certain factors are perceived to
tem’s sensitivity or susceptibility combined with a lack of        be more important than others and thus have a greater (or
short-term coping capacity and long-term adaptive capacity.        lesser) influence on the overall vulnerability. In the context
In case of drought risk assessments, an example of a short-        of impact chains, equal weighting is applied more often than
term coping capacity is the existence of an irrigation system      other weighting methods. Moreover, a comparison of differ-
to reduce agricultural impacts, while the development of an        ent weighting methods in order to analyse the effect of such
agricultural system increasing the water use efficiency refers     choice on the final vulnerability assessment has rarely been
to a long-term adaptive capacity. Although exposure and vul-       done.
nerability are internationally recognized as important drivers        This study applies a vulnerability assessment approach in
of drought risk processes and final impacts, their operational     two case studies located in the European pre-Alpine region.
assessment is still discussed and in development. In particu-      The case study regions “Thurgau” in Switzerland and “Po-
lar, drought vulnerability studies for pre-Alpine areas char-      dravska” in Slovenia have experienced severe drought im-
acterized by heterogeneous conditions are rare, possibly due       pacts in recent years and need to improve their resilience
to data limitations. So far studies exist on the aspects of vul-   (Zorn and Hrvatin, 2015; Komac et al., 2019; DROUGHT-
nerability in forest growth and for impacts on pasture (e.g.       CH, 2022). The overarching objective is to systematically
Hartl-Meier et al., 2014). Melkonyan (2014) carried out a          identify vulnerability factors linked to agricultural produc-
study to assess socio-economic vulnerability of the agricul-       tion that can contribute to impacts during a drought. By doing
tural sector in the mountainous region of Armenia.                 so, we aim to assess how factors vary spatially in the consid-
   Moreover, various approaches have been applied often re-        ered study regions and analyse the region-specific character
lying on either quantitative or qualitative data and hence cov-    of vulnerability.
ering only specific aspects of drought risk processes. The            Subordinate methodological research questions are as fol-
selection of the underlying approach often depends on the          lows:
study’s spatial scale, as well as on the data availability. Most
studies that adopt a quantitative approach focus on the large        – To what degree can we characterize vulnerability to
scale (e.g. national or global level; Meza et al., 2020; Carrão        drought in the two case studies by combining experts’
et al., 2016), where datasets on socio-economic conditions             opinions with the openly accessible data?

Nat. Hazards Earth Syst. Sci., 23, 45–64, 2023                                       https://doi.org/10.5194/nhess-23-45-2023
R. Stephan et al.: Assessing agriculture’s vulnerability to drought in European pre-Alpine regions                            47

    – How sensitive is the final vulnerability assessment to      ch/, last access: 10 August 2022). This study region cov-
      different weighting methods for the vulnerability fac-      ers 991.77 km2 , 54 % of which are covered by agricultural
      tors?                                                       land (Fig. 1; CLC, 2022), with a total of 2531 farms in
                                                                  2019. The main agricultural type (51 %) consists of nat-
                                                                  ural meadows and pastures, followed by cropland (33 %),
2    Case study areas                                             managed meadows (9 %), and vegetables, fruit, vines, and
                                                                  berries (6.5 %) (LID, 2007). Thurgau had 279 547 inhabi-
We selected the two study regions of Thurgau in Switzerland       tants in 2019 (SFSO, 2022) resulting in a population den-
and Podravska in Slovenia due to the increasing number of         sity of 324 inhabitants km−2 . Podravska’s landscape varies
reported drought impacts in agriculture in both regions, de-      from hilly lowlands mainly along the river Drava up to
spite their proximity to the water-rich conditions in the Eu-     1517 m.a.s.l. in the western mountainous part. The region
ropean mountainous regions (Stephan et al., 2021). Most im-       covers an area of 2170 km2 , more than double the size
pacts archived in the Alpine Drought Impact report Inven-         of Thurgau. In 2019, the region had 324 875 inhabitants
tory (EDIIALPS ) report consequences on agriculture and live-     and thus a lower population density (149.7 inhabitants km−2 )
stock farming, highlighting the agricultural sector of both re-   than Thurgau (“population” from SURS, 2022). In Podravska
gions as vulnerable to drought in the past. According to the      more than 30 % of the total area is utilized as agricultural
EDIIALPS , in Thurgau most impacts occurred in 2015 and           land with a total of 10 990 agricultural holdings in 2016, and
2018, whereas in Podravska most impacts occurred in 2003          almost one third of these are located in mountainous areas
and 2017. In Thurgau, reports claimed a reduced productiv-        (“agriculture, forestry and fishery” from SURS, 2022).
ity of annual and permanent crop cultivation and shortages
of feed and water for livestock as the majority of the regions’
drought impacts. For example, the EDIIALPS archives an ar-
                                                                  3     Data and methods
ticle with a comment from a local farmer in Stettfurt about
the significant crop failures:
                                                                  This study applies a mixed-method approach based on qual-
      Production was down by 30 to 40 %. Especially               itative and quantitative information for the assessment of
      iceberg lettuce had to be irrigated, because they           the agriculture’s vulnerability to drought conditions in the
      were sensitive to the drought due to their small root       case studies regions Thurgau and Podravska. Following the
      system. Irrigation had to be done even at night, so         guidelines of the vulnerability sourcebook (Fritzsche et al.,
      water from the Stettfurt public utility company had         2014), our study approach was based on an initial exploratory
      to be used in part, which was much more expen-              phase during the ADO project meeting held online on the
      sive than the water from the Lauche River that he           24 September 2020. During the group discussion, experts
      usually used.                                               from both study areas provided a first regional overview of
                                                                  the drought issues through the creation of impact chains fol-
   In Podravska the reports are clearly dominated by re-          lowing the model by Zebisch et al. (2021). For this study
duced productivity of annual crop cultivation, often with         we then considered these impact chains as context for fur-
yield losses ≥ 30 %. For example, the Drought Management          ther discussions and refinements focusing on the vulnerabil-
Centre for Southeastern Europe stated in 2017, “Agricultural      ity factors and their characteristics. Starting from this con-
drought [. . . ] worsened over June and July. Most affected       text, the methodological approach presented here is com-
were regions of northeastern and southern half of Slovenia        posed of five consequential phases for the assessment of
where maize completely stopped. [. . . ] yield was reduced        vulnerability considering its spatial variability within both
by 30–50 %. Hay production was seriously affected as well.”       case study regions: (1) identification of vulnerability fac-
(DMCSEE, 2017).                                                   tors (Sect. 3.1), (2) data acquisition and indicators selection
   Both Thurgau and Podravska are characterized by ex-            (Sect. 3.2), (3) pre-processing, normalization, and direction
tensive areas of agricultural land (Fig. 1) that make them        (Sect. 3.3), (4) weighting and aggregating (Sect. 4.4), and
particularly exposed to drought conditions, while showing         (5) participatory validation (Sect. 3.5, Fig. 2).
different societal and economic conditions influencing the
vulnerability of the agricultural sector. Moreover, they are      3.1    Identification of vulnerability factors
also part of the Alpine Drought Observatory (ADO, https:
//www.alpine-space.org/projects/ado, last access: 10 August       The set of factors used to describe vulnerability to drought
2022), an Interreg project aiming to improve the understand-      in agriculture was generated through semi-structured inter-
ing of drought processes and impacts towards increasing           views with nine high-level experts identified as key people
levels of drought preparedness through monitoring. Thur-          with extensive expertise and knowledge on the two case stud-
gau is known for its agriculturally shaped landscape reach-       ies, and they were held from the 24 August to 9 September
ing from specialty crops on the coast of Lake Constance to        2021. Each discussion followed a flexible interactive struc-
high elevation pastures (https://www.landschaftsqualitaet-tg.     ture (reported in Sect. S1 in the Supplement) allowing it to

https://doi.org/10.5194/nhess-23-45-2023                                       Nat. Hazards Earth Syst. Sci., 23, 45–64, 2023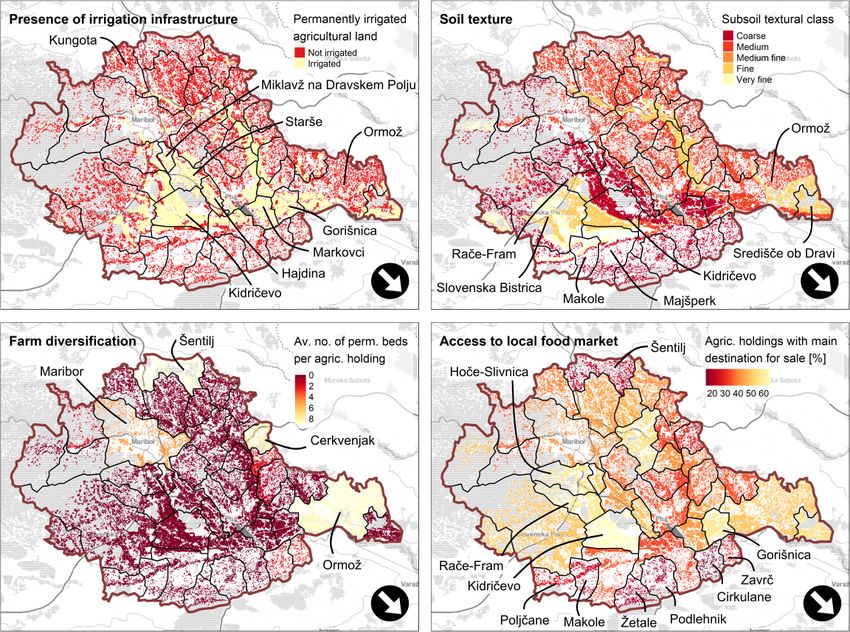
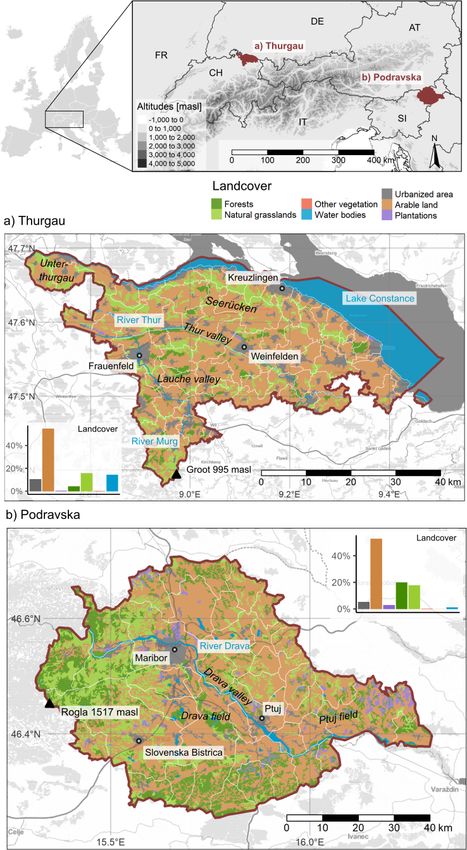
48                      R. Stephan et al.: Assessing agriculture’s vulnerability to drought in European pre-Alpine regions

Figure 1. The two study regions (a) Thurgau and (b) Podravska within the European mountain region. The political border of the study
regions is marked in red, and the LAU2 regions are marked with white. The black labels present the most important cities and common
known subareas (italic). The blue labels present the largest important rivers and lakes. The colours present the regional land cover adapted
and modified by the Corine Land Cover (CLC, 2022). The land cover’s share is shown in the histograms.

Nat. Hazards Earth Syst. Sci., 23, 45–64, 2023                                              https://doi.org/10.5194/nhess-23-45-2023
R. Stephan et al.: Assessing agriculture’s vulnerability to drought in European pre-Alpine regions                                      49

Figure 2. Conceptual overview of the methodological steps for the drought vulnerability assessment. The grey box represents the preliminary
group discussion on agricultural drought while the green boxes refer to the five consequential phases for a spatial assessment of drought
vulnerability.

integrate the established questions with further information            able. If two different sources offered the same dataset to de-
on the context and expertise from each participant. The in-             scribe suitable indicators we prioritized the most recent and
terviews aimed to identify the perceived factors making the             local dataset, as we aimed for current data with a spatial res-
regions’ agriculture vulnerable to drought and whether these            olution as high as possible and at least with a subregional
factors increase or decrease the vulnerability. Throughout the          resolution of LAU1 regions.
whole assessment we considered only those factors that had
been identified by the involved experts in order to account for         3.3   Pre-processing, normalization, and direction
their knowledge on factors relevant to the regions. Further,
the participants assigned an importance to each of the iden-            Depending on the type of data and data availability, we gath-
tified factors from a low–medium–high scale of relevance.               ered continuous and categorical data for both study regions.
Finally, at the end of each interview we gathered information           We transformed the categorical data into (a) continuous data
from the participants on which quantitative indicators from             by ordering the categories, or into (b) presence–absence data
local biophysical and socio-economic datasets they deemed               with the presence of the most important category according
suitable to describe the spatial characteristics of the identified      to the responses of the interview participants. In order to fa-
factors.                                                                cilitate the analyses all available datasets were rasterized to
                                                                        grid data with the boundaries of Thurgau and Podravska and
3.2   Data acquisition and indicator selection                          their region-specific projection. Thus, we gathered one raster
                                                                        layer for each indicator (ri ) representing the factor quantita-
In order to quantitatively describe the identified vulnerability        tively, if subregional data are available.
factors, we scanned the datasets proposed by the interviewed               In the next step, we directed ri according to the increas-
participants to select suitable indicators matching the mean-           ing and decreasing effect on the regions’ vulnerability re-
ing of each factor. In addition, we searched databases from             sulting from the interviews with the experts, similar to Meza
authorities at regional (e.g Amt für Geoinformation Thurgau,            et al. (2020). We transformed indicator layers with presence–
2022), national (e.g. Swiss Federal Statistical Office, SFSO,           absence data to values of “1” if presence has an increasing ef-
2022; Statistical Office of the Republic of Slovenia, SURS,             fect and to values of “0” if absence has an decreasing effect.
2022) to the European scale (e.g. European Environment                  Regarding the other indicator layers, we multiplied ri with
Agency, EEA, 2022; European Soil Data Centre, ESDAC,                    “+1” if the indicator increases the vulnerability, or we mul-
2022). Data availability and accessibility proved highly vari-          tiplied the values of ri with “−1” if the indicator decreases

https://doi.org/10.5194/nhess-23-45-2023                                             Nat. Hazards Earth Syst. Sci., 23, 45–64, 2023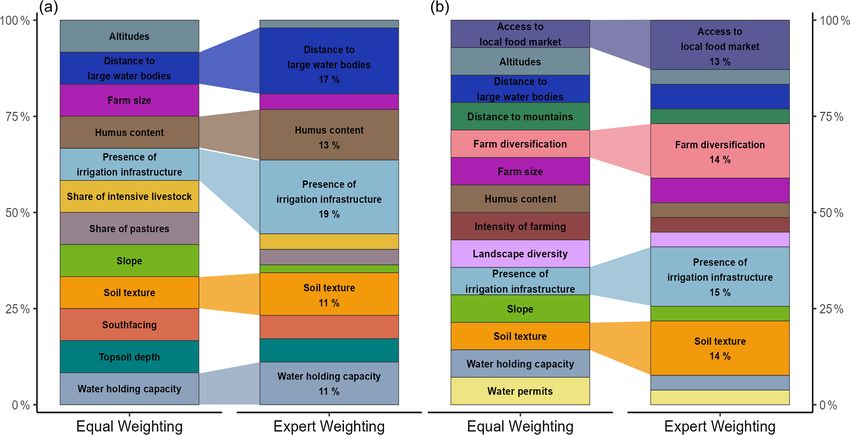
50                        R. Stephan et al.: Assessing agriculture’s vulnerability to drought in European pre-Alpine regions

the vulnerability. Then, we normalized the directed indicator          To gather Vex , we used the importance rating Impr by the
layers to account for different value ranges and units. Both        interview participants from the low–medium–high scale and
steps are applied as follows:                                       the frequency, how often a factor was named. We weighted
                   ri − minri                                       each corresponding indicator i with the expert-weight wiex as
rid,norm = ri d                 ,                                   follows:
                  maxri − minri                                               X            pi,r
with rid,norm ∈ [0, 1] and d ∈ {−1, 1},                      (1)    wiex =            Impr       ,                            (4)
                                                                            i∈{1,2,3}
                                                                                           W tot
where rid,norm represents the directed and normalized indica-       Wtot =
                                                                                X          X
                                                                                                  Impr pi,r ,                 (5)
tor layer, ri represents the indicator layer with the original               i∈{1,2,...,n} i∈{1,2,3}
values from its data source(s), d represents the direction fac-
tor in order to assign an increasing “+1” or decreasing “−1”        where wiex represents the experts’ weight of indicator i,
effect, minri represents the minimum value across ri , and          Impr represents the importance rate on the low–medium–
maxri represents the maximum value across ri . That means           high scale translated into the integers 1–2–3, pi , r represents
rid,norm presents with “0” the lowest possible vulnerability ac-    the number of the experts who weighted indicator i with the
cording to the indicator layer ri and with “1” the highest          weight r. Wtot represents the total weight assigned to all in-
possible vulnerability according to the indicator layer ri . All    dicators, and n represents the total number of all indicators.
other values are transformed in-between with increasing val-        Analogue to the equal weighting method, we weighted each
ues representing increasing vulnerability.                          indicator layer rid,norm with the corresponding weight wiex and
                                                                    summed up these weighted raster layers to calculate Vex as
3.4   Weighting and aggregation                                     follows:
                                                                              X                              X
                                                                    Vex =             rid,norm wiex , with        wiex = 1.      (6)
We applied two different weighting methods to calculate the
                                                                            i∈{1,2,...,n}                  i∈{1,2,...,n}
vulnerability index V : the equal-based weighting method
(Veq ) and the expert-based weighting method (Vex ). For each       3.5    Participatory validation
method the assigned weights to the indicators sum up to 1,
and thus can be seen as proportional weights dependent on           In order to validate the results, we conducted one group in-
the method. We aggregated the weighted indicators by sum-           terview involving the previously consulted experts for each
ming them up. Practically, we added the weighted raster lay-        case study. We held the group interviews between the 10
ers corresponding to the indicators for each method. Accord-        and 21 June 2022 following the same structure (reported
ing to Fig. 1 the agricultural land is very heterogeneously dis-    in Sect. S2). Firstly, we asked the experts to identify the
tributed, wherefore we masked the summed indicators with            most and least vulnerable subregions across Thurgau and
the region-specific agricultural land by setting to zero the in-    Podravska based on their past experiences in dealing with
dicators’ values in non-agricultural areas. By doing so, we         drought events. Secondly, we presented the maps display-
accounted for the density of agricultural areas over the whole      ing the most important vulnerability factors and asked their
area within each LAU2 region in the next step. We aggre-            opinions on the differences displayed across the study re-
gated the summed indicators at each LAU2 region within              gions. Thirdly, we presented the final (aggregated) vulner-
Thurgau and Podravska, calculating mean values of vulner-           ability maps according to the two weighting methods, and
ability for each LAU2 region. The final maps enable a com-          we asked for feedback on both the most and least vulnerable
parison of the two weighting methods for both study regions.        regions. Finally, we asked them to provide their opinion on
The above described weighting methods are specified in the          the differences between the maps based on the two weighting
following.                                                          methods and which one provides a better description of real
   For Veq we assigned to each indicator i the same weight          drought vulnerability conditions in agriculture.
wieq as follows:
          X                              X                          4     Results
Veq =             rid,norm wieq , with          wieq = 1,    (2)
       i∈{1,2,...,n}                 i∈{1,2,...,n}
                                                                    4.1    Factors and indicators describing the
           X                1                                              region-specific vulnerability
Veq =               rid,norm ,                               (3)
      i∈{1,2,...,n}
                            n
                                                                    During the semi-structured interviews the experts named in
where n represents the total number of all factors, rid,norm rep-   total 31 unique factors describing vulnerability to agricul-
resents the directed and normalized indicator layer (Eq. 1),        tural drought impacts (see Table 1). The experts identified 10
and wieq represents the weight of indicator i that equals in        common factors for both study regions, whereas they identi-
this method to n1 . In Eq. (3) we aggregated the weighted           fied 6 factors solely for Thurgau and 13 factors solely for Po-
rasters by summing them up to the equal-based vulnerabil-           dravska (Fig. S1). The common factors were altitudes, dis-
ity method Veq .                                                    tance to large water bodies, share of drought resistant crop

Nat. Hazards Earth Syst. Sci., 23, 45–64, 2023                                              https://doi.org/10.5194/nhess-23-45-2023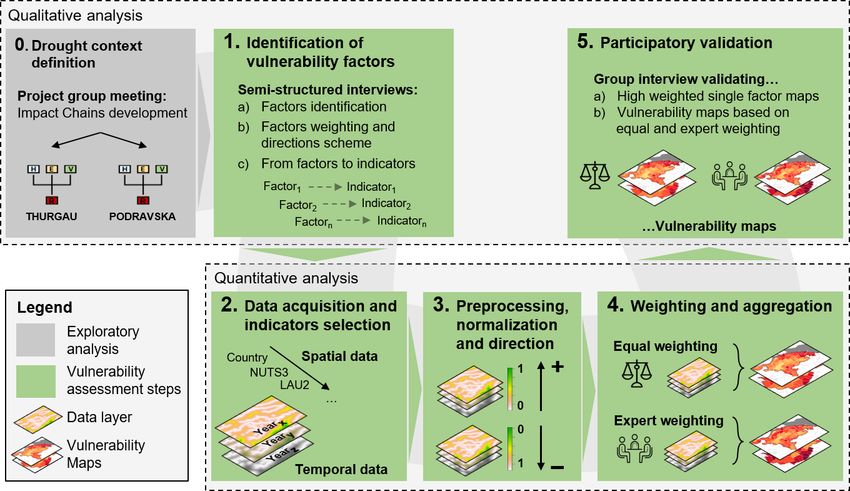
R. Stephan et al.: Assessing agriculture’s vulnerability to drought in European pre-Alpine regions                               51

types, farm size, humus content, presence of irrigation infras-     both study regions and used this as a representative indicator.
tructure, slope, soil texture, topsoil depth, and water holding     For example, in Thurgau we used the indicator dominant soil
capacity. The unique factors for Thurgau were south-facing          texture with classes from clay to sand to describe the factor
area, share of intensive livestock, share of pastures, politi-      of soil texture as a whole, and we used the indicator livestock
cal conservative vote, share of specialty crops, and type of        units for the factor of share of intensive livestock. This way,
irrigation infrastructure. The unique factors for Podravska         we could support a majority of 12 factors in Thurgau and a
were distance to mountains, landscape diversity, water per-         majority of 14 factors in Podravska with data from indicators
mits, accessibility to local food market, farm diversifica-         (Table 1).
tion, intensity of farming, absence of drought policies, food          For some indicators the data are static over time, such as
price, agro-technical measures, clear landownership, com-           elevation. For indicators that show a temporal development
pensations, farmers’ age, and farmers’ education. Thus, the         we were able to find recent data, such as number of farms
identified factors describe various aspects of vulnerability,       > 30 ha (from 2019 in Thurgau) and average utilized agricul-
such as geographic conditions (e.g. elevation, south-facing),       tural area per agricultural holding (from 2010 in Podravska).
hydrological characteristics (e.g. distance to large water bod-     Regarding the available spatial resolution in Thurgau, we
ies), soil characteristics (e.g. water holding capacity), agri-     found shapefiles with different spatial resolution for five in-
cultural practices (e.g. intensive farming), agricultural infras-   dicators, raster files with a resolution at least of 25 hectares
tructure (e.g. irrigation infrastructure), farmers background       for four indicators, and data for LAU1 regions for three in-
and willingness to change (e.g. farmers education and polit-        dicators. In Podravska, we found raster files with a resolu-
ical conservative vote), and drought policies (e.g. compen-         tion of at least 25 hectares for six indicators, data for LAU2
sations). In comparison, the experts from Podravska claimed         regions for four indicators, with different spatial resolution
more and a wider range of factors describing the regions’           for three indicators, and point data for one indicator. Most
vulnerability than the experts from Thurgau.                        of the factors are represented by indicators with continuous
   For both regions we found suitable indicators with subre-        data (respectively n = 6 and n = 10), followed by indicators
gional data from various sources to cover a majority of the         with categorical data (n = 4 and n = 3) and by indicators with
identified vulnerability factors (see Table 1, Fig. S1). How-       binary data (n = 2 and n = 1).
ever, we were not able to support with subregional data 6
out of 18 factors in Thurgau and 11 out of 25 factors in Po-        4.2   Vulnerability Thurgau
dravska. For both regions we used data from the European
Environment Agency (EEA, 2022) and from the European                Thurgau’s vulnerability is calculated with 12 factors for both
Soil Data Centre (ESDAC, 2022). Regarding Thurgau, we               the equal weighting method and the expert weighting method
used data from national sources as the Swiss Federal Statis-        (Fig. 3). The following five factors were attributed a greater
tical Office (SFSO, 2022) and the Swiss Federal Office of           importance by the experts and were therefore assigned with
Environment (FOEN, 2022), and data from regional sources            higher weights and accounting for a total of 71 % of the total
the Office for Geoinformation by Thurgau (Amt für Geoin-            vulnerability: distance to large water bodies, humus content,
formation Thurgau, 2022). Regarding Podravska, we used              presence of irrigation infrastructure, soil texture, and water
data from the Statistical Office of the Republic of Slovenia        holding capacity, whereas the other factors lost weight in the
(SURS, 2022) and from the INSPIRE Slovenian Data Portal             expert weighting method, specifically the factor of slope.
(INSPIRE, 2022).                                                       Each mapped factor shows higher and lower vulnera-
   Some factors could be easily described through indicators        bilities across the region according to the indicator values
supported by data available at the subregional scale. In these      (Fig. S2). The increasing and decreasing effect of the fac-
cases the factors, originally described by the experts, were        tor depends on the direction defined by the experts (Ta-
fully represented by the selected indicators. For example,          ble 1). The factor with the highest weight according to the
with the digital elevation model by the EEA we could rep-           experts is the presence of irrigation infrastructure which ac-
resent the factor of slope with the indicator slope measured        counts for 19 % of the total vulnerability. Permanently irri-
in radians. In addition, with a combination of shapefiles by        gated land is relatively equally distributed across Thurgau.
the EU-Hydro – River Network Database respectively (EU-             The LAU2 regions covered most with irrigation infrastruc-
Hydro, 2022) for large rivers, reservoirs, and lakes we could       ture are in the central north of Thurgau (Homburg, Kemmen-
represent the factor of distance to large water bodies by cal-      tal). Regions least covered with irrigation infrastructure are
culating this distance for each location in both case studies.      in the higher elevation regions of the south (Fischingen) and
For other factors we were forced to select proxy indicators         east of the city of Constance and along the coast (Berlin-
which were either more specific or only covering a partial as-      gen, Gottlieben). The second most important factor is dis-
pect of the overall concept provided by the experts during the      tance to large water bodies accounting for 17 % of the total
interviews. For example, for the factor of presence of irriga-      vulnerability. This mapped factor presents lower vulnerabil-
tion infrastructure we found information about the presence         ity along the coast; the rivers Rhine, Thur, and Murg; and
or absence of permanently irrigated agricultural land across        around larger water reservoirs and lakes mostly located in

https://doi.org/10.5194/nhess-23-45-2023                                        Nat. Hazards Earth Syst. Sci., 23, 45–64, 2023
R. Stephan et al.: Assessing agriculture’s vulnerability to drought in European pre-Alpine regions
https://doi.org/10.5194/nhess-23-45-2023
Table 1. Set of factors the interview participants used to describe vulnerability to agricultural drought impacts and that could be supported with data in Thurgau and Podravska. The
data source, data type, data range, the direction, the latest update, and the spatial resolution of the data is shown.
Thurgau
Factor Indicator Direction Latest Data type Data source
update
Altitudes Altitudes (m a.s.l.) & 2016 Continuous, Raster EU-DEM (2022)
Distance to large water bodies Distance to large water bodies (km) % 2020 Continuous, Raster EU-Hydro (2022) and FOEN (2022)
Farm size No. of farms ≥ 30 ha (no.) & 2019 Continuous, Vector SFSO (2022)
Humus content Topsoil organic carbon content (%) & 2006 Classes, Vector ESDAC (2022)
Presence of irrigation infrastructure Permanently irrigated agricultural land & 2018 Binary, Raster CLC (2022)
Share of intensive livestock∗ Livestock units (LU) % 2020 Continuous, Vector SFSO (2022)
Share of pastures∗ No. of farms specialized for pasture farming (no.) & 2020 Continuous, Vector SFSO (2022)
Slope Slope (rad) % 2014 Continuous, Raster CLC (2022)
Soil texture Dominant soil texture % 2005 Binary, Vector Amt für Geoinformation Thurgau (2022)
South-facing area∗ South-facing % 2005 Binary, Vector Amt für Geoinformation Thurgau (2022)
Topsoil depth Dominant topsoil depth % 2005 Classes, Vector Amt für Geoinformation Thurgau (2022)
Water holding capacity Topsoil available water capacity (mm) & 2006 Classes, Vector ESDAC (2022)
Podravska
Factor Indicator Direction Latest Data type Data source
update
Access to local food market∗ Agricultural holdings with main destination for sale (%) & 2010 Continuous, Vector SURS (2022)
Altitudes Altitudes (m a.s.l.) % 2017 Continuous, Raster INSPIRE (2022)
Nat. Hazards Earth Syst. Sci., 23, 45–64, 2023
Distance to large water bodies Distance to large water bodies (km) % 2020 Continuous, Raster EU-Hydro (2022) and INSPIRE (2022)
Distance to mountains∗ Distance to mountains (m) % 2008 Continuous, Raster European Mountain Areas (2022)
Farm diversification∗ Average no. of permanent beds per agricultural holding (no.) & 2009/2010 Continuous, Vector SURS (2022)
Farm size Average utilized agricultural area per agricultural holding (ha) & 2010 Continuous, Vector SURS (2022)
Humus content Topsoil organic carbon content (%) & 2006 Classes, Vector ESDAC (2022)
Intensity of farming∗ Average total yield per municipality (t) % 2010/2020 Continuous, Vector SURS (2022) and INSPIRE (2022)
Landscape diversity∗ Landscape diversity (Shannon’s evenness index) & 2018 Continuous, Raster CLC (2022)
Presence of irrigation infrastructure Permanently irrigated agricultural land & 2018 Binary, Raster CLC (2022)
Slope Slope (rad) % 2017 Continuous, Raster INSPIRE (2022)
Soil texture Subsoil textural class & 2006 Classes, Vector ESDAC (2022)
Water holding capacity Topsoil available water capacity (mm) & 2006 Classes, Vector ESDAC (2022)
Water permits∗ Discharge from permits (L yr−1 ) & 2012 Continuous, Point data INSPIRE (2022)
Marked with “∗ ” for factors only mentioned for either Thurgau or Podravska, the remaining were mentioned for both study regions.
52R. Stephan et al.: Assessing agriculture’s vulnerability to drought in European pre-Alpine regions 53 Figure 3. The identified vulnerability factors for (a) Thurgau and (b) Podravska that could be supported with subregional data. The size of each factor within the bars corresponds to the weight comparing the equal weighting method with the expert weighting method. the northeast. Subsequently, the highest vulnerabilities re- ties (< 99 mm) are presented for several LAU2 regions along lated to this factor occur in the LAU2 regions in-between the coastline and close to the river Rhine. Accordingly, the the rivers and lakes (Homburg, Raperswilen, Wäldi) and LAU2 regions in the south are less and in the north are more in the mountainous south (Fischingen). The third most im- vulnerable with respect to this factor. portant factor in Thurgau is humus content, accounting for In order to represent the overall vulnerability, we summed 13 % of the total vulnerability. The best-fitting indicator sup- all factor raster layers and set to zero all non-agricultural ar- porting this factor is called topsoil organic carbon content eas in order to compute a mean value of vulnerability for each (%) and is offered by the European Soil Database (ESDAC, LAU2 region according to the equal (Veq ) and expert (Vex ) 2022). This categorical indicator presents higher carbon con- weighting methods (Fig. 4 and Table S5). To identify the tent and thus a lower vulnerability in the LAU2 regions lo- agricultural areas we used regional data from the Office for cated along the river Thur (Hüttlingen, Fellben-Wellhausen, Geoinformation by Thurgau (Amt für Geoinformation Thur- Hohentannen), while 21 LAU2 regions spread across Thur- gau, 2022). gau present very low carbon content < 1 % spread across The five highest Veq towards agricultural drought im- the study region. The fourth and fifth most important fac- pacts occur in the central north and northeast part of Thur- tors are soil texture and water holding capacity. For soil tex- gau indicated for Raperswilen, Berg, Dozwil, Wigoltingen, ture we used data from the Amt für Geoinformationen, which and Lommis. All these LAU2 regions show a high share of present the dominant topsoil texture with five classes from agricultural land over the total region land, hence making clay to clay-rich sand that we transformed in three classes them more exposed to possible drought impacts. In partic- with sand as the most vulnerable texture and clay as the ular, although Raperswilen, Wigoltingen, and Lommis show least vulnerable texture, as described by the experts (Ta- a larger presence of irrigation infrastructure, many other fac- ble 1). Only a few areas spread across Thurgau are covered tors, such as distance to large water bodies, humus content, with sandy soils and are thus most vulnerable (Basadingen- and water holding capacity, contribute to an increased vul- Schlattingen, Felben-Wellhausen, Lommis), whereas Thur- nerability (Fig. 4). Differently from Raperswilen, Wigoltin- gau is mostly covered by clay and silt, decreasing the vulner- gen, and Lommis, the LAU2 regions of Dozwil and Berg ability. For the factor of water holding capacity we used the show a lower presence of irrigation infrastructure, but low indicator topsoil available water capacity from the European humus content and water holding capacity. The five lowest Soil Database (ESDAC, 2022). This indicator presents a very Veq are located in the central and southern part of Thurgau high capacity (> 190 mm) along the river Thur (Märstetten, (Fischingen, Bichelsee-Balterswil, Bettwiesen, Wilen, Wup- Felben-Wellhausen, Wigoltingen). In contrast, lowest capaci- penau). For those regions, almost all underlying factors show https://doi.org/10.5194/nhess-23-45-2023 Nat. Hazards Earth Syst. Sci., 23, 45–64, 2023
54                      R. Stephan et al.: Assessing agriculture’s vulnerability to drought in European pre-Alpine regions

Figure 4. Thurgau’s most important factors (bold title) masked with agricultural used land and describing the regions’ vulnerability according
to the experts (Fig. 3) supported by data of the indicators (see legend). The factor’s increasing or decreasing effect on the vulnerability is
indicated by the arrow in the map (bottom right) and by the colour choice (the darker the colour, the higher the vulnerability). LAU2 regions
are indicated by black borders and labelled when showing relatively high or low vulnerability.

moderate to low values besides presence of irrigation infras-            increasing in vulnerability. In particular, the region of Rap-
tructure and share of intensive livestock having higher val-             erswilen is again ranked first, followed by Herdern, Hom-
ues. Additionally, a low share of agricultural land drives the           burg, Wäldi, and Uesslingen-Buch. Across these LAU2 re-
low vulnerability (Fig. 4). The highest vulnerability calcu-             gions, the factors of water holding capacity, humus content,
lated with the expert-based method shows some differences                and distance to large water bodies present high vulnerability,
in the spatial distribution of LAU2 regions with the northwest           apart from Uesslingen-Buch with a relatively short distance

Nat. Hazards Earth Syst. Sci., 23, 45–64, 2023                                               https://doi.org/10.5194/nhess-23-45-2023
R. Stephan et al.: Assessing agriculture’s vulnerability to drought in European pre-Alpine regions                               55

to the river Thur (Fig. 4). In contrast, the factor of soil tex-    pert weighting method presents all these hotspot regions with
ture presents these regions covered mostly by clay, and the         higher vulnerability compared to the equal weighting method
factor of presence of irrigation infrastructure displays almost     (Fig. 5, Table S5).
all regions covered with irrigation systems, both decreasing           The reasons for as well as the differences between the
vulnerability. However, the combined effect of a large share        hotspot regions with high vulnerability have been discussed
of agricultural land and visible patches of high vulnerabil-        during the interview. The experts report the Seerücken and
ity values across the factors of distance to large water bod-       Unterthurgau as impacted regularly in the past. However,
ies, humus content, and water holding capacity contribute to        they explained that Unterthurgau has access to (irrigation)
the final high vulnerability values. The LAU2 regions with          water from the river Rhine and from a large groundwater
the five lowest Vex are almost the same as for the equal-           aquifer filled by the lake and the Rhine. Thus drought typi-
weights method with lowest values reported for Fischingen,          cally leads to impacts on agriculture if soil moisture is abnor-
Bichelsee-Balterswil, Wilen, Bettwiesen, and Berlingen.             mally low. This is different regarding the Seerücken, during
   From a comparative point of view, (Fig. 5, bottom row)           drought conditions typically characterized by low soil mois-
results from Vex point to the northwest part of Thurgau with        ture, but additionally by low river discharges leading to im-
higher vulnerability to drought in agriculture driven by the        pacts on agriculture. The experts pointed to the Lauche valley
spatial cluster from the factors distance to large water bodies,    that is specifically better highlighted by the expert weighting
water holding capacity, and soil texture. The LAU2 regions          method as the regions Stettfurt and Lommis are presented as
showing higher vulnerability are mostly located between the         more vulnerable compared to other regions (Table S5). The
river Rhine and Lake Constance (Homburg, Raperswilen,               experts presented the Lauche as a medium-sized river deliv-
Herdern, Basadingen-Schlattingen, Wäldi). In contrast, re-          ering water for several uses that is quickly overused during
gions with decreased vulnerability are located in the north-        drought conditions. Subsequently, in the past user conflicts
east (Dozwil, Salmsach, Egnach) and north (Gottlieben), and         on irrigation occurred regularly first in the Lauche valley,
in central Thurgau (Weinfelden).                                    which is also the case in the current dry situation (21 June
   During the participatory validation with Thurgau’s ex-           2022).
perts, the most important factors (Fig. 4) have been discussed
regarding their correctness. The experts agreed that in gen-        4.3   Vulnerability Podravska
eral all these factors present plausible patterns across the re-
gion. However, they expected more irrigation in the “Thur           Podravska’s vulnerability is calculated considering 14 fac-
valley”, the valley along the river Thur (Fig. 1). They ex-         tors for both the equal weighting and the expert weighting
plained that this valley is intensively used for agricultural       method (Fig. 3 and Table S6). Within them, the four factors
purposes, and therefore they expected more irrigation infras-       of access to local food market, farm diversification, presence
tructure. As well, they expected less clay-rich soil with clay      of irrigation infrastructures, and soil texture increased their
in this area, because of the high amount of gravel in the val-      weights in the expert weighting scheme accounting for a to-
ley, typically a sign for sandy soils. They concluded that due      tal of 56 % of the overall vulnerability weight.
to the intensive use for agriculture in the Thur valley, the soil      According to the experts, the most influential factor is
conditions could be modified due to adapted cultivation tech-       the presence of irrigation infrastructure, which accounts for
niques. Regarding the factor of soil texture, they confirmed        15 % of the total vulnerability. Irrigated areas are mainly lo-
the clay-rich but sandy soils in “Unterthurgau” covering the        cated in the flat areas along the Drava and Polskava rivers,
regions Diessenhofen, Schlatt, and Basadingen-Schlattingen          which are crossing from northwest and southwest to east of
in northwestern Thurgau, and the “Lauche valley”, the val-          the Podravska region (Miklavž na Dravskem Polju, Starše,
ley along the river Lauche (Fig. 1). Furthermore, they con-         Kidričevo, Hajdina, Markovci, Gorišnica). Areas covered the
firmed the clay-rich soils along the so-called “Seerücken”, a       least with irrigation infrastructure are mainly located in the
hill range up to 723 m.a.s.l. between Lake Constance and the        outer parts of Podravska and at a higher elevation. The sec-
river Thur (Fig. 1, https://peter-hug.ch/lexikon/1888_bild/         ond and third most important factors are soil texture and farm
45_0487, last access: 10 August 2022). Regarding the fac-           diversification, accounting for 14 % of the total vulnerability.
tor of humus content, they questioned the low amount of             Although most of the areas in Podravska show coarser soil
topsoil organic carbon content along the Seerücken. Regard-         texture values with higher contribution to vulnerability, some
ing the mapped vulnerability of agriculture to drought, the         clay and silt soils patches are located in the central south-
experts confirmed that both maps present reasonable differ-         ern area (municipalities of Slovenska Bistrica, Rače–Fram,
ences across Thurgau with higher vulnerability in the north         Kidričevo, Majšperk, and Makole), along the Pesnica river in
compared to the south. However, the experts highlighted the         the northeast part of Podravska, and also close to the munic-
vulnerability map based on the expert weighting method, be-         ipalities of Ormož and Središče ob Dravi. The factor of farm
cause of the better presentation of known hotspot regions.          diversification refers to the presence of additional incomes
Specifically, the experts pointed to hotspot regions along the      for farmers, particularly focusing on the possibility of host-
Seerücken and to the hotspot Unterthurgau (Fig. 1). The ex-         ing tourists, as highlighted by the experts. As for the factor

https://doi.org/10.5194/nhess-23-45-2023                                        Nat. Hazards Earth Syst. Sci., 23, 45–64, 2023
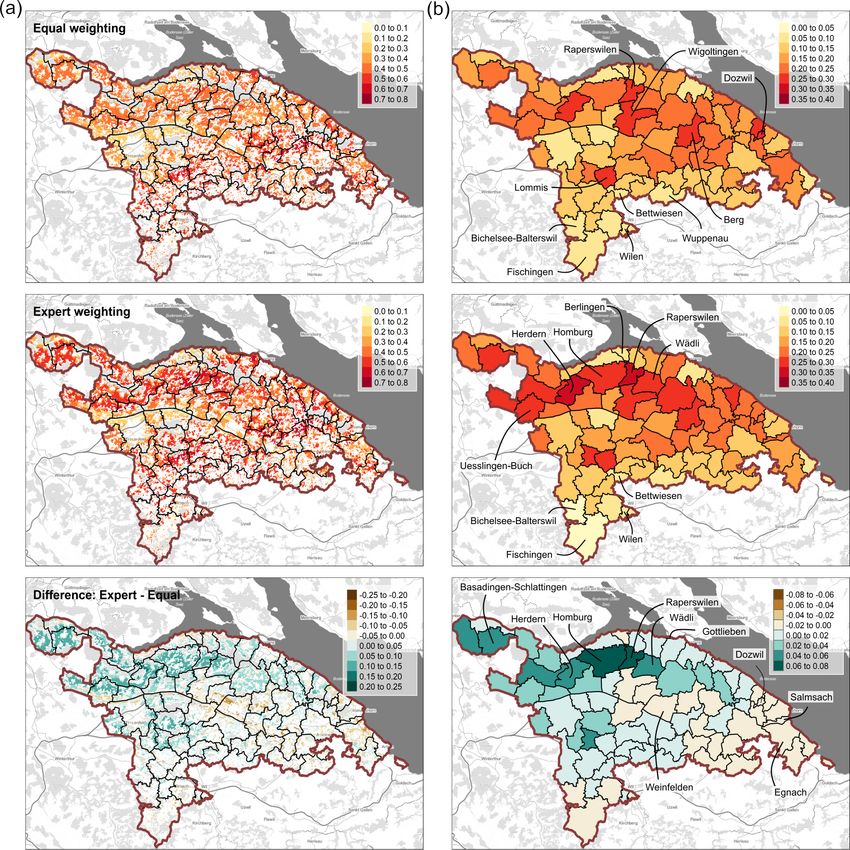
56                      R. Stephan et al.: Assessing agriculture’s vulnerability to drought in European pre-Alpine regions

Figure 5. The mapped results of equal weighting, expert weighting methods, and their difference across Podravska. On the left (a), masked
with agricultural used land and before aggregation on LAU2 regions (black borders). On the right (b), after aggregation for each LAU2
region. LAU2 regions are labelled when showing relatively high or low vulnerability, or relevant differences between the weighting methods.

of soil texture, the factor of farm diversification shows a gen-        factor of access to local food market showed a more hetero-
eral condition of homogeneous low values. Only the munic-               geneous situation with lower values mainly in the northern
ipalities of Maribor, Šentilj, Cerkvenjak, and Ormož showed             part (Šentilj) and in the southern part (Poljčane, Makole, Že-
higher values in the number of permanent beds per agricul-              tale, Podlehnik, Cirkulane, and Zavrč). The highest values
tural holding, which is making them less dependent on the               were found for the municipality of Kidričevo, where more
agricultural income, hence more diversified and less vulner-            than 66 % of the agricultural holdings have ’for sale’ as their
able to potential drought impacts. The fourth most important            main destination of their products, followed by Gorišnica

Nat. Hazards Earth Syst. Sci., 23, 45–64, 2023                                             https://doi.org/10.5194/nhess-23-45-2023
R. Stephan et al.: Assessing agriculture’s vulnerability to drought in European pre-Alpine regions                                 57

with 58.9 %, Rače–Fram with 58.7 %, and Hoče – Slivnica           a generalized worsening of vulnerability conditions as rep-
with 56.8 %. The lowest values were found for Podlehnik             resented by the experts in Podravska. The LAU2 regions
18.8 % and Cirkulane 14.4 % in the southern part, where the         showing higher vulnerability are mostly located in the north
agricultural holding products are mainly intended for own           and central south of Podravska: Sveti Jurij v Slov. gor-
consumption.                                                        icah, Gorišnica, Kungota, Benedikt, and Starše. In contrast,
   Similarly to the Thurgau case study, we summed all factor        the regions with least changes between the two methods
raster layers and set to zero all non-agricultural areas in order   are spread across Podravska (Središče ob Dravi, Kidričevo,
to compute a mean value of vulnerability for each LAU2 re-          Ruše, Lovrenc na Pohorju, Sveti Andraž v Slovenskih gor-
gion according to the equal (Veq ) and expert (Vex ) weighting      icah).
methods (Fig. 7). To identify the agricultural areas we used           During the participatory validation with the experts from
regional data on agriculture parcels with declared crop from        Podravska, we discussed each map of the most important vul-
the INSPIRE Slovenian data portal.                                  nerability factors (Fig. 6). The experts agreed that most shal-
   The five highest Veq towards agricultural drought impacts        low soils with coarse texture and subsequently higher vulner-
occur in the northeast part of Podravska. The highest Veq is        ability are close to rivers and springs. Therefore, they pointed
indicated for Trnovska vas, followed by Sveti Jurij v Slov.         to the so-called “Drava valley” along the river Drava and the
goricah, Destrnik, Benedikt, and Sveti Andraž v Slovenskih          lowlands that are presented with coarse soils by the factor
goricah. Moreover, other LAU2 regions with high values are          of soil texture in Fig. 6. Regarding the presence of irriga-
still located in the northeast of Podravska. These regions          tion infrastructure, the experts confirmed that still a large part
show a high share of agricultural areas combined to low val-        of Podravska is not irrigated yet, which is causing problems
ues in terms for presence of irrigation infrastructure, soil tex-   in the north, northeast, and south. In contrast, they expected
ture, farm diversification, and access to local food market         the east (especially Ormož) to be more covered with irriga-
(Fig. 6), but also for other factors with lower weight on the       tion infrastructure, and questioned if the data source from
overall vulnerability such as distance to mountains, intensity      the EEA Copernicus Land Monitoring Service published in
of farming, and humus content (Fig. S3).                            2018 is correctly displaying the current situation. The experts
   The five lowest Veq towards agricultural drought impacts         agreed on the spatial distribution of the factor farm diversi-
are located in the northwest and southwest parts of Po-             fication with the regions Maribor, Ormož, and Šentilj show-
dravska. In particular, Ruše shows the lowest Veq value, fol-       ing farms with a higher touristic share due to the presence
lowed by Lovrenc na Pohorju, Selnica ob Dravi, Maribor,             of vineyards and orchards often offering touristic opportuni-
and Poljčane. These regions show a low share of agricultural       ties. Regarding the factor of access to local food market, they
areas for each LAU2 region since they are close to mountains        agreed that farms around cities usually have higher access to
with forest as the main land cover type or with large urban         food markets, as they can sell their products, which is partly
areas as for the case of Maribor. Within these regions, the         displayed around Maribor. However, they expected the east
agricultural areas are located along the Drava river and ben-       part of Podravska (e.g. Ormož) to have less access to food
efit from the low distance to the main urban areas in terms of      markets, as the markets there are less developed.
farm diversification.                                                  Regarding the final vulnerability maps of agriculture to
   The expert weighting method shows the highest values of          drought, the experts did not prefer one map out of the two
vulnerability in the northeast part of Podravska with the five      methods, as they both show the main vulnerable regions
highest LAU2 regions being almost the same as for the equal         across Podravska with higher vulnerability in the northeast,
weighting (Sveti Jurij v Slov. goricah, Benedikt, Trnovska          in the south, and in the centre of Podravska. They pointed to
vas, Destrnik, and Pesnica, Fig. 7b, Table S6). The shift in        the fact that subjectivity is less prominent within the equal
highest values of LAU2 regions is visible in the difference         weighting method, and that the expert weighting method
between the two maps at the bottom of Fig. 7, with Sveti            should be validated in depth with local farmers working on
Jurij v Slov. goricah showing the highest increase driven,          the field. In particular, they pointed to the Drava valley and
among others, by the large share of agricultural areas with-        the lowlands called “Ptuj field” and “Drava field” (Fig. 1), as
out the presence of irrigation, a coarse soil texture, and low      regions having already experienced drought impacts, as they
values of farm diversification.                                     are characterized by shallow soils with low water holding ca-
   The lowest values of vulnerability from the expert weight-       pacity. Nevertheless, the experts agreed that the Drava valley
ing method are also still located in the northwest and south-       is among the most vulnerable regions in Podravska, because
west part of Podravska without changes in the rank of the           of the intensive production, whereas the vulnerability maps
LAU2 regions (Ruše, Lovrenc na Pohorju, Selnica ob Dravi,           display the north and south as the most vulnerable. Focusing
Maribor, and Poljane).                                              on the northeast and the south, the experts pointed to more
   Comparing the expert weighting results with the equal            hilly conditions and less organized water distribution for ir-
weighting results (Fig. 7, at the bottom) there are only pos-       rigation making these areas more vulnerable, which is cor-
itive variations coming from higher weights by the experts          rectly displayed in Fig. 7. The experts agreed that the western
compared to the equal weighting scheme. This points to              part of Podravska is less vulnerable, as this mountainous re-

https://doi.org/10.5194/nhess-23-45-2023                                        Nat. Hazards Earth Syst. Sci., 23, 45–64, 2023
58                       R. Stephan et al.: Assessing agriculture’s vulnerability to drought in European pre-Alpine regions

Figure 6. Podravska’s most important factors (bold title) masked with agricultural used land and describing the regions’ vulnerability accord-
ing to the experts (Fig. 3), supported by data of the indicators (see legend). The factor’s increasing or decreasing effect on the vulnerability is
indicated by the arrow in the map (bottom right) and by the colour choice (the darker the colour, the higher the vulnerability). LAU2 regions
are indicated by black borders and labelled when showing relatively high or low vulnerability.

gion is not intensively used for agriculture but more covered                  Answering the first research question, the degree to
with forests. They also confirmed that the east is less vul-                which vulnerability could be characterized quantitatively
nerable (Ormož), although more recent data should be con-                   was mainly limited by data accessibility. One of the main
sidered to capture the local characteristics of lower access to             limitations when performing such local analysis is the avail-
local food market and higher values of presence of irrigation               ability of suitable quantitative data to support the identified
infrastructure.                                                             factors. The involvement and exchange of information with
                                                                            local experts proved to be crucial to obtaining references and
                                                                            datasets. Nevertheless, for Thurgau we were unable to find
5     Discussion                                                            subregional data for 6 out of 18 factors, and for Podravska
                                                                            for 11 out of 25 (Fig. S1). This included, e.g. data for the
5.1    Strengths and weaknesses of the mixed-method                         type of irrigation infrastructure, the share of drought prone
       approach                                                             and drought resistant species, presence of drought manage-
                                                                            ment strategies, farmers age and education, and political con-
This study applied a mixed-method approach with the aim to
                                                                            servative vote. In addition, not all data supporting the factors
fully grasp the regions’ vulnerability to drought combining
                                                                            have proven to be fully suitable to describe the factors high-
qualitative expert knowledge with quantitative data mapping.
                                                                            lighted by the experts. For example, the no. of beds per agri-
While the mixed-method approach introduced some simplifi-
                                                                            cultural holding representing the factor farm diversification
cations, it also allowed the study to overcome the limitations
                                                                            in Podravska simplifies the initial meaning that farms with
of applying qualitative and quantitative methods separately.

Nat. Hazards Earth Syst. Sci., 23, 45–64, 2023                                                  https://doi.org/10.5194/nhess-23-45-2023
You can also read