Assay of honey freshness by a novel optical technique - Nature
←
→
Page content transcription
If your browser does not render page correctly, please read the page content below
www.nature.com/scientificreports
OPEN Assay of honey freshness
by a novel optical technique
Alireza Mashhadi, Ali Bavali* & Farzad Mokhtari
Assay of Maillard reaction products (e.g. furosine) is a reputable method for determination of the
honey freshness. In this report, novel optical technique is proposed for real-time measurement of
the changes of furosine content in honey. The method is based on the unidirectional energy transfer
between two peaks of the doubled-peak fluorescence spectrum as secondary inner filter effect
(2nd-IFE) in a specific arrangement of the laser induced fluorescence (LIF) setup. Proper optical
parameters are defined accordingly, and affirmed to be dependent on the content of furosine in
honey. It is shown that the introduced parameters are not sensitive to the LIF intensity fluctuations
induced by the ambient noises and particularly alter due to the 2nd-IFE. Furosine level of 8 honey
types with different botanical origin were chemically determined before and after the 1 year storage,
and compared with the values of the devised spectral parameters. Proofs conducted that the proposed
technique can be utilized for evaluation of the honey freshness.
As one of the high nutritional value foods, honey is a complex matrix of several compounds including carbohy-
drates (76–85% depending of the water content), free amino acids (~ 1 g/kg), proteins (~ 5 g/kg), and other minor
components e.g. enzymes, minerals, vitamins and pollen grains1. However, improper factory conditions such as
prolonged storage or heating (in order to delay crystallization) lead to conversion of the carbohydrates into the
unfavorable chemical agents. The most pronounced chemical is 5-hydroxymehyl-2-furaldehyde (HMF), which
is formed during the progress of Maillard reactions and/or caramelization due to pasteurization, liquefaction or
long-term storage at room temperature. In early steps of the Maillard reactions, Schiff ’s bases are produced due
to the reaction of reducing sugars with the amino group of the amino acids, peptides, or proteins3. Generation
of the Schiff ’s bases results in the formation of an Amadori compound, ɛ-N-Deoxylactulosyl-L-lysine, which
can be partially converted via acid hydrolysis to a stable compound, “ɛ-N-2-furoylmethyl-L-lysine” known as
furosine2–4. Furosine ( C12H18N2O4) is an alpha amino acid in which the amino group is attached to the alpha
carbon atom next to the carboxylate group. This intermediate product, does not necessarily require much heat
to be generated and can be produced significantly over a long period of time at room temperature5. Therefore,
besides HMF, furosine has been regarded as a sensitive indicator of the freshness of stored food products5–10. For
instance, it has been shown that furosine and lactulose content are reliable indicators of the damage of ultra-high
temperature (UHT) m ilk4,7,11–13.
There are also reports on the formation of the furosine in honey due to overheating or prolonged storage2,14.
Using High Performance Liquid Chromatography (HPLC), Villamiel et al. measured an increase of the furosine
content (~ 14.00 g/kg protein) in overheated honey samples (90 °C, 135 min)2. Cardenas-Ruiz et al. 14 utilized
HPLC technique to reveal a remarkable raise in the furosine concentration of the heated honey. Based on similar
results, assay of the furosine content as a precise indicator has been recommended to determine the quality of
honey15,16.
Essentially, the most frequently employed techniques for quantification of the furosine content in honey
are HPLC14,16 and capillary zone electrophoresis (CZE)17. However, those chemical-based techniques are time-
consuming, costly and require preliminary chemical preparation of the s ample16,17. Therefore, a demand exists
for a simple, low cost, handheld and fast method for real-time monitoring of the furosine content during the heat
treatment and/or storage of honey. In this regard, optical methods are well-adapted among which, fluorescence
spectroscopy would be a proper choice due to its high sensitivity, accuracy, selectivity, simplicity, high speed
and low cost18–20.
However, in a complex medium such as honey, fluorescence spectroscopy in its conventional form is not
reliable due to the inner filter effects (IFEs), fluorescence quenching and multiple scattering of the p hotons21.
Such screening events cause the relation between the measured fluorescence intensity and the fluorophore con-
centration to be aberrant of linearity21,22. IFEs may occur in two ways; (1) successive absorption of the exciting
photons in medium such that a less intense light reaches the subsequent layer of the medium (primary IFE), and
Department of Energy Engineering and Physics, Amirkabir University of Technology, Tehran 15875‑4413, Iran.
*
email: alibavali@aut.ac.ir
Scientific Reports | (2022) 12:901 | https://doi.org/10.1038/s41598-022-04920-w 1
Vol.:(0123456789)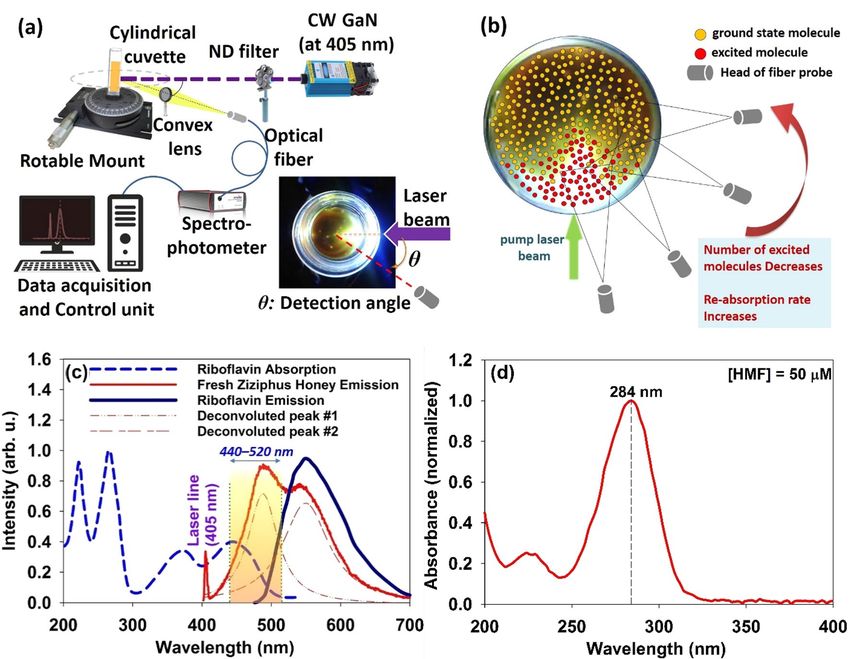
www.nature.com/scientificreports/
Fluorophore λexc. (nm) λem. (nm)
Phenolic compounds* (I) e.g. Benzoic acid (C7H6O2) 240–265 370–495
Phenolic compounds (II) e.g. Gallic acid (C7H6O5) 280–320 390–470
Phenolic compounds (III) e.g. Quercetin (C15H10O7) 310–360 370–470
Aromatic amino acids 260–285 320–370
Maillard reaction products (mainly HMF and Furosine) 360–435 440–520
Riboflavin (also known as vitamin B2) Visible range: 400–510 480–750
Table 1. Excitation/emission spectral regions of major fluorescent components in h
oney26–28. *Phenolic
compounds are classified based on their chemical structure and corresponding absorption/emission p eaks28.
Figure 1. (a) Absorption/Emission spectra of the aqueous riboflavin; Fluorescence spectral range of the
Maillard’s products (440–520 nm) is highlighted. (b) UV–Vis spectra of some fresh honey types. Spectral range
of 280–330 nm (highlighted by yellow colored) is related to the absorption by phenolic compounds.
(2) partial reabsorption of the fluorescence emission in medium i. e. 2nd-IFE23. Besides IFEs, relatively larger
particles, such as pollen grains and sugar crystals in natural honey, may aggravate the intensity distortions by
providing scattering events.
Moreover, presence of the various fluorophores in honey and likelihood of the light scattering events (due to
granularity), cause the detected LIF emission intensity to be significantly different from the original one. Though
several analytical methods have been proposed to correct IFE noises, those corrections are not practicable in the
case of the selective measurement in optically heterogeneous, multi-fluorophoric m edia24,25. Xu et al.24 demon-
strated that photon scattering and absorption events have a distinct efficacy on IFE so that their contributions
must be decomposed before making corrections. Accordingly, as will be discussed below, it is not possible to
measure the amount of furosine in honey by conventional fluorescence spectroscopy.
Honey contains variety of fluorescent molecules with absorption/emission spectra covering ultraviolet to
infrared spectral region26. The absorption spectra of some species significantly overlap with the emission spectra
of the other one, so that the adsorbent species reabsorb the fluorescence emission of the emitting molecules.
Based on a report by Lenhardt et al., spectral ranges of the excitation/emission of the major fluorescent compo-
nents in honey can be classified as presented in Table 1. Most of the fluorescent species are phenolic compounds
that contain one or more hydroxyl groups bonded directly to an aromatic hydrocarbon group. Depending on the
structure of the phenolic compounds, their absorption and subsequent emission spectra cover different values
in the range of 240–360 nm, in such a way that the simpler structures e. g. benzoic acid in group (I) absorb and
emit light at shorter wavelengths and more complex structures e. g. Gallic acid in group (II) and Quercetin in
group (III) at longer w avelengths28.
According to Table 1, the fluorescence spectral range of the Maillard’s products (i. e. 440–520 nm) has a sig-
nificant overlap with the absorption spectrum of riboflavin. Moreover, Fig. 1a demonstrates absorption/emission
spectra of the aqueous riboflavin. It is clearly seen that the riboflavin can provide significant 2nd-IFE for the
fluorescence emission of the Maillard products (e. g. Furosine). Therefore, furosine concentration cannot be accu-
rately determined by direct excitation of the furosine and measuring the corresponding fluorescence intensity.
Figure 1b represents UV–Vis spectra of the different types of fresh honey samples. Highlighted area by yel-
low color (230–360 nm) which manifests the largest difference between the spectra, corresponds to absorption
by phenolic c ompounds26.
Here, proper spectral parameters are introduced regarding the LIF spectroscopy of honey, that appoint a
quantitative correlation between the reabsorption events (as 2nd-IFE) and the amount of furosine in honey,
based on which the changes of furosine content in honey can be determined. It is shown that the proposed
Scientific Reports | (2022) 12:901 | https://doi.org/10.1038/s41598-022-04920-w 2
Vol:.(1234567890)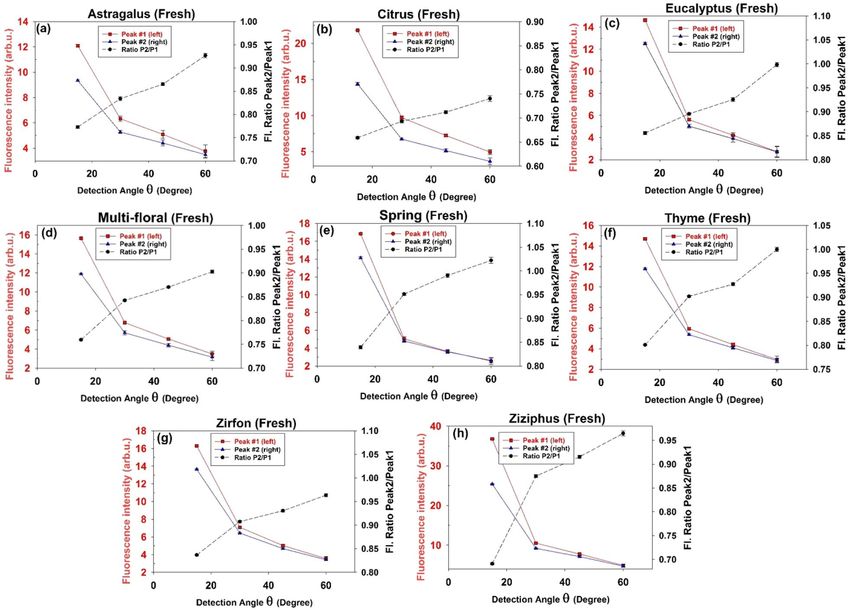
www.nature.com/scientificreports/

                                 Figure 2.  (a) Schematics of LIF measurement setup at cylindrical configuration. (Inset: definition of the
                                 detection angle on a top view of cylindrical glass cuvette). (b) Schematic distribution of the ground state and
                                 excited molecules in a typical active medium after illumination by a narrow beam of laser (from the top view of
                                 the cuvette). (c) Typical LIF spectrum of the fresh Ziziphus honey with excitation laser line (at 405 nm) recorded
                                 at detection angle θ = 60°; Two deconvoluted peaks are included. UV–Vis/fluorescence spectra of the aqueous
                                 riboflavin have been appended and absorption range of the Maillard’s products (440–520 nm) is highlighted. (d)
                                 UV–Vis spectrum of the HMF (50 μM aqueous solution) with a significant maximum around 284 nm.

                                 parameters particularly alters due to the reabsorption events and are not sensitive to the other screening factors
                                 and ambient noises.

                                 Methods and experiments
                                 Laser induced fluorescence spectroscopy.                 Three sets of LIF experiments were carried out: (1) study-
                                 ing angular dependence of the LIF spectral features in order to characterization of the 2nd-IFE. (2) LIF spec-
                                 troscopy of the fresh and stored samples of different honey types under a fixed LIF setup. (3) LIF spectroscopy
                                 of the fresh and heated samples of a typical honey type under a fixed LIF setup. Note that the LIF spectra were
                                 measured in experiments (2) and (3) at a certain detection angle. As demonstrated in Fig. 2a, all LIF measure-
                                 ments were performed at cylindrical configuration. Each sample was inserted into a cylindrical glass cuvette
                                 with 10 mm inner diameter and 1 mm thick to eliminate Fabry–Perot cavity effects. The cuvette was also slightly
                                 tilted to omit unwanted reflections of the laser light from the internal surface of the cell. To excite the honey, a
                                 continuous-wave (CW) GaN diode laser with 300 mW power at 405 nm wavelength and constant spot diameter
                                 of ~ 1 mm was exploited. Using proper ND filters, laser beam energies ranging 50–300 mW were examined quite
                                 below the degradation threshold of the honey ingredients. The optimal power of 200 mW was chosen to irradiate
                                 the samples to achieve measurable optical response while all being irradiated with the same power.
                                     Laser wavelength was selected at 405 nm in accordance with the significant absorbance of the riboflavin and
                                 furosine molecules in which the absorption by sugars, phenolic compounds and aromatic amino acids is lowest
                                 (Table 1 and Fig. 1b). Laser beam was directed at the center of the cuvette surface to excite the fluorescent mol-
                                 ecules, The emission was collected by a convex lens with 10 cm focal length and 1 cm diameter, and was detected
                                 using a UV–Visible-NIR spectrophotometer, Avantes AvaSpec-Mini 2048L, with spectral resolution of 0.1 nm.
                                 The SMA-905, UV600/660 fiber probe with NA = 0.22 (acceptance angle of 12.7°) that was mounted on a rotatable
                                 arm along the radial axis of the cell, was placed at a fixed distance (typically 1 cm) from the surface of the cell to
                                 detect the emission coming out of the medium at any desired angle respect to the direction of the laser beam.
                                     Now it is required to mention the origin of the 2nd-IFE of the LIF in present setup. As depicted in Fig. 2c,
                                 typical LIF spectrum of the fresh Ziziphus honey excited at 405 nm wavelength (detected at angle θ = 30° respect

Scientific Reports |   (2022) 12:901 |                https://doi.org/10.1038/s41598-022-04920-w                                                     3

                                                                                                                                                Vol.:(0123456789)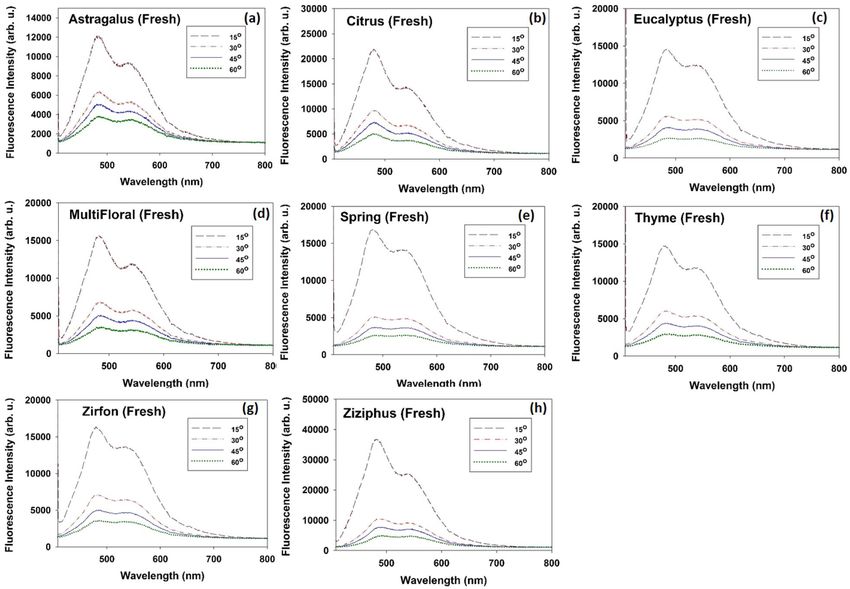
www.nature.com/scientificreports/
to the laser line) comprises two main peaks: left peak (#1) at ~ 485 nm and the right peak (#2) at ~ 540 nm.
UV–Vis/Fluorescence spectra of the riboflavin aqueous solution is also appended to assess the likelihood of the
reabsorption events.
Based on data available in Table 1, left peak is mainly arises from the Maillard reaction products. Moreover, it
is known that HMF molecules do not have significant absorption above 310 nm29 (see also Fig. 2d) while furosine
significantly absorbs around the 405 nm26. Accordingly, pumping at 405 nm could not excite the HMF and the
emission peak at 485 nm (left deconvoluted peak) mainly arises from the furosine content in accordance with
the previous reports26. Moreover, as demonstrated in Fig. 1a, deconvoluted peak on the right is obviously related
to riboflavin. Considering absorption region for Maillard products, it appears that LIF emission from excited
furosine molecules (left peak) is significantly exposed to the reabsorption by the furosine (self-absorption) and
riboflavin molecules in the ground state.
In angular measurements, LIF spectra were recorded at various detection angles respect to the laser beam
direction (θ) to investigate the angular dependence of the spectral features. In the following, it is shown that the
angular assessment of the LIF spectral features provides information regarding the inner filter of the furosine’s
fluorescence emission by riboflavin. In Fig. 2b, top view of the spatial distribution of ground state and excited
fluorophores in a cylindrical cuvette is depicted after illumination of the medium by a narrow beam of laser. In
the present LIF setup where the medium is locally pumped by a narrow laser beam, exciting photons accumulate
in front of the cuvette due to the scattering events inside the medium (notice that the honey is a turbid medium
due to granularity). As a result, the excited volume would be concentrated in the vicinity of the laser beam and
around the entry area. On the other hand, though fluorescence is emitted in all directions, but the reabsorption
mainly occurs by non-excited absorbent molecules outside the excitation volume. Consequently, much stronger
reabsorption is expected to occur at larger detection angles where more non-excited molecules are congested
within the detector’s field of view. Another important point is that at certain detection angles (e.g. 60°) at which
the received photons experience significant 2nd-IFE, if the concentration of the fluorophores increases, the
rate of reabsorption and corresponding spectral shift will increase. This has already been explained in detail
regarding the LIF spectroscopy of dye solutions that confront significant self-absorption (e.g. Rhodamine 6G
and Coumarin 7 with small Stokes shift30).
Considering Beer–Lambert law regarding the reduction of the fluorescence intensity due to the reabsorp-
tion by a given type of absorbent molecules, the initial fluorescence intensity at wavelength λ, F0 ( ), reduces to
GS
(1)
F( , dl) = F0 ( ) exp −σreabs ( )NAbsorbent (l)dl
after passing distance dl in medium, where σreabs.(λ) and NAbsorbent
GS (l) ascertain the reabsorption cross section
at wavelength λ and density of the non-excited absorbent molecules respectively. Based on Eq. (1), σreabs.(λ)
and NAbsorbent
GS (l) modify the reabsorption rate. Overlapping area between the absorption and emission spectra
determines σreabs.(λ). In fact, the larger the crossover area leading to enhance the reabsorption rate30. As the
reabsorption events occur, preferential absorption at the shorter wavelengths gives rise to non-intrinsic red shift
of the fluorescence peak toward the longer wavelengths (see spectral overlap area between riboflavin’s absorption
and fresh honey’s emission spectra in Fig. 2c). On the other hand, at the larger detection angles, fluorescence
photons diffuse through the congestion of more non-excited molecules (larger NAbsorbent
GS (l)) that are away from
the pathway of the exciting laser beam (the medium is locally pumped by a narrow laser beam).
In the case of honey, though laser beam at 405 nm excites both furosine and riboflavin molecules, only
furosine emission is subjected to significant reabsorption. In fact, negligible crossover area of the riboflavin’s
absorption/emission spectra indicates that riboflavin is not subjected to significant self-absorption. However,
according to Fig. 2c, the overlapping of the furosine emission with the riboflavin absorption spectrum portends
the likelihood of the strong reabsorption of furosine emission by ground state riboflavin molecules outside the
excited volume. This unidirectional energy transfer from furosine to riboflavin, which takes place in the pre-
sent setup due to nonhomogeneous pumping. Notice that this event leads to the subsequent re-emission of the
fluorescence by riboflavin molecules. This process is a basis for defining an appropriate optical parameter for
quantitative assessment of the honey freshness.
Spectra analysis. For accurate characterization of the LIF spectra, convoluted peaks were recovered by
OriginPro2019b package (Copyright©1991–2019, OriginLab, Corporation) that uses nonlinear Lorentzian
curve fit on the basis of Levenberg–Marquardt iteration algorithm. Statistical assay of the retrieved data was
performed using the standard paired t-test based on Shapiro–Wilk normality test in SigmaPlot v.14 package.
Sampling. 73 unprocessed honey samples including 8 types of native honey with different botanical origin:
Astragalus, Citrus, Eucalyptus, Multi-Floral, Spring, Thyme, Zirfon and Ziziphus were collected directly from
beekeepers in Iran, on September 2019. All samples were stored at 25 ± 2 °C before commence the experiments.
A number of fresh honey samples were stored at room temperature for a period of 1 year. A unique feature of the
introduced method for measuring the amount of furosine is that the honey sample does not need any prepara-
tion, dilution or chemical process. In experiments regarding the effect of temperature rise on the fluorescence
spectrum of the honey, a hot plate of Karazma model KH450 made in Iran, with a temperature range between
50 and 300 °C was used in order to heat the typical citrus honey sample. Honey sample was heated at 80 °C for
60 min. As the sample cooled, the LIF measurements were carried out at room temperature.
UV–Vis spectroscopy. To measure the absorption spectra, each honey sample was first diluted with dis-
tilled water at 40 °C and then poured into 1 cm × 1 cm × 4 cm quartz cuvette following cooling to room tempera-
Scientific Reports | (2022) 12:901 | https://doi.org/10.1038/s41598-022-04920-w 4
Vol:.(1234567890)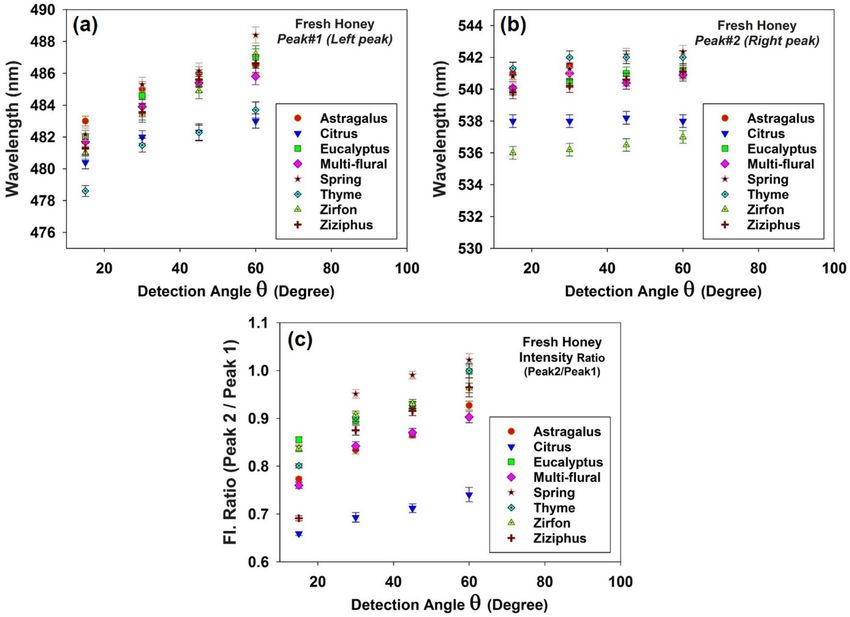
www.nature.com/scientificreports/
Figure 3. LIF spectra due to excitation of fresh honey, (a) Astragalus, (b) Citrus, (c) Eucalyptus, (d) Multi-
Floral, (e) Spring, (f) Thyme, (g) Zirfon and (h) Ziziphus, by 405 nm diode laser; recorded at different angles
15°, 30°, 45° and 60° .
ture. The UV–Vis absorption spectrometer model V-550, made by JASCO (United States), available in the Food
Research Laboratory of the faculty of chemical engineering, Amirkabir University of technology was employed.
This spectrometer has a resolution of less than 1.0 nm, and a 2000 Multichannel detector. The data acquired by
spectrometer were analyzed by a computer equipped with Spectra Manager software. HMF (5-Hydroxymethyl-
2-furaldehyde with 99% purity) purchased from Sigma-Aldrich and the standard solution (50 μM) was prepared
with deionized water for determination of UV–Vis absorption spectrum of the HMF.
Chemical specifications. In order to verification of the results, standard methods were utilized to measure
the content of furosine and HMF. For determination of the furosine content, HPLC analysis was accomplished
based on the method of Delgado et al. 14,31. Measurement of hydroxymethylfurfural (HMF) in fresh and heated
citrus honey was performed based on the White method32.
Results
The experimental results are represented in the following order. First, reabsorption of the furosine emission by
riboflavin molecules (as 2nd-IFE) has been investigated through an angular measurement of the spectra. Sub-
sequently, LIF emission of the stored honey has been characterized based on the specific optical parameters that
are defined with regard to the reabsorption process. Finally, results of the LIF spectroscopy regarding the heated
citrus honey as well as several samples of two honey types provided from different geographical areas but with the
same botanical origin have been assessed. Chemical measurements have been accomplished to verify the results.
Angular dependence of the 2nd‑IFE in fresh honey. Fig. 3a–h depict typical LIF spectra of fresh
honey samples with different botanical origin (Astragalus, Citrus, Eucalyptus, Multi-Floral, Spring, Thyme, Zir-
fon and Ziziphus) recorded at different detection angles 15°, 30°, 45° and 60°.
Plotting the intensity and corresponding wavelength in terms of the detection angle, one can realize angular
dependence in both peak intensity and wavelength (Figs. 4 and 5). In general, the fluorescence intensity decreases
versus the observation angle. As shown in Fig. 5a,b by increasing the detection angle spectral red shift occurs for
both peaks. Notice that the left peak (peak#1) experiences larger red shift due to its wider overlap area with the
riboflavin absorption spectrum (see Fig. 2c). Moreover, riboflavin molecules reabsorb the furosine emission and
re-emit fluorescence with different quantum distribution which does not overlap with the furosine’s absorption
Scientific Reports | (2022) 12:901 | https://doi.org/10.1038/s41598-022-04920-w 5
Vol.:(0123456789)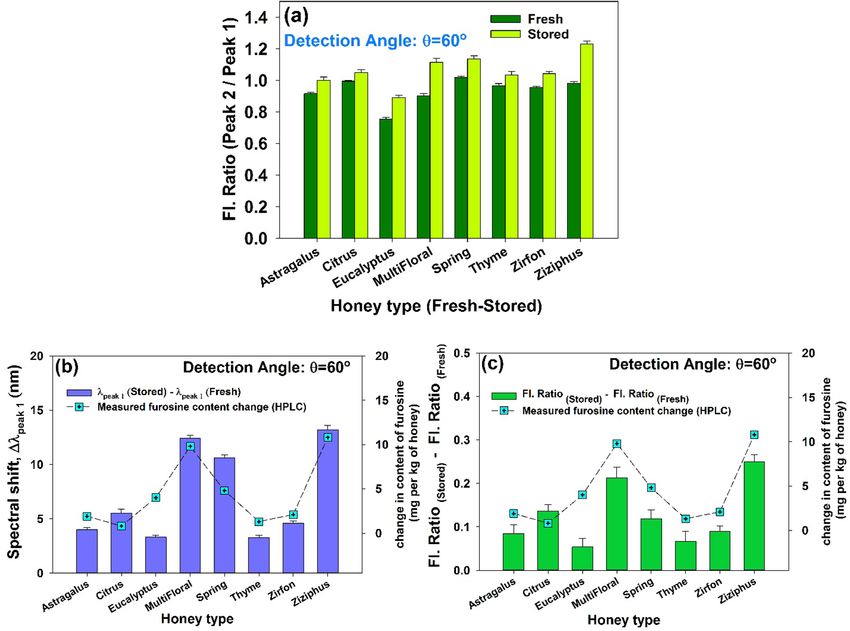
www.nature.com/scientificreports/
Figure 4. Intensities of the left (filled square, red color) and right (filled triangle, blue color) peaks of the
doubled-peak LIF spectra of fresh honey samples and corresponding Intensity ratio I Peak#2/IPeak#1 (filled circle,
black color) versus the detection angle (θ = 15°, 30°, 45° and 60°).
spectrum. As a consequence, loss for furosine leads to the gain for riboflavin. According to Fig. 5c, as the detec-
tion angle increases, intensities of two peaks decrease unequally such that the ratio IPeak#2/IPeak#1 increases (in all
the honey types the decrease in intensity of the left peak is much greater). Such an angular dependence could
be explained based on the anisotropic reabsorption of the fluorescence emission by non-excited riboflavin and
furosine molecules outside the excitation volume.
In summary, both riboflavin and furosine molecules in the pathway of the laser beam are most likely excited
while those located out of the pumped volume remain in the ground state; therefore the larger observation angle
corresponds to the more reabsorption events for the left peak of the fluorescence emission (furosine emission),
leading to the more intensity reduction for this fluorescence peak and subsequent larger red shift. Moreover,
unidirectional energy transfer from furosine to riboflavin leads to loss for furosine’s emission and gain for ribo-
flavin’s emission. As a result, IPeak#2/IPeak#1 increases not only because of the reabsorption of left peak, but also due
to the enhancement of the right peak. Therefore, both parameters I Peak#2/IPeak#1 and λpeak#1 should be considered
for characterization of the detected fluorescence spectra.
LIF spectra of the stored and fresh honey samples. In order to establish a quantitative relation
between the 2nd-IFE of LIF and the content of furosine, Fresh and stored samples of different honey types were
subjected to LIF spectroscopy. According to the results of angular assessment, detection angle of 60° was chosen
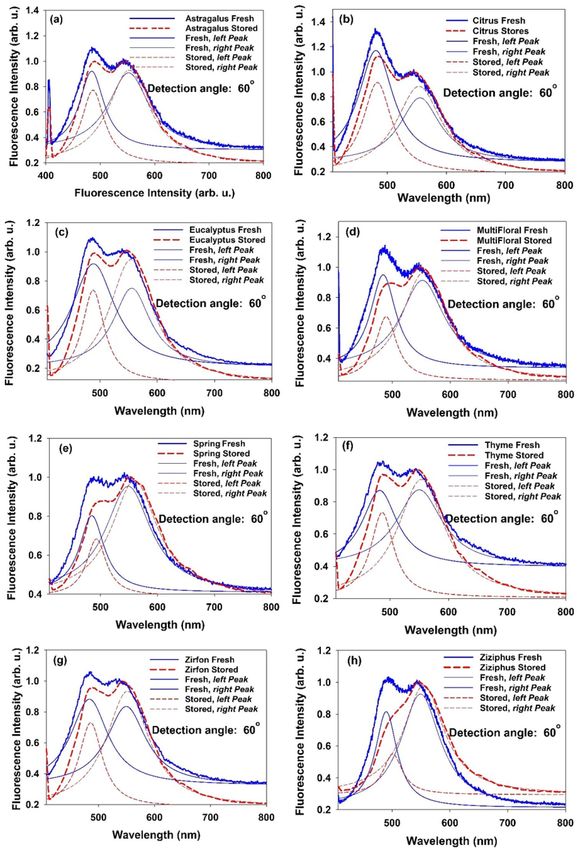
in order to encounter the significant change of the intensity and corresponding spectral shift. Figure 6a–h depict
LIF spectra and the corresponding deconvoluted peaks of the fresh and stored honey samples. For each honey
type, right peaks of the fresh and stored samples were normalized in order to better comparison with the left
peaks. It is observed that for all honey types, LIF intensity ratio (Ipeak#2/Ipeak#1) of the stored honey is greater than
that of fresh one (see Fig. 7a). In addition, for all types of honey, LIF peak of the stored sample is red-shifted
respect to the fresh one (see Fig. 7b,c).
In order to elucidate these result, the amount of furosine in fresh and stored samples were determined by
direct chemical measurements. Table 2 provides the furosine content in fresh and stored (1 year) samples of
different honey types which has been measured utilizing HPLC technique.
As explained in the methods section, the observed non-intrinsic spectral red shift is due to the reabsorption
events as 2nd-IFE. In other words, spectral red shift of the left peak is correlated to asymmetric change in the
Scientific Reports | (2022) 12:901 | https://doi.org/10.1038/s41598-022-04920-w 6
Vol:.(1234567890)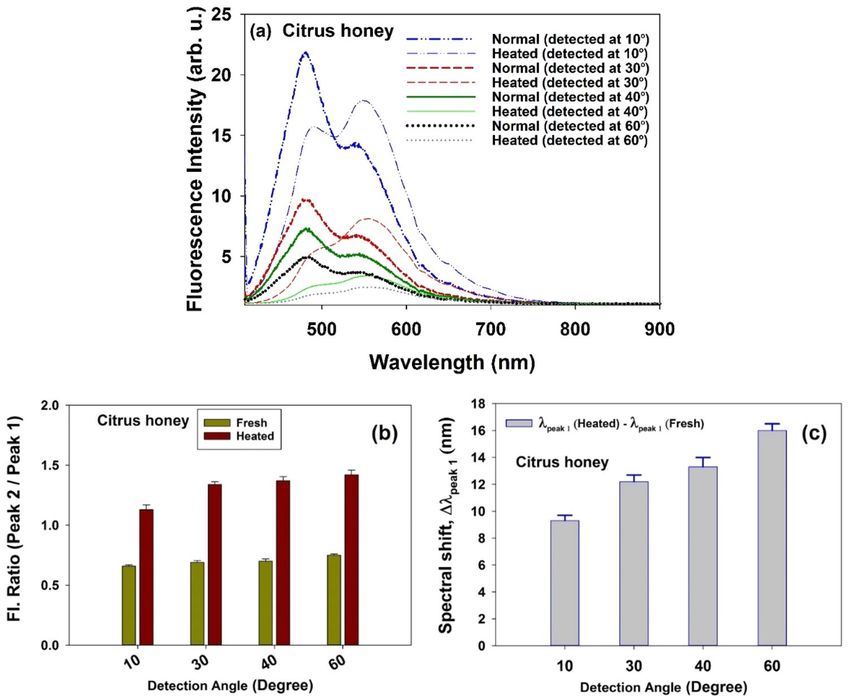
www.nature.com/scientificreports/
Figure 5. Wavelength of the (a) left and (b) right peaks of the LIF spectra versus detection angle (θ = 15°, 30°,
45° and 60°) regarding the fresh honey samples. The left peak experiences larger spectral red shift than the peak
on the right due to stronger reabsorption events (as 2nd-IFE). (c) Intensity ratio of the peaks (IRight peak/ILeft peak)
for 8 fresh honey types versus the detection angle (θ = 15°, 30°, 45° and 60°). In all honey types the left peak
experiences much larger increase than the peak on the right.
intensity of the fluorescence spectrum (increase in I peak#2/Ipeak#1). Figure 7b,c ascertains such a correlation to be
used for the assessment of the honey freshness. In Fig. 7b,c two parameters i.e. spectral shift and intensity ratio
(Ipeak#2/Ipeak#1) are compared, respectively, with the measured changes in the amount of furosine (based on data
presented in Table 2) for different types of honey. It follows that the change in furosine content in honey, whether
it is fresh or stored, strongly depends on the honey type. This result is consistent with the reports based on direct
measurement of furosine in different honey types utilizing chemical t echniques2,15.
Figure 8a depicts intensity ratio ( Ipeak#2/Ipeak#1) versus the wavelength at the left peak (peak#1) of fresh and
stored samples of different honey types. Different types of honey (both fresh and stored samples) are located in
different parts of the phase space.
For each type of honey, distance between the fresh and stored points is proportional to the amount of furosine
produced after 1 year. To assess the accuracy of the method, samples of two honey types provided from several
beekeepers in different geographical areas (but with the same botanical origin) were examined. Figure 8b dem-
onstrates the distribution of honey samples taken from different geographical areas but with the same botanical
origin, in Ipeak#2/Ipeak#1 versus λpeak,1 diagram. As can be seen, statistical error of calculating Ipeak#2/Ipeak#1
(averaging the measured data) is higher than that of λpeak,1 because emission intensity is affected by several
factors (reabsorption, light scattering and ambient noises), while emission wavelength is mainly determined by
reabsorption events30.
LIF spectroscopy of the heated and fresh honey sample. Finally, fluorescence features of the heated
citrus honey was examined. Figure 9a represents LIF spectra due to excitation of the fresh and heated (at 80 °C)
citrus honey samples at detection angles 15°, 30°, 45° and 60°. In general, LIF emission of the heated sample is
less intense. Similar to results of the storage experiments, at each detection angle, a comparison of two samples
reveals that right peak-to-left peak intensity ratio ( Ipeak#2/Ipeak#1) of the heated sample is greater and encounters
a notable spectral red shift relative to the fresh one. Moreover, consideration of the angular dependence reveals
that the 2nd-IFE enhances as the angle increases (Fig. 9b,c), which is in harmony with the results of the angular
assessment.
It is worth noting that both spectral red shift and the difference in the intensity ratio (Ipeak#2/Ipeak#1) between
fresh and heated citrus samples are much greater respect to that for fresh and stored samples.
Measured amounts of furosine/HMF were 11.5/20.8 (mg in kg of honey) for fresh and 28.3/175.0 (mg in kg
of honey) for heated honeys, respectively. Drastic increase in HMF content with regard to the severe heating
Scientific Reports | (2022) 12:901 | https://doi.org/10.1038/s41598-022-04920-w 7
Vol.:(0123456789)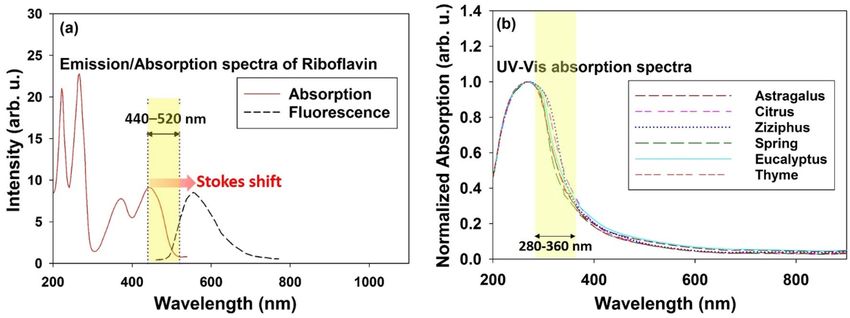
www.nature.com/scientificreports/
Figure 6. LIF spectra and corresponding deconvoluted peaks of the fresh and stored samples of 8 honey types.
Detection angle of θ = 60° was chosen to measure the significant alteration in intensity and the related spectral
shift.
condition is a dmissible33. Also, the content of furosine is more than twice its initial amount, which is in accord-
ance with the significant increase in the value of I peak#2/Ipeak#1 and corresponding spectral shift.
Discussion
Honey as a high nutritional value product is an intricate blend of several components e. g. carbohydrates, organic
acids, aminoacids, pollen, lactones, minerals, enzymes and vitamins. Quality of honey is determined based on
various parameters among which the content of furosine indicates the extent of the storage time or heat treat-
ments. Furosine is produced in honey due to acid hydrolysis of the fructosyl-lysine that is generated following
Scientific Reports | (2022) 12:901 | https://doi.org/10.1038/s41598-022-04920-w 8
Vol:.(1234567890)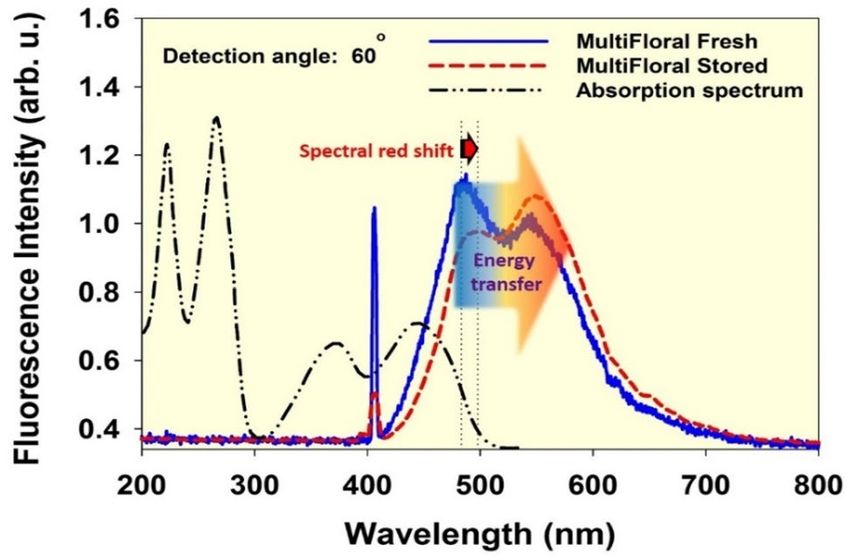
www.nature.com/scientificreports/
Figure 7. (a) Right peak-to-left peak intensity ratio (Ipeak#2/Ipeak#1) of the LIF spectra due to excitation of fresh
and stored honey samples of 8 type. Detection angle of 60° was chosen to measure the significant alteration in
intensity. (b) Spectral shift (red shift) of the left peak (peak 1) and (c) Change in the intensity ratio, [Ipeak#2/Ipeak#1
(Stored)—Ipeak#2/Ipeak#1 (Fresh)], due to excitation of fresh and stored honey samples of 8 type at detection angles
θ = 60°. Measured furosine content is denoted for comparison. (Samples were stored at 25 ± 2 °C for 1 year).
the Maillard reactions over time. Therefore, it can be a reliable indicator for assessment of the freshness of honey.
Under the illumination of a given honey sample in a cylindrical cuvette by a narrow beam of CW-diode laser at
405 nm, Maillard reaction products (especially furosine) and riboflavin molecules are excited (utilized wavelength
does not excite phenolic compounds, aromatic amino acids and HMF to fluorescent emission). Those excited
molecules in pumped area (mainly riboflavin and furosine) emit fluorescence photons in all directions. The
emitted photons that have passed through the excited region are probably reabsorbed by ground state riboflavin
and/or furosine molecules outside the excitation volume. Following Eq. (1), one can write relations regarding
the wavelength dependent loss terms for fluorescence emission of the riboflavin and furosine molecules after
traveling an average distance d before leaving the medium as follows:
�d � � � � � �
fluor. Rib. fluor. GS Fur. fluor. GS
lossFur. ( Fur. , d) ∝ exp − σabs. Fur. NRib. (l) + σabs. Fur. NFur (l) dl (2)
0
�d � � � �
fluor. Rib. fluor. GS
lossRib. ( Rib. , d) ∝ exp − σabs. Rib. NRib. (l) dl (3)
0
where d is the mean travelling length of the emitted photons at wavelength fluor., σabs. is molecular absorption
cross-section, N GS is the number density of ground state molecules as a function of position and the indices Fur.
and Rib. ascertain the riboflavin or furosine species respectively. Based on Eqs. (2) and (3), in addition to the
absorption cross-section, the abundance of ground state molecules
along the way of photons is also crucial
parameter in determining the amount of loss. Notice that σabs.Fur. fluor. is negligible according to Fig. 2c and data
Rib.
presented in Table 1, therefore its contribution in Eq. (2) was eliminated. Moreover, it should be accentuated that
loss for furosine emission ultimately leads to an increase in the fluorescence intensity of riboflavin. The process
is graphically represented in Fig. 10.
Scientific Reports | (2022) 12:901 | https://doi.org/10.1038/s41598-022-04920-w 9
Vol.:(0123456789)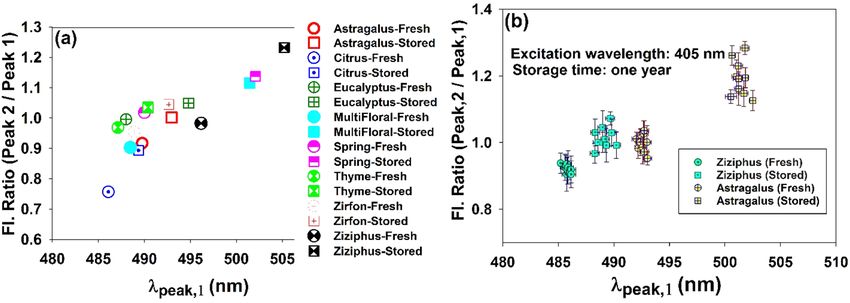
www.nature.com/scientificreports/
Furosine content (mg in
1 kg honey)
Honey type Fresh Stored (1 year)
Astragalus 13.8 15.7
Citrus 11.6 12.3
Eucalyptus 18.4 22.4
Multi-Floral 21.3 31.1
Spring 22.5 27.3
Thyme 35.6 36.9
Zirfon 17.3 19.4
Ziziphus 31.7 42.5
Table 2. Furosine content in fresh and stored honey samples measured by HPLC technique.
Figure 8. (a) LIF intensity ratio (Ipeak#2/Ipeak#1) versus the wavelength of the peak 1 (left peak) for both fresh and
stored samples of different honey types. (b) Distribution of the honey samples with different geographical areas
but with the same botanical origin (Ziziphus and Astragalus), in the diagram of ((Ipeak#2/Ipeak#1 vs. λpeak,1)).
Reabsorption of the fluorescence emission mainly occurs within the spectral range of the furosine’s fluores-
cence (see Fig. 2c). As the amount of riboflavin in honey is almost constant over time, rise of the furosine content
during the storage time enhances the rate of reabsorption (as 2nd-IFE). As a result, significant reduction of the
furosine emission intensity and corresponding spectral red shift occurs in addition to increase of the riboflavin
fluorescence intensity due to enhancement of the unidirectional radiative energy transfer from excited furosine
to ground state riboflavin. In fact, over time, two significant changes occur in the double-peaked fluorescence
spectrum of the stored honey, as measured by the specified LIF spectroscopy arrangement presented in this
report: (1) spectral red shift of the left peak (furosine contribution) (2) increasing the intensity ratio of the right
peak (riboflavin contribution) to the left peak (furosine contribution). First event is a result of the reabsorp-
tion (as 2nd-IFE) of furosine emission outside the excited volume, which enhances by increasing the furosine
concentration. The second event arises from the unequal changeover of the intensities of two peaks such that
the intensity of the left peak decreases (due to 2nd-IFE) while intensity of the right peak enhances (due to uni-
directional radiative energy transfer from excited furosine to ground state riboflavin).
Furosine level of native honey samples including 8 types with different botanical origin i. e. Astragalus, Citrus,
Eucalyptus, Thyme, Zirfon, Ziziphus (6 unifloral honeys) as well as Multi-Floral and Spring (2 multifloral hon-
eys) were determined before and after the 1 year storage using standard HPLC analysis (see Methods section).
Furosine formation over time (ranging 0.7–10.8 mg per kg of honey) is shown to be correlated with character-
istic spectral changeover of doubled-peak fluorescence spectra i.e. red shift of the left peak (4.0–13.2 nm) and
increase of the intensity ratio, i. e. Δ(IRight peak/ILeft peak) ~ 0.05–0.24. It is remarkable to compare the measured
values of furosine content with those provided by other reports. Table 3 represents the reported values of the
furosine content generated due to either heating or long storage of the h oney2,14,16. In general, alteration of the
furosine content during the storage or heating varies depending on the honey type and different protein content.
Statistical analysis was performed for a total of 73 samples used in the experiments. Utilizing standard paired
t-test based on Shapiro–Wilk normality test in SigmaPlot v.14 package it was obtained that at the 99% confidence
level, intensity ratio (Ipeak#2/Ipeak#1) increases after 1 year storage and the wavelength of the left peak of doubled-
peak fluorescence encounters significant red shift in stored honey sample respect to the fresh one. In addition,
scrutiny of the amount of furosine generated in different honey types (which has been chemically measured)
ascertain that the amount of furosine produced in each type of honey corresponds to the rate of changes of two
spectral parameters at the 73% confidence level.
Plot of LIF intensity ratio (Ipeak#2/Ipeak#1) versus the wavelength of the left peak (λpeak,1) enables various honey
types to be distributed according to the furosine content. It is well known that the different honey types contain
Scientific Reports | (2022) 12:901 | https://doi.org/10.1038/s41598-022-04920-w 10
Vol:.(1234567890)www.nature.com/scientificreports/
Figure 9. (a) LIF spectra due to excitation of fresh and heated citrus honey samples at detection angles 15°, 30°,
45° and 60° (b) Ipeak#2/Ipeak#1 of LIF spectra due to excitation of fresh and heated citrus honey samples and (c)
corresponding spectral shift (red shift) at various detection angles θ = 15°, 30°, 45° and 60° (samples were heated
at 80 °C for 60 min).
Figure 10. Typical LIF spectra of the fresh and stored multifloral honey samples excited by laser at 405 nm and
recorded at angle θ = 60°. UV–Vis spectrum of riboflavin aqueous solution have been appended.
different protein content. Moreover, the protein content of honey is directly related to its furosine content2,3,15.
As a result, it is reasonable to assess the introduced optical parameters in order to make proper set of principle
components and recast the honey types along the principal components axes. However, in order to accomplish
the analysis, for each honey type a large number of the samples from different geographical areas must be
examined in order to perform the various steps of the principle component analysis (PCA) i. e. standardization,
computation of the covariance matrix and assessment of the feature vector with sufficient accuracy. This idea
could be the subject of a future study on the discrimination of the different honey types based on the assessment
of furosine and HMF content.
Assay of the data obtained from honey samples with different geographical areas but with the same botanical
origin (i.e. Ziziphus and Astragalus) reveals that under the same conditions, the amount of furosine produced
Scientific Reports | (2022) 12:901 | https://doi.org/10.1038/s41598-022-04920-w 11
Vol.:(0123456789)www.nature.com/scientificreports/
Generated
content
(mgkg−1
Authors Honey type Method Furosine formation mechanism honey)
45 min 11.7
Reversed phase liquid Heat treatment at 50 °C
Villamiel et al.2 Rosemary 90 min 14.8
chromatography for:
135 min 19.5
5 min 0.2
Ion-pair reversed phase Heat treatment at 70 °C
Cárdenas-Ruiz et al.14 Multi-floral 15 min 7.1
liquid chromatography for:
45 min 22.3
5h 1.6
10 h 4.7
Heat treatment at 50 °C
24 h 9.9
for:
Various types (not- Ion-pair reversed phase 29 h 7.5
Morales et al.16
specified) liquid chromatography 34 h 3.2
Type 1 3.7
Storage at room tem-
2 years Type 2 3.1
perature
Type 3 15.5
Citrus HPLC/LIF Heat treatment at 80 °C for 60 min 16.8
Astragalus 1.9
Citrus 0.7
Eucalyptus 4
This report Multi-Floral 9.8
HPLC/LIF Storage at room temperature 1 year
Spring 4.8
Thyme 1.3
Zirfon 2.1
Ziziphus 10.8
Table 3. Comparison of the measured furosine content with those provided by other reports.
in a given type of unifloral honey does not depend significantly on geographical origin, so that those samples
are localized in a limited area in the diagram of I peak#2/Ipeak#1 versus λpeak,1.
Limitations
The present research was intended to be an empirical survey of randomly sampled unifloral and multifloral
honeys, to ascertain a reliable optical technique for assessment of honey’s freshness.
The main limitation of the proposed method is that despite being simple, fast, real-time and low cost, the
measurement is performed indirectly. As a result, a large number of data is required for preparing an accurate
calibration curve. Since the amount of furosine and HMF formation are not necessarily the same in different
honey types (due to the different content of sugars, proline and acidity), based on the present data set, no accu-
rate quantitative relation can be made between the amount of furosine and the values of two specified spectral
quantities. In fact, it is necessary to prepare and examine a larger number of unifloral and multifloral honey
samples of different botanical origin from several geographical areas.
Another limitation arises from limited time interval (1 year). In fact, for each type of honey, the amount of
furosine as well as the spectral quantities must be measured at regular intervals during the storage time. Time
resolved measurements by chemical methods reveal that the amount of furosine in honey changes nonlinearly
over time. Therefore, in addition to increasing the number of data, it is necessary to measure the optical param-
eters in several time intervals.
Finally, it is also necessary to determine the relationship between the heating rate and the changes in the
spectral quantities and to compare them with the results of the long-term storage experiments.
Data availability
The datasets obtained by experiments and/or analyzed during the current research are available from the cor-
responding author on reasonable request.
Received: 24 September 2021; Accepted: 4 January 2022
References
1. Machado De-Melo, A. A., de Almeida-Muradian, L. B., Teresa, S. M. & Pascual-Maté, A. Composition and properties of Apis
mellifera honey: A review. J. Apic. Res. 57, 5–37 (2018).
2. Villamiel, M., del Castillo, M. D., Corzo, N. & Olano, A. Presence of furosine in honeys. J. Sci. Food Agric. 81, 790–793 (2001).
Scientific Reports | (2022) 12:901 | https://doi.org/10.1038/s41598-022-04920-w 12
Vol:.(1234567890)www.nature.com/scientificreports/
3. Mesías, M., Sáez-Escudero, L., Morales, F. J. & Delgado-Andrade, C. Occurrence of furosine and hydroxymethylfurfural in breakfast
cereals, evolution of the Spanish market from 2006 to 2018. Foods 8, 158 (2019).
4. Li, Y. et al. Profiles of initial, intermediate, and advanced stages of harmful Maillard reaction products in whole-milk powders
pre-treated with different heat loads during 18 months of storage. Food Chem. 351, 129361 (2021).
5. Marconi, E., Caboni, M. F., Messia, M. C. & Panfili, G. Furosine: A suitable marker for assessing the freshness of royal jelly. J. Agric.
Food Chem. 50, 2825–2829 (2002).
6. Li, Y., Liu, X., Meng, L. & Wang, Y. Qualitative and quantitative analysis of furosine in fresh and processed ginsengs. J. Ginseng
Res. 42, 21–26 (2018).
7. Resmini, P. P., Pellegrino, L. & Cattaneo, S. Furosine and other heat treatment indicators for detecting fraud in milk and milk
products. Ital. J. Food Sci. 15, 473–483 (2003).
8. Yamaguchi, K., Nomi, Y., Homma, T., Kasai, M. & Otsuka, Y. Determination of furosine and fluorescence as markers of the mail-
lard reaction for the evaluation of meat products during actual cooking conditions. Food Sci. Technol. Res. 18, 67–76 (2012).
9. Schwietzke, U., Malinowski, J., Zerge, K. & Henle, T. Quantification of amadori products in cheese. Eur. Food Res. Technol. 233(2),
243–251 (2011).
10. Giannetti, V., Mariani, M. B. & Colicchia, S. Furosine as marker of quality in dried durum wheat pasta: Impact of heat treatment
on food quality and security—A review. Food Control. 125, 108036 (2021).
11. Kulmyrzaev, A. & Dufour, É. Determination of lactulose and furosine in milk using front-face fluorescence spectroscopy. Lait 82,
725–735 (2002).
12. Babu, K. S. & Amamcharla, J. K. Application of front-face fluorescence spectroscopy as a tool for monitoring changes in milk
protein concentrate powders during storage. J. Dairy Sci. 101, 10844–10859 (2018).
13. Aalaei, K., Rayner, M. & Sjoholm, I. Chemical methods and techniques to monitor early Maillard reaction in milk products; A
review. Crit. Rev. Food Sci. Nutr. 59, 1829–1839 (2019).
14. Cárdenas-Ruiz, J., Garcia-Villanova, B. & Guerra-Hernandez, E. Determination of furosine in honey. J. Liquid Chromatogr. 26,
317–326 (2003).
15. Sanz, M. L., del Castillo, M. D., Corzo, N. & Olano, A. 2-Furoylmethyl amino acids and hydroxymethylfurfural as indicators of
honey quality. J Agric. Food Chem. 51, 4278–4283 (2003).
16. Morales, V., Sanz, M. L., Martín-Álvarez, P. J. & Corzo, N. Combined use of HMF and furosine to assess fresh honey quality. J. Sci.
Food Agric. 89, 1332–1338 (2009).
17 Singla, R. K., Dubey, A. K., Ameen, S. M., Montalto, S. & Parisi, S. Analytical Methods for the Determination of Furosine in Food
Products. Analytical Methods for the Assessment of Maillard Reactions in Foods. SpringerBriefs in Molecular Science (Springer, 2018).
18. Kamal, M. & Karoui, R. Monitoring of mild heat treatment of camel milk by front-face fluorescence spectroscopy. LWT Food Sci.
Technol. 79, 586–593 (2017).
19 Lakowicz, J. R. Principles of Fluorescence Spectroscopy (Springer, 2006).
20. Bachmann, L., Zezell, D. M., Ribeiro, A. D. C., Gomes, L. & Ito, A. S. Fluorescence spectroscopy of biological tissues: A review.
Appl. Spectrosc. Rev. 41, 575–590 (2006).
21. Panigrahi, S. K. & Mishra, A. K. Inner filter effect in fluorescence spectroscopy: As a problem and as a solution. J. Photochem.
Photobiol. C: Photochem. Rev. 41, 100318 (2019).
22. Kothawala, D. N., Murphy, K. R., Stedmon, C. A., Weyhenmeyer, G. A. & Tranvik, L. J. Inner filter correction of dissolved organic
matter fluorescence. Limnol. Oceanogr.-Meth. 11, 616–630 (2013).
23 Ceresa, L. et al. On the origin and correction for inner filter effects in fluorescence. Part II: Secondary inner filter effect -the proper
use of front-face configuration for highly absorbing and scattering samples. Methods Appl. Fluoresc. 9(3), 035005 (2021).
24. Xu, J. X., Vithanage, B. C. N., Athukorale, S. A. & Zhang, D. Absorption and scattering differ drastically in their inner filter effects on
fluorescence, resonance synchronous, and polarized resonance synchronous spectroscopic measurements. Analyst 143, 3382–3389
(2018).
25. Panigrahi, S. K. & Mishra, A. K. Inner filter effect in fluorescence spectroscopy: As a problem and as a solution. J. Photochem.
Photobiol. C: Photochem. Rev. 41, 100318 (2019).
26. Lenhardt, L., Bro, R., Zeković, I., Dramićanin, T. & Dramićanin, M. D. Fluorescence spectroscopy coupled with PARAFAC and
PLSDA for characterization and classification of honey. Food Chem. 175, 284–291 (2015).
27. Dramićanin, T., LenhardtAckovic, L., Zeković, I. & Dramićanin, M. D. Detection of adulterated honey by fluorescence excitation-
emission matrices. J. Spectrosc. 2018, 8395212 (2018).
28 Rodrı́guez-Delgado, M. A., Malovaná, S., Pérez, J. P., Borges, T. & Garcı́aMontelongo, F. J. Separation of phenolic compounds by
high-performance liquid chromatography with absorbance and fluorimetric detection. J. Chromatogr. A 912(2), 249–257 (2001).
29. Hudz, N., Korzeniowska, K. & Wieczorek, P. P. Chemical transformations of glucose in solutions for peritoneal dialysis after
sterilization and during storage. Acta Pol. Pharm. Drug Res. 4, 875–883 (2018).
30. Bavali, A., Parvin, P., Tavassoli, M. & Mohebbifar, M. R. Angular distribution of laser-induced fluorescence emission of active dyes
in scattering media. Appl. Opt. 57, B32–B38 (2018).
31. Wang, F., Zhang, Y., Wen, F., Zheng, N. & Wang, J. Rapid determination of furosine in milk using microwave-assisted HCl hydrolysis
and ultra-performance liquid chromatography. J. Dairy Sci. 103(12), 11086–11093 (2020).
32. Gkoutzouvelidou, M., Panos, G., Xanthou, M. N., Papachristoforou, A. & Giaouris, E. Comparing the antimicrobial actions of
greek honeys from the Island of Lemnos and Manuka Honey from New Zealand against clinically important bacteria. Foods 10(6),
1402 (2021).
33. Fallico, B., Zappala, M., Arena, E. & Verzera, A. Effects of conditioning on HMF content in unifloral honeys. Food Chem. 85,
305–313 (2004).
Acknowledgements
The authors appreciate the Zanbordaranpishro Company for their assistance to prepare native honey samples as
well as Mr M. Hashemi for his useful discussions. We are also grateful of Prof. Parviz Parvin from optics & laser
laboratory, physics department of Amirkabir University of technology, Tehran, Iran, for his kind collaboration.
Author contributions
A.B. devised and designed the LIF experiments. A.M. performed the LIF experiment; F. M. K performed chemical
measurements; A.B. and A.M. developed the method and analyzed the experimental data. All authors discussed
the data. F.M.K. contributed to chemical data analysis; A.B. and A.M. prepared Figure and wrote the manuscript.
All authors reviewed the manuscript.
Competing interests
The authors declare no competing interests.
Scientific Reports | (2022) 12:901 | https://doi.org/10.1038/s41598-022-04920-w 13
Vol.:(0123456789)www.nature.com/scientificreports/
Additional information
Correspondence and requests for materials should be addressed to A.B.
Reprints and permissions information is available at www.nature.com/reprints.
Publisher’s note Springer Nature remains neutral with regard to jurisdictional claims in published maps and
institutional affiliations.
Open Access This article is licensed under a Creative Commons Attribution 4.0 International
License, which permits use, sharing, adaptation, distribution and reproduction in any medium or
format, as long as you give appropriate credit to the original author(s) and the source, provide a link to the
Creative Commons licence, and indicate if changes were made. The images or other third party material in this
article are included in the article’s Creative Commons licence, unless indicated otherwise in a credit line to the
material. If material is not included in the article’s Creative Commons licence and your intended use is not
permitted by statutory regulation or exceeds the permitted use, you will need to obtain permission directly from
the copyright holder. To view a copy of this licence, visit http://creativecommons.org/licenses/by/4.0/.
© The Author(s) 2022
Scientific Reports | (2022) 12:901 | https://doi.org/10.1038/s41598-022-04920-w 14
Vol:.(1234567890)You can also read