Asia-Pacific Markets Monthly - October 2021 Highlights and Insights from S&P Global Market Intelligence - S&P Global
←
→
Page content transcription
If your browser does not render page correctly, please read the page content below

October 2021

Asia-Pacific
Markets Monthly
Highlights and Insights from S&P Global Market Intelligence

                                                              Copyright © 2021 by S&P Global Market Intelligence, a division of S&P Global Inc. All rights reserved.
Table of Contents
 Content By S&P Global Market Intelligence:
            P.3       Asia Takes Center Stage For Blank-check IPOs As Hong Kong, Singapore Join Fray
            P.4       EV Impact: Electric Vehicle Surge Resonates Across Global Economy
           P.5        Consumer Profiles: Asia's 40-somethings Match Younger Adult TV/Video Viewing
           P.7-9      M&A Activity By Country, Sector
           P.10       Initial Public Offerings
           P.11       Private Equity Investments & Buyouts
           P.12       Venture Capital Investments

 Content By S&P Global Ratings:
           P.14       Credit Conditions Asia-Pacific Q4 2021: COVID Besets, China Reset
           P.15       Recent S&P Global Credit Ratings Actions

 Content By S&P Dow Jones Indices:
           P.17-18 Market Attributes: Index Dashboard

To learn more about S&P Global Market Intelligence, please email us at SPGMIMarketingAPAC@spglobal.com   S&P Global Market Intelligence Asia-Pacific Markets Monthly – October 2021 | Page 2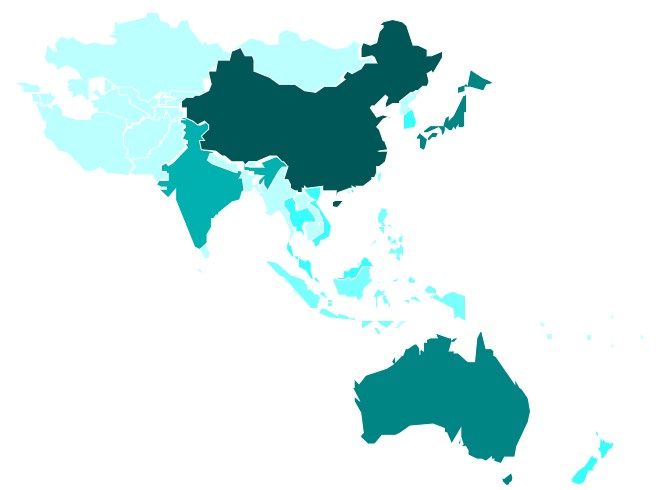
Asia Takes Center Stage For Blank-check IPOs As Hong
 Kong, Singapore Join Fray
 Sep 20, 2021 - The craze for blank-check companies could pick up in Asia, where more regional startups are                         More Top Stories:
 likely to explore that route to list, seeking to tap the advantages of familiarity among investors, time zones and                 Sep 13, 2021 - Australian investors' quest for unicorns
 less onerous paperwork.                                                                                                            to fuel fintech IPO fest

 Hong Kong Exchanges and Clearing Ltd., or HKEX, opened a consultation on its proposed rules for special                            Sep 8, 2021 - Chinese banks may raise more Tier 2
 purpose acquisition companies — skeleton organizations that launch with the intention of buying and reverse                        debt to bolster capital amid uncertainties
 merging with a private company — on Sept. 17. Smaller rival Singapore Exchange Ltd., or SGX, is reported to
 be in discussion with potential listing candidates after its SPAC framework came into effect on Sept. 3.                           Aug 31, 2021 - Japan's private issuers might not rush
                                                                                                                                    into social bonds despite government push
 Elsewhere in the region, South Korea and Malaysia has allowed blank-check companies to list.
                                                                                                                                    Aug 24, 2021 -Paytm parent may grow lending, wealth
 Read the full article >                                                                                                            business after India's biggest IPO

                                                                                                                                    Real-Time Alerts
                                                                                                                                    Interested to see more?
                                                                                                                                    Request a free trial to see how our coverage approach
                                                                                                                                    can enhance your analysis of global financial
                                                                                                                                    institutions.
                                                                                                                                    Already subscribed to the S&P Capital IQ Pro
                                                                                                                                    platform?
                                                                                                                                    Click here to receive real-time alerts on emerging
                                                                                                                                    trends and topics of interest produced by our
                                                                                                                                    research analysts and news staffs.

To learn more about S&P Global Market Intelligence, please email us at SPGMIMarketingAPAC@spglobal.com   S&P Global Market Intelligence Asia-Pacific Markets Monthly – October 2021 | Page 3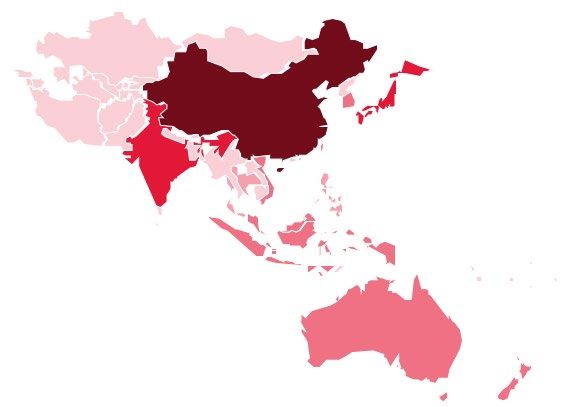
EV Impact: Electric Vehicle Surge Resonates Across
 Global Economy
 Sep 20, 2021 - If it seems like electric vehicles are proliferating in unprecedented volume and variety, it's                      More Top Stories:
 because they are — and they're gradually changing the world around them. Fueled by skyrocketing demand in
 Europe, China and the U.S., sales of pure electric and plug-in hybrid passenger vehicles in 2021 are on pace to                    Metals Market Analysis
 more than double to a record 6.2 million units, according to S&P Global Market Intelligence data. At nearly 9%
                                                                                                                                    Sep 29, 2021 - Fossil fuels dominate top West
 of the global passenger vehicle market, up from less than 3% just two years ago, this marks an emphatic finish
                                                                                                                                    Australian miners' power generation capacity
 to a long ascent to commercial relevance. Read the full article >
                                                                                                                                    Sep 23, 2021 - China's pivot from overseas coal sends
                                                                                                                                    strong signal, but experts await details

                                                                                                                                    Sep 22, 2021 - Green energy revolution — Boost for
                                                                                                                                    industrial metals demand

                                                                                                                                    Sep 20, 2021 - Utilities face greatest threat as climate
                                                                                                                                    risks intensify

                                                                                                                                    Sep 10, 2021 - Australia's position as top bauxite
                                                                                                                                    producer to strengthen amid Guinea coup

                                                                                                                                    Power your mining industry analysis with
                                                                                                                                    actionable insights.
                                                                                                                                    Our interactive metals and mining service provides a
                                                                                                                                    comprehensive view of global mining industry
                                                                                                                                    activities. From worldwide exploration, development,
                                                                                                                                    production, mine cost analysis, acquisitions activity,
                                                                                                                                    commodity market forecasts, and credit risk
                                                                                                                                    assessments—our unbiased insight can power your
                                                                                                                                    mining analysis. Learn more >

                                                                                                                                    Subscribe to our newsletter for more essential insights
                                                                                                                                    on how COVID-19 affects the energy and mining sector.

To learn more about S&P Global Market Intelligence, please email us at SPGMIMarketingAPAC@spglobal.com   S&P Global Market Intelligence Asia-Pacific Markets Monthly – October 2021 | Page 4
Consumer Profiles: Asia's 40-somethings Match Younger
Adult TV/Video Viewing
 Sep 13, 2021 - Kagan's Asia Consumer Insights survey results show that 40-something adults in China, South                         More Top Stories:
 Korea and India spend less time on digital entertainment than younger adults, but TV/video consumption
 remains strong. In India, for example, 40-somethings spend an average of 6.8 hours per day on digital                              Sep 28, 2021 - European sports rights chase digital
                                                                                                                                    dream in China
 entertainment, substantially lower than 30-somethings (7.4 hours per day on average) and 20-somethings (8
 hours per day on average). However, the lower overall daily consumption for those in their 40s is due to                           Sep 27, 2021 - APAC insurance companies raise $4.57B
 spending less time listening to music and playing video games than their younger counterparts. The data                            so far in 2021; AIA Group tops list
 reveals that India's 40-somethings spend approximately the same amount of time watching TV/video each day
 as younger adults. Read the full article >                                                                                         Sep 15, 2021 - Q2'21 global smart TV shipments
                                                                                                                                    bounced back, but demand has begun to cool

                                                                                                                                    Sep 15, 2021 - Q2'21 video game content revenue
                                                                                                                                    growth pressured by post-vaccine summer

                                                                                                                                    Sep 14, 2021 - 2021 China survey report: No longer a
                                                                                                                                    developing digital entertainment market

                                                                                                                                    Essential Tech, Media & Telecoms
                                                                                                                                    (TMT) Intelligence

                                                                                                                                    Our global TMT service offers a comprehensive source
                                                                                                                                    to assess impact on your business, identify
                                                                                                                                    opportunities, and manage risk on a platform with
                                                                                                                                    data coverage, news, research, and forward-looking
                                                                                                                                    projections.
                                                                                                                                    About Our Global Tech, Media and Telecoms (TMT)
                                                                                                                                    Solution / Request a Demo
                                                                                                                                    TMT Industry News

To learn more about S&P Global Market Intelligence, please email us at SPGMIMarketingAPAC@spglobal.com   S&P Global Market Intelligence Asia-Pacific Markets Monthly – October 2021 | Page 5
Transaction Activity By Sector, Country

 S&P Global Market Intelligence provides detailed information on M&A and financing transactions covering the most active markets
 in the world. We track all publicly announced mergers, acquisitions, private placements, public offerings, shelf registrations, equity
 buybacks, and bankruptcies. Transaction data is updated daily from various sources such as regulatory filings, company websites,
 newsletters, trade publications, and press releases.

 Our Transaction Data:

 S&P Global Market Intelligence covers 1,300,000+ transactions globally.

 All transaction information, including M&A activity, is seamlessly integrated in the S&P Capital IQ Pro platform and S&P Global
 Market Intelligence Excel Plug-In, and can be viewed alongside company fundamentals.

 To learn more about our transaction coverage, history, and collection process, please contact SPGMIMarketingAPAC@spglobal.com

 In This Report:

 Transaction activities are based on data in selected countries in APAC - Australia, China, Hong Kong, India, Indonesia, Japan,
 Malaysia, New Zealand, Philippines, Singapore, South Korea, Taiwan, Thailand and Vietnam.

To learn more about S&P Global Market Intelligence, please email us at SPGMIMarketingAPAC@spglobal.com   S&P Global Market Intelligence Asia-Pacific Markets Monthly – October 2021 | Page 6
M&A Activity In Asia Pacific: Strategic vs. Financial Buyers
 In September 2021, APAC saw 484 M&A deals, representing a 11% decrease from Aug 2021. Strategic deal count dropped by 12% to
 461 deals and financial deal count increased to 23.

                                     700

                                     600

                                     500
                      No. of Deals

                                     400

                                     300

                                     200

                                     100

                                       0
                                           Apr'21              May'21                 Jun'21                 Jul'21                Aug'21                 Sep'21

                                                                        Financial Deals                     Strategic Deals

 Source: S&P Global Market Intelligence as of October 1, 2021. Figures are based on M&A announcement dates. Includes both closed and pending transactions as well as those without transaction values.
 Charts are provided for illustrative purposes.
To learn more about S&P Global Market Intelligence, please email us at SPGMIMarketingAPAC@spglobal.com                 S&P Global Market Intelligence Asia-Pacific Markets Monthly – October 2021 | Page 7
M&A Activity In Asia Pacific: Selected Sectors
YTD 2021 showed a 290% increase in total number of M&A deals. Among all sectors, Staples, Telecommunication Services, and
Health Care sectors saw the most significant increases with over 330% growth rate. The deal value in YTD 2021 showed a 322%
growth compared to that of YTD 2020. The Telecommunication Services sector surged by 1,425%, followed by Staples (637%) and
Industrials (576%) in YTD 2021.
No. of Deals YTD Activity (21’ vs. 20’) Value of Deals (USDmm) YTD Activity (21’ vs. 20’)
'21 YTD '20 YTD YoY Growth '21 YTD '20 YTD YoY Growth
Sector Sector
YoY Comparison Through YoY Comparison Through
Jan 1, 2021 - Jan 1, 2020 - Jan 1, 2021 - Jan 1, 2020 -
Sep 30, 2021 Sep 30, 2020 Sep 30, 2021 Sep 30, 2021 Sep 30, 2020 Sep 30, 2021
Industrials 1752 439 299% Industrials 129,298 19,123 576%
IT 1208 343 252% Real Estate 97,376 26,808 263%
Discretionary 1089 303 259% Teleco. Services 87,776 5,756 1425%
Materials 841 205 310% IT 70,081 11,308 520%
Real Estate 799 238 236% Materials 66,968 19,261 248%
Teleco. Services 598 133 350% Discretionary 57,949 21,540 169%
Health Care 613 142 332% Financials 47,995 12,125 296%
Staples 522 115 354% Staples 38,128 5,176 637%
Financials 491 121 306% Healthcare 31,668 10,534 201%
Utilities 361 95 280% Energy 29,369 5,234 461%
Energy 150 39 285% Utilities 17,212 12,905 33%
NSD 1234 301 310% NSD 40,608 19,563 108%
Total 9658 2474 290% Total 714,430 169,333 322%
Source: S&P Global Market Intelligence as of October 1, 2021. Figures are based on M&A announcement dates. Includes closed and pending transactions as well as those without transaction values. NSD
– No Sector Disclosed. Tables are provided for illustrative purposes. Transaction value and % change are color coded with highest value in green to lowest in red.
To learn more about S&P Global Market Intelligence, please email us at SPGMIMarketingAPAC@spglobal.com S&P Global Market Intelligence Asia-Pacific Markets Monthly – October 2021 | Page 8M&A Activity In Asia Pacific By Country/Region
In September 2021, China dwarfed the other countries and regions in APAC in the number of M&A deals (243), and Australia led with
the highest deal values (US$ 46bn). In YTD 2021, most of the countries/regions showed slight growth in total number of deals
compared to YTD 2020, and the deal value in APAC contracted by 28% from $767,843 mm to $553,710 mm, largely affected by the
reduction in Thailand, Vietnam and Indonesia.
No. of Deals and Value by Country/Region (Sep’21)
Sector No. of deals Value of Deals
China 243 17,325.2
Australia 130 45,766.3
Japan 118 8,570.6
India 96 1,522.2
South Korea 34 2,182.8
Singapore 30 6,324.4
Vietnam 28 42.1
Hong Kong 26 2,960.1
Malaysia 21 652.7 Key Threshold (No. of Deals)
New Zealand 21 14.2
0 -5
Thailand 16 162.7
Indonesia 5 584.9 >5 - 49
Philippines 5 36.9 >49 - 97
Taiwan 5 351 >97 - 146
No. of Deals and Value YTD Activity (21’ vs. 20’) >146 - 194
>194 - 243
No. of Deals Value of Deals ($USDmm)
21 YTD 20 YTD YoY Growth 21 YTD 20 YTD YoY Growth
YoY Comparison YoY Comparison
Jan 1, 2021 - Jan 1, 2020 - Through Jan 1, 2021 - Jan 1, 2020 - Through
Sep 30, 2021 Sep 30, 2020 Sep 30, 2021 Sep 30, 2021 Sep 30, 2020 Sep 30, 2021
China 2,486 2,277 9% 145,891 20,574 609%
Australia 1,354 1,026 32% 163,648 34,008 381%
Japan 1,004 1,004 0% 49,640 2,297 2,061%
India 841 560 50% 38,542 92,830 -58%
South Korea 522 510 2% 40,427 3,708 990%
Singapore 261 232 13% 29,364 3,450 751%
Vietnam 327 267 22% 2,185 97,549 -98%
Hong Kong 275 260 6% 42,335 2,491 1,599%
Malaysia 267 229 17% 10,665 2,473 331%
New Zealand 186 150 24% 10,230 27,273 -62%
Thailand 181 155 17% 9,026 450,994 -98%
Indonesia 92 88 5% 3,126 23,844 -87%
Philippines 80 55 45% 1,168 4,233 -72% Source: S&P Global Market Intelligence as of October 1, 2021. Figures are based on M&A
Taiwan 86 64 34% 7,462 2,119 252% announcement dates. Includes both closed and pending transactions as well as those without
Total 7,962 6,877 16% 553,710 767,843 -28% transaction values. Charts are provided for illustrative purposes.
To learn more about S&P Global Market Intelligence, please email us at SPGMIMarketingAPAC@spglobal.com S&P Global Market Intelligence Asia-Pacific Markets Monthly – October 2021 | Page 9Initial Public Offerings By Country/Region, Sector
In terms of IPOs, China led the table with 39 IPO deals with a transaction value of over US$ 5bn. Compared to YTD 2020, 34% growth
in deal numbers and 50% growth in deal value were witnessed in YTD 2021. Australia (400%) and Thailand (167%) showed the
greatest increases in deal count, and South Korea (19,391%) and Philippines (12,077%) expanded significantly in IPO deal value.
No. of IPOs and Value by Country/Region (Sep’21)
Country/Region No. of IPOs Value of IPOs ($USDmm)
China 39 5,565.6
Australia 23 691.0
Japan 13 621.4
India 11 547.2
South Korea 11 1,605.5
Indonesia 8 97.0
Thailand 4 156.1
Malaysia 2 11.6
Hong Kong 1 50.0
Philippines 1 432.8 Key Threshold (No. of IPOs)
Singapore 1 348.5
0
Taiwan 1 5.8
New Zealand 0 0.0 >1 - 8
Vietnam 0 0.0 >8 - 16
>16 - 23
No. of IPOs and Value YTD Activity (21’ vs. 20’) >23 - 31
>31 - 39
No. of Deals Value of IPOs ($USDmm)
21 YTD 20 YTD YoY Growth 21 YTD 20 YTD YoY Growth
YoY Comparison YoY Comparison
Jan 1, 2021 - Jan 1, 2020 - Through Jan 1, 2021 - Jan 1, 2020 - Through
Sep 30, 2021 Sep 30, 2020 Sep 30, 2021 Sep 30, 2021 Sep 30, 2020 Sep 30, 2021
China 439 393 12% 79,472 2,681 2,864%
Australia 125 25 400% 4,696 1,220 285%
Japan 78 54 44% 3,535 190 1,756%
India 74 30 147% 10,344 1,203 760%
South Korea 74 56 32% 19,209 99 19,391%
Indonesia 35 46 -24% 2,082 2,792 -25%
Thailand 24 9 167% 3,332 75,741 -96%
Malaysia 21 21 0% 2,346 284 725%
Hong Kong 23 25 -8% 2,963 343 765%
Philippines 4 2 100% 1,953 16 12,077%
Singapore 13 11 18% 1,516 2,852 -47%
Taiwan 2 3 -33% 37 17 120%
New Zealand 1 3 -67% 245 883 -72%
Vietnam 2 6 -67% 1,005 - NA Source: S&P Global Market Intelligence as of October 1, 2021. Figures are based on public
Total 915 684 34% 132,733 88,320 50% offerings offer date. Includes all closed transactions. Tables are provided for illustrative purposes.
To learn more about S&P Global Market Intelligence, please email us at SPGMIMarketingAPAC@spglobal.com S&P Global Market Intelligence Asia-Pacific Markets Monthly – October 2021 | Page 10Private Equity Investments & Buyouts By Country/Region
In September, China ranked the first in deal count (153) and Australia led with the highest deal value (over $ 10bn) In YTD 2021,
the number of transactions raised by 56% while the deal value declined by 79% compared to YTD 2020. Except for Australia
(734%) and China (5%), all other countries/regions showed reduction in deal value by various scales in YTD 2021.
No. of Deals and Value by Country/Region (Sep’21)
Country/Region No. of Deals Value of Deals ($USDmm)
China 153 5,505.0
India 56 2,111.0
Japan 33 1,545.7
Singapore 18 951.0
Australia 16 10,360.1
South Korea 12 375.9
Indonesia 5 84.7
Malaysia 4 225.0
Taiwan 3 293.2
Vietnam 3 55.8 Key Threshold (No. of Deals)
New Zealand 2 10.4
0
Thailand 1 158.0
Hong Kong 0 0.0 >1 - 31
Philippines 0 0.0 >31 - 61
>61 - 92
No. of Deals and Value YTD Activity (21’ vs. 20’) >92 - 122
>122 - 153
No. of Deals Value of Deals ($USDmm)
21 YTD 20 YTD YoY Growth 21 YTD 20 YTD YoY Growth
YoY Comparison YoY Comparison
Jan 1, 2021 - Jan 1, 2020- Through Jan 1, 2021- Jan 1, 2020 - Through
Sep 30, 2021 May 31, 2020 Jan 31, 2021 Sep 30, 2021 May 31, 2020 May 31, 2021
China 1,322 751 76% 78,140 74,155 5%
India 353 189 87% 20,970 89,495 -77%
Japan 276 269 3% 35,928 102,296 -65%
Singapore 106 63 68% 12,984 106,435 -88%
Australia 105 77 36% 59,161 7,094 734%
South Korea 212 175 21% 13,456 116,322 -88%
Indonesia 40 21 90% 1,540 91,565 -98%
Malaysia 12 5 140% 727 102,340 -99%
Taiwan 11 7 57% 413 111,251 -100%
Vietnam 23 15 53% 873 44,633 -98%
New Zealand 17 18 -6% 716 103,865 -99%
Thailand 5 4 25% 172 44,292 -100%
Hong Kong 28 15 87% 24,092 74,674 -68% Source: S&P Global Market Intelligence as of October 1, 2021. Figures are based on M&A
Philippines 11 4 175% 643 102,384 -99% announcement dates. Includes both closed and pending transactions as well as those without
Total 2,521 1,613 56% 249,815 1,170,802 -79% transaction values. Tables are provided for illustrative purposes.
To learn more about S&P Global Market Intelligence, please email us at SPGMIMarketingAPAC@spglobal.com S&P Global Market Intelligence Asia-Pacific Markets Monthly – October 2021 | Page 11Venture Capital Investments: Non Buyouts By Country/Region
In September, China ranked the first in number of VC investments (222) and Australia led with the highest transaction value (US$
9bn). In YTD 2021, both deal count and deal value showed marginal increases compared to YTD 2020 in APAC (56% and 36%,
respectively), where Japan (11,627%), South Korea (6,459%) and Singapore (5,233%) each showed a noticeable growth in the deal
value in YTD 2021.
No. of Deals and Value by Country/Region (Sep’21)
Country/Region No. of Deals Value of Deals ($USDmm)
China 222 5,996.2
India 103 2,956.5
Japan 48 710.6
Singapore 25 1,572.2
Indonesia 15 108.3
Australia 12 8,726.1
South Korea 10 231.1
Vietnam 7 60.5
New Zealand 5 25.4
Key Threshold (No. of Deals)
Malaysia 4 170.5
Taiwan 3 293.2 0
Thailand 2 57.0 >2 - 44
Hong Kong 0 0.0 >44 - 89
Philippines 0 0.0 >89 - 133
No. of Deals and Value YTD Activity (21’ vs. 20’) >133 - 178
>178 - 222
No. of Deals Value of Deals ($USDmm)
21 YTD 20 YTD YoY Growth 21 YTD 20 YTD YoY Growth
YoY Comparison YoY Comparison
Jan 1, 2021 - Jan 1, 2020 - Through Jan 1, 2021- Jan 1, 2020 - Through
Sep 30, 2021 Sep 30, 2020 Sep 30, 2021 Sep 30, 2021 Sep 30, 2020 Sep 30, 2021
China 1,929 1,076 79% 75,881 14,455 425%
India 681 403 69% 17,256 6,613 161%
Japan 503 445 13% 7,438 63 11,627%
Singapore 212 148 43% 13,480 253 5,233%
Indonesia 96 70 37% 1,376 41 3,293%
Australia 130 86 51% 19,563 595 3,187%
South Korea 204 166 23% 8,903 136 6,459%
Vietnam 41 27 52% 521 - NA
New Zealand 27 20 35% 454 5,340 -91%
Malaysia 21 8 163% 791 140 464%
Taiwan 13 16 -19% 422 867 -51%
Thailand 11 11 0% 80 90,062 -100% Source: S&P Global Market Intelligence as of October 1, 2021. Figures are based on transaction
Hong Kong 43 36 19% 23,593 2,398 884% announcement dates. Includes both closed and pending transactions as well as those without
Philippines 15 7 114% 474 4,017 -88% transaction values. Non-buyouts will include all features except for leverage buyouts ( LBO),
Total 3,926 2,519 56% 170,232 124,981 36% management buyout or secondary LBO. Tables are provided for illustrative purposes.
To learn more about S&P Global Market Intelligence, please email us at SPGMIMarketingAPAC@spglobal.com S&P Global Market Intelligence Asia-Pacific Markets Monthly – October 2021 | Page 12Credit Ratings, Research & Commentary S&P Global Ratings is the world’s leading provider of independent credit ratings. Our ratings are essential to driving growth, providing transparency and helping educate market participants so they can make decisions with confidence. We have more than 1 million credit ratings outstanding on government, corporate, financial sector and structured finance entities and securities. We offer an independent view of the market built on a unique combination of broad perspective and local insight. We provide our opinions and research about relative credit risk; market participants gain independent information to help support the growth of transparent, liquid debt markets worldwide. For more information, visit www.spglobal.com/ratings. Our Credit Ratings: Credit Ratings are opinions about credit risk. They can express a forward-looking opinion about the capacity and willingness of an entity to meet its financial commitments as they come due, and also the credit quality of an individual debt issue, such as a corporate or municipal bond, and the relative likelihood that the issue may default. Credit Ratings also foster the development and smooth functioning of capital markets by providing transparent information and insight to market participants. To learn more about how you can benefit from a credit rating from S&P Global Ratings, please contact anthony.foo@spglobal.com To learn more about S&P Global Market Intelligence, please email us at SPGMIMarketingAPAC@spglobal.com S&P Global Market Intelligence Asia-Pacific Markets Monthly – October 2021 | Page 13
Credit Conditions Asia-Pacific Q4 2021:
 COVID Besets, China Reset
 Sep 28, 2021                                                                                                                        More Top Stories:
 Key Takeaways
 • Overall: The resurgence of COVID outbreaks, the likely default of developer Evergrande, and a shift in China                      Sep 29, 2021 - Economic Outlook Q4 2021: Global
                                                                                                                                     Growth Is Steady As Delta Spurs Wide Regional
    socioeconomic policy have introduced uncertainty to the credit outlook of regional issuers.
                                                                                                                                     Swings
 • COVID: Some governments have had to again restrict the mobility of people, for example by deploying more
    lockdowns, this may exacerbate the divergence in the recovery playing out among geographies and industry                         Sep 29, 2021 - Global Credit Conditions Q4 2021:
    sectors.                                                                                                                         Supply Chain Strain, Inflation Pain
 • Economics and supply chain: The economic recovery has slowed. Slower income recovery delays the
    resolution of built-up debt of corporates and households. COVID-induced lockdowns could compound                                 Sep 23, 2021 - Global Reinsurers Grapple With Climate
    supply chain challenges. This could worsen fears of inflation, hastening demand for higher risk premiums.                        Change Risks

 Read the full article >                                                                                                             Credit Update
                                                                                                                                     Special Report: Beyond COVID
                                                                                                                                     Click here to subscribe* to S&P Global Ratings’
                                                                                                                                     coronavirus-related research—including the regularly
                                                                                                                                     updated list of rating actions taken globally on
                                                                                                                                     corporations, sovereigns, and project finance.

                                                                                                                                     Credit Spotlight
                                                                                                                                     China Credit Spotlight: flagship series of China
                                                                                                                                     research designed to bring together views on China’s
                                                                                                                                     economic and credit trends.

                                                                                                                                       * Subscription to the S&P Capital IQ platform is required

To learn more about S&P Global Market Intelligence, please email us at SPGMIMarketingAPAC@spglobal.com   S&P Global Market Intelligence Asia-Pacific Markets Monthly – October 2021 | Page 14
Recent S&P Global Credit Ratings Actions
Company Name Rating Action Rating Date PriorRating Current Rating Geographic Locations
China Evergrande Group (SEHK:3333) Downgrade Sep-15-2021 CCC CC China (Primary)
China Huarong Asset Management Co., Ltd.
Downgrade Sep-09-2021 BBB+ BBB China (Primary)
(SEHK:2799)
China Huarong Financial Leasing Co., Ltd. Downgrade Sep-09-2021 BBB+ BBB- China (Primary)
China Huarong International Holdings Limited Downgrade Sep-09-2021 BBB+ BBB Hong Kong (Primary)
China Resources Power Holdings Company Limited
Upgrade Sep-01-2021 BBB BBB+ Hong Kong (Primary)
(SEHK:836)
eHi Car Services Limited Upgrade Sep-24-2021 B B+ China (Primary)
Fantasia Holdings Group Co., Limited (SEHK:1777) Downgrade Sep-29-2021 B CCC China (Primary)
Hengda Real Estate Group Company Limited Downgrade Sep-15-2021 CCC CC China (Primary)
PT Profesional Telekomunikasi Indonesia Downgrade Sep-28-2021 BBB BBB- Indonesia (Primary)
Ratch Group Public Company Limited (SET:RATCH) Downgrade Sep-23-2021 BBB+ BBB Thailand (Primary)
RiseSun Real Estate Development Co.,Ltd
Downgrade Sep-01-2021 BB- B+ China (Primary)
(SZSE:002146)
Ronshine China Holdings Limited (SEHK:3301) Downgrade Sep-14-2021 B+ B China (Primary)
Sinic Holdings (Group) Company Limited (SEHK:2103) Downgrade Sep-20-2021 B CCC+ China (Primary)
State Grid International Development Limited Upgrade Sep-30-2021 A A+ China (Primary)
Tianji Holding Ltd. Downgrade Sep-15-2021 CCC CC China (Primary)
Tingyi (Cayman Islands) Holding Corp. (SEHK:322) Upgrade Sep-06-2021 BBB+ A- China (Primary)
Source: S&P Global Ratings, as of October 1, 2021. Credit ratings are prepared by S&P Global Ratings, which is analytically and editorially independent from any other analytical group at S&P Global. Tables are
for illustrative purposes only. S&P Global Ratings Australia Pty Ltd holds Australian financial services license number 337565 under the Corporations Act 2001. Credit Ratings issued by S&P Global Ratings
(Australia) and related research are not intended for and must not be distributed to any person in Australia other than a wholesale client (as defined in Chapter 7 of the Corporations Act).
To learn more about S&P Global Market Intelligence, please email us at SPGMIMarketingAPAC@spglobal.com S&P Global Market Intelligence Asia-Pacific Markets Monthly – October 2021 | Page 15Research, Education, and Market Commentary S&P Dow Jones Indices is the largest global resource for essential index-based concepts, data and research, which provides essential intelligence for individuals, companies, and governments to make decisions with confidence. Whether you’re looking to track a market’s performance, evaluate your portfolio, or invest in index-linked investment products, indices are indispensable financial tools. We carry out extensive interactions with clients to create cutting-edge quantitative solutions, with an award-winning research team that specifically covers multiple asset classes. Our indexology blog (www.indexologyblog.com) features posts, reports, performance, and discussions from knowledgeable industry contributors to provide insightful research and newest innovations, market, political and economic events through the lens of our index data. Our Indices: As the world's largest resource for index-based innovation, data and research our mission is to bring independent, transparent and cost effective solutions to the global investment community. S&P Dow Jones Indices is at the forefront of index change and innovation. Our goal is to continue to anticipate and respond to how our clients see global investment opportunities. Home to iconic financial market indicators, such as the S&P 500 ® and the Dow Jones Industrial Average®. More assets are invested in products based on our indices than based on any other provider in the world. With over 1,000,000 indices and more than 120 years of experience constructing innovative and transparent solutions, S&P Dow Jones Indices defines the way investors measure and trade the markets. For more information, visit www.spdji.com or contact index_services@spglobal.com. In this Report: Monthly market performance that highlight developments in the Asia Pacific equity, commodities, fixed income, and niche-themed markets. To learn more about S&P Global Market Intelligence, please email us at SPGMIMarketingAPAC@spglobal.com S&P Global Market Intelligence Asia-Pacific Markets Monthly – October 2021 | Page 16
Market Attributes: Index Dashboard
 Summary
 •   The broad-based S&P Pan Asia BMI shed 1% in September, leaving it with a loss of
     3% for the quarter. The large-cap S&P Asia 50 led the way down, dropping 6% and                                                                S&P Pan Asia BMI Country Contribution
     14% this month and quarter, respectively.                                                                                    Japan                           Q3 2021               1.5%
 •       Japan was the top-performing country in September, with the S&P/TOPIX 150 up 5%                                           India                                                               0.9%
         for the month. Hong Kong and Korea lagged, as an ongoing regulatory crackdown in                                    Singapore                                                          0.1%
         China and Evergrande’s widely-publicized troubles soured investor sentiment.
                                                                                                                              Indonesia                                                         0.1%
 •       All but one of our Pan Asia equity factor indices posted losses this month; Enhanced                                  Malaysia                                                         0.0%
         Value was the odd one out, bucking the trend with a 1% gain. Quality led for the
         quarter, up 1%.                                                                                                  New Zealand                                                           0.0%
                                                                                                                                                     S&P Pan Asia BMI (-
                                                                                                                               Pakistan                                  0.0%
 •       Leading among all S&P Pan Asia BMI sectors, Energy was on a different track to the                                                          3.0%)
         rest of the market, soaring to a 10% quarterly gain on the back of rising oil and                                   Philippines                                            0.0%
         natural gas prices. Utilities and Financials also made gains this quarter, although
                                                                                                                               Thailand                                             0.0%
         most sectors declined.
                                                                                                                               Australia                                           -0.1%
 •       Commodities posted highly mixed performances, with Crude Oil and Aluminum
                                                                                                                                 Taiwan                                           -0.2%
         making strong gains while Silver in particular lost its shine, down 8% in September.
 •                                                                                                                          Hong Kong                                          -0.5%
 •       Our regional fixed income indices generally finished losses this month, although it
         was more of a mixed bag on the quarter. Our sovereign bond indices for China and
                                                                                                                           South Korea                                    -1.1%
         India performed the most admirably.                                                                                      China           -3.8%

 •       Volatility increased across asset classes, with the HSI Volatility Index closing                                                   -5%      -4%      -3%       -2%       -1%      0%      1%         2%
         September up at 25.

 Source: S&P Dow Jones Indices LLC and/or its affiliates. Data as of September 30, 2021. Index performance based on total return. Numbers in brackets are closing price levels for the corresponding indices.
 Returns for single country indices and single country strategies are in local currency, otherwise USD. Sector contributions to the S&P Pan Asia BMI are calculated over the prior month. Charts and graphs are
 provided for illustrative purposes. Past performance is no guarantee of future results. For more information, please visit our website at www.spdji.com
To learn more about S&P Global Market Intelligence, please email us at SPGMIMarketingAPAC@spglobal.com                   S&P Global Market Intelligence Asia-Pacific Markets Monthly – October 2021 | Page 17
Market Attributes: Index Dashboard
Index Investment Strategy
Index 1M QTR YTD Index 1M QTR YTD Index 1M QTR YTD
Pan Asia Equity Single-Country Equity Single-Country Fixed Income Yield
S&P Southeast Asia 40 -1.53% 2.08% -5.64% S&P BSE SENSEX 2.78% 12.91% 24.87% S&P BSE India Government
5.89% 1.09% 2.16% 2.93%
S&P Asia-Pacific BMI -0.37% -0.05% 4.85% S&P/TOPIX 150 4.74% 5.45% 15.21% Bond
S&P Pan Asia SmallCap -1.36% -0.70% 10.35% S&P/NZX 50 Portfolio 0.54% 5.03% 3.91% S&P China Government Bond 2.86% 0.10% 1.80% 3.99%
S&P Pan Asia MidCap -1.47% -1.55% 7.90% S&P Singapore BMI -1.25% 5.00% 22.43% S&P/ASX Australian
S&P Pan Asia BMI -1.41% -3.03% 2.80% 1.11% -2.15% 0.26% -1.97%
S&P/ASX 200 -1.85% 1.71% 14.83% Government Bond
S&P Emerging Asia-Pacific BMI -2.96% -7.22% -0.15% S&P Taiwan Government
S&P Taiwan BMI -2.98% -1.96% 17.37% 0.42% -0.21% 0.04% -0.93%
S&P Asia 50 -5.93% -13.91% -8.61% Bond
S&P Korea BMI -3.88% -7.08% 4.02%
S&P Pan Asia BMI Smart Beta S&P Japan Government Bond 0.12% -0.36% 0.03% -0.07%
S&P China 500 -2.08% -10.51% -8.37%
S&P Pan Asia Quality LargeMidCap -1.93% 1.36% 3.98% S&P Hong Kong Government
S&P Hong Kong BMI -6.34% -11.22% -1.45% 0.08% -0.06% 0.02% -0.01%
S&P Pan Asia Low Volatility -0.72% 0.88% 5.27% Bond
Single-Country Strategy
S&P Pan Asia Enhanced Value S&P Singapore Government
0.78% 0.05% 14.62% JPX/S&P CAPEX & Human 0.82% -0.53% -0.07% -2.05%
LargeMidCap 4.04% 5.97% 13.34% Bond
Capital
S&P Pan Asia GIVI -0.27% -1.35% 6.43% S&P Korea Government Bond 1.79% -1.88% -0.08% -2.04%
S&P GIVI Japan 4.59% 5.54% 18.38%
S&P Pan Asia Value -0.25% -1.44% 8.55% S&P/NZX NZ Government
S&P/JPX Dividend Arisocrats 4.31% 2.96% 16.32% 1.73% -1.10% -1.23% -4.41%
S&P Pan Asia Intrinsic Value Bond
-0.33% -1.48% 7.60%
Weighted S&P Korea Dividend Contribut
S&P Pan Asia Low Beta -1.52% -2.78% 1.75% 2.31% 2.54% 26.95% S&P Pan Asia BMI Sectors ion~
Opportunities
S&P Pan Asia Dividend S&P Korea Low Volatility -0.23% -2.99% 23.05% Energy 0.20% 9.74% 10.12% 20.96%
-1.92% -4.10% 3.20%
Aristocrats® Utilities 0.13% 1.78% 6.61% 12.59%
S&P New China Sectors (USD) -1.27% -18.95% -19.50%
S&P Pan Asia Growth -2.45% -4.46% -2.14% Industrials 0.25% -0.38% 2.04% 10.53%
S&P Pan Asia Momentum Volatility Financials 0.26% 0.44% 1.70% 10.91%
-3.30% -7.18% -3.01%
LargeMidCap HSI Volatility Index (24.67) 11.48% 53.52% 27.96% Materials -0.04% -3.77% -0.57% 10.66%
S&P Pan Asia Ethical Select S&P/JPX JGB VIX (1.65) 13.79% 35.25% 36.36% Information Technology -0.21% -3.03% -1.22% 6.26%
-5.32% -9.36% -3.76%
Dividend Opportunities S&P/ASX 200 VIX (11.91) 16.31% 1.78% -10.37% Consumer Staples -0.13% -0.47% -2.30% -4.42%
Commodities CBOE Volatility Index / VIX® Real Estate -0.20% -1.63% -4.18% 2.35%
40.41% 46.18% 1.71%
Dow Jones Commodity Index (DJCI) 2.94% 3.08% 27.09% (23.14) Health Care -0.41% -1.58% -5.36% -5.18%
S&P GSCI 6.03% 5.22% 38.27% S&P 500® VIX Short-Term Consumer Discretionary -1.82% -2.31% -10.93% -7.57%
9.07% -5.57% -58.43%
S&P GSCI Aluminum 5.03% 12.73% 41.37% Futures Communication Services -1.03% -2.78% -11.54% -7.05%
S&P GSCI Crude Oil 9.92% 3.69% 57.76% S&P 500® VIX Medium-Term
5.72% 5.97% -11.41%
S&P GSCI Gold -3.36% -1.03% -7.92% Futures
S&P GSCI Copper -6.19% -4.86% 14.89%
S&P GSCI Silver -8.16% -16.00% -17.00%
S&P Dow Jones Indices LLC. Data as of September 30, 2021 except * as of September 29, 2021. Index performance based on total return. Returns for single country indices and single country strategies are in local currency,
otherwise USD. Charts and graphs are provided for illustrative purposes. Past performance is not an indication or guarantee of future results. These charts and graphs may reflect hypothetical historical performance. Please see
the Performance Disclosure (https://us.spindices.com/regulatory-affairs-disclaimers/) for more information regarding the inherent limitations associated with back-tested performance.
To learn more about S&P Global Market Intelligence, please email us at SPGMIMarketingAPAC@spglobal.com S&P Global Market Intelligence Asia-Pacific Markets Monthly – October 2021 | Page 18Market Observations – Make Your Own If you are interested in building your own report similar to this issue of Market Observations or any prior report, please contact us. Our team can assist you with helping to build a screen, linkage from Excel to PowerPoint, and customized templates and models for your future use. For illustrative purposes only. To learn more about S&P Global Market Intelligence, please email us at SPGMIMarketingAPAC@spglobal.com S&P Global Market Intelligence Asia-Pacific Markets Monthly – October 2021 | Page 19
Contact Us
 About S&P Global Market Intelligence Asia-Pacific Markets Monthly
 Asia-Pacific Markets Monthly is a complimentary report that provides timely insights and data on the CDS, Indexes, M&A, IPO, Private
 Equity and Venture Capital Investment markets.
 At S&P Global Market Intelligence, we integrate financial and industry data, research and news into tools that is designed to help track
 performance, generate alpha, identify investment ideas, understand competitive and industry dynamics, perform valuation and assess
 credit risk. Investment professionals, government agencies, corporations and universities globally can gain the intelligence essential to
 making business and financial decisions with conviction.
 S&P Global Market Intelligence is a division of S&P Global (NYSE: SPGI). For more information, visit
 www.spglobal.com/marketintelligence.

 How to Subscribe to Asia-Pacific Markets Monthly
 Asia-Pacific Markets Monthly is published for Media, S&P Global Market Intelligence clients and select finance professionals. To receive
 a copy, please register online here.

 Submit Feedback/Media Enquiries
 Please contact us at SPGMIMarketingAPAC@spglobal.com

To learn more about S&P Global Market Intelligence, please email us at SPGMIMarketingAPAC@spglobal.com   S&P Global Market Intelligence Asia-Pacific Markets Monthly – October 2021 | Page 20
Disclosures
 Copyright © 2021 by S&P Global Market Intelligence, a division of S&P Global Inc. All rights reserved.

 These materials have been prepared solely for information purposes based upon information generally available to the public and from sources believed to be
 reliable. No content (including index data, ratings, credit-related analyses and data, research, model, software or other application or output therefrom) or any part
 thereof (Content) may be modified, reverse engineered, reproduced or distributed in any form by any means, or stored in a database or retrieval system, without the
 prior written permission of S&P Global Market Intelligence or its affiliates (collectively, S&P Global). The Content shall not be used for any unlawful or unauthorized
 purposes. S&P Global and any third-party providers, (collectively S&P Global Parties) do not guarantee the accuracy, completeness, timeliness or availability of the
 Content. S&P Global Parties are not responsible for any errors or omissions, regardless of the cause, for the results obtained from the use of the Content. THE
 CONTENT IS PROVIDED ON “AS IS” BASIS. S&P GLOBAL PARTIES DISCLAIM ANY AND ALL EXPRESS OR IMPLIED WARRANTIES, INCLUDING, BUT NOT LIMITED TO,
 ANY WARRANTIES OF MERCHANTABILITY OR FITNESS FOR A PARTICULAR PURPOSE OR USE, FREEDOM FROM BUGS, SOFTWARE ERRORS OR DEFECTS, THAT THE
 CONTENT’S FUNCTIONING WILL BE UNINTERRUPTED OR THAT THE CONTENT WILL OPERATE WITH ANY SOFTWARE OR HARDWARE CONFIGURATION. In no event
 shall S&P Global Parties be liable to any party for any direct, indirect, incidental, exemplary, compensatory, punitive, special or consequential damages, costs,
 expenses, legal fees, or losses (including, without limitation, lost income or lost profits and opportunity costs or losses caused by negligence) in connection with
 any use of the Content even if advised of the possibility of such damages.

 S&P Global Market Intelligence’s opinions, quotes and credit-related and other analyses are statements of opinion as of the date they are expressed and not
 statements of fact or recommendations to purchase, hold, or sell any securities or to make any investment decisions, and do not address the suitability of any
 security. S&P Global Market Intelligence may provide index data. Direct investment in an index is not possible. Exposure to an asset class represented by an index
 is available through investable instruments based on that index. S&P Global Market Intelligence assumes no obligation to update the Content following publication
 in any form or format. The Content should not be relied on and is not a substitute for the skill, judgment and experience of the user, its management, employees,
 advisors and/or clients when making investment and other business decisions. S&P Global keeps certain activities of its divisions separate from each other in
 order to preserve the independence and objectivity of their respective activities. As a result, certain divisions of S&P Global may have information that is not
 available to other S&P Global divisions. S&P Global has established policies and procedures to maintain the confidentiality of certain non-public information
 received in connection with each analytical process.

 S&P Global may receive compensation for its ratings and certain analyses, normally from issuers or underwriters of securities or from obligors. S&P Global
 reserves the right to disseminate its opinions and analyses. S&P Global's public ratings and analyses are made available on its Web sites,
 www.standardandpoors.com (free of charge) and www.ratingsdirect.com (subscription), and may be distributed through other means, including via S&P Global
 publications and third-party redistributors. Additional information about our ratings fees is available at www.standardandpoors.com/usratingsfees.

To learn more about S&P Global Market Intelligence, please email us at SPGMIMarketingAPAC@spglobal.com   S&P Global Market Intelligence Asia-Pacific Markets Monthly – October 2021 | Page 21
You can also read