Anatomy of a Strombolian eruption: Inferences from particle data recorded with thermal video
←
→
Page content transcription
If your browser does not render page correctly, please read the page content below
Anatomy of a Strombolian eruption: Inferences from
          particle data recorded with thermal video
     Maxime Bombrun, Andrew Harris, Lucia Gurioli, Jean Battaglia, Vincent
                                                 Barra

     To cite this version:
    Maxime Bombrun, Andrew Harris, Lucia Gurioli, Jean Battaglia, Vincent Barra. Anatomy of
    a Strombolian eruption: Inferences from particle data recorded with thermal video. Journal of
    Geophysical Research : Solid Earth, American Geophysical Union, 2015, 120 (4), pp.2367 - 2387.
    �10.1002/2014JB011556�. �hal-01621811�

                                 HAL Id: hal-01621811
                          https://hal.uca.fr/hal-01621811
                                    Submitted on 12 Nov 2021

    HAL is a multi-disciplinary open access            L’archive ouverte pluridisciplinaire HAL, est
archive for the deposit and dissemination of sci- destinée au dépôt et à la diffusion de documents
entific research documents, whether they are pub- scientifiques de niveau recherche, publiés ou non,
lished or not. The documents may come from émanant des établissements d’enseignement et de
teaching and research institutions in France or recherche français ou étrangers, des laboratoires
abroad, or from public or private research centers. publics ou privés.
                                              Copyright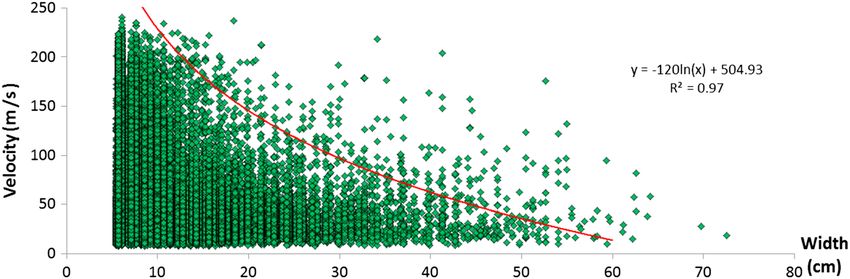
PUBLICATIONS
Journal of Geophysical Research: Solid Earth
RESEARCH ARTICLE                             Anatomy of a Strombolian eruption: Inferences
10.1002/2014JB011556
                                             from particle data recorded with thermal video
Key Points:                                  Maxime Bombrun1,2,3,4, Andrew Harris1,2, Lucia Gurioli1,2, Jean Battaglia1,2, and Vincent Barra3,4
• Strombolian ballistics are geophysically
  defined                                     1
                                                 Clermont-Université, Université Blaise Pascal, LMV, Clermont-Ferrand, France, 2CNRS, UMR 6524, LMV, Aubiere, France,
• A database of 83,000 particles is          3
  provided                                       Clermont-Université, Université Blaise Pascal, LIMOS, Clermont-Ferrand, France, 4CNRS, UMR 6158, LIMOS, Aubiere, France
• These parameters allow a better
  understanding of plume dynamics
                                             Abstract Over the past decade, a proliferation of new technologies has pushed forward our ability to measure
                                             the dynamics of volcanic emissions as they exit, and ascend above, the vent. Measuring parameters of all particles
                                             as they exit the vent during an explosive eruption is the best way to gather parameters such as size, shape,
Correspondence to:
M. Bombrun,                                  velocity, and mass for the solid (particulate) fraction of the plume, in our case this being the lapilli and bomb
bombrun@isima.fr                             component. We compute particle velocities and size distributions using high spatial resolution (centimeter-sized
                                             pixel) thermal infrared imagery collected at 200 Hz for small explosive eruptions at Stromboli (Italy). Our study
Citation:                                    covers 13 eruptions from Stromboli’s southwest crater that occured in October 2012, plus 13 eruptions from
Bombrun, M., A. Harris, L. Gurioli,          the southwest crater, and 5 eruptions from the northeast crater in May 2014. We obtain a statistically robust
J. Battaglia, and V. Barra (2015),           database for size, mass, and velocity of 83,000 particles. Most particles have sizes of 5 to 15 cm so that the
Anatomy of a Strombolian eruption:
Inferences from particle data recorded       majority of individual particle masses are below 0.4 kg. However, 4950 (6%) of the particles are heavier than 5 kg
with thermal video, J. Geophys. Res. Solid   and represent 59% of the total mass erupted. We also show that the smallest particles detected have the highest
Earth, 120, 2367–2387, doi:10.1002/          velocities with the maximum recorded vent-leaving velocity being 240 m/s. While the thermal data provide
2014JB011556.
                                             insights into particle emission and launch dynamics, correlation with seismic data sheds light on the source
Received 22 AUG 2014                         mechanism. Our results lead us to suggest that pyroclast-dominated explosions are a consequence of the
Accepted 2 MAR 2015                          presence of a viscous, degassed cap at the head of the magma column, whereas gas-dominated events are a
Accepted article online 6 MAR 2015           consequence of slug bursting in a “cleaner” conduit, the cap having been lost by convective overturn.
Published online 28 APR 2015
Corrected 25 MAY 2015

This article was corrected on 25 MAY
2015. See the end of the full text for
                                             1. Introduction
details.
                                             Emission of bombs, blocks, lapilli, and minor coarse ash is common during normal explosive activity at
                                             Stromboli volcano (Aeolian Islands, Italy). In addition, eruptions occur (on average) 13 times an hour and
                                             are sufficiently small that measurements can be made, and methodologies tested, close to the source in
                                             reasonable safety [Harris and Ripepe, 2007; Ripepe et al., 2008]. Stromboli has thus become famous as being
                                             an outstanding natural laboratory for studying the source and dynamics of explosive emissions. Because
                                             measurement of particle exit parameters is an important objective in the study of explosive emissions,
                                             studies aimed at designing methodologies to extract parameters, and to create particle size, mass, and
                                             velocity databases, have tended to target Stromboli [Chouet et al., 1974; Ripepe et al., 1993; Patrick et al., 2007;
                                             Delle Donne and Ripepe, 2012; Harris et al., 2012, 2013; Taddeucci et al., 2012a]. Recently, technological advances,
                                             including the development of field-portable high-speed visible and thermal cameras, have allowed new
                                             insights into particle emission dynamics and how those dynamics relate to associated source processes
                                             [Patrick et al., 2007; Taddeucci et al., 2012a; Harris et al., 2012; Gurioli et al., 2013, 2014; Genco et al., 2014].
                                             However, despite the frequency of activity and number of particles involved in each emission at Stromboli,
                                             large, statistically robust databases for vent-leaving particle dynamics remain scarce.
                                             Particle size distribution has long been known to be a particularly useful parameter to measure if we are to
                                             understand the fragmentation process and particle emission dynamics [e.g., Walker, 1971, 1973; Wohletz
                                             et al., 1989]. These data can be obtained from the deposit or from visible and infrared imagery of an active
                                             eruption [e.g., Chouet et al., 1974; Ripepe et al., 1993; Harris et al., 2012]. Likewise, individual particle and total
                                             deposit mass has increasingly been obtained from thermal camera imagery [Patrick et al., 2007; Taddeucci
                                             et al., 2012b; Harris et al., 2013; Delle Donne and Ripepe, 2012]. Mass and mass flux are again fundamental
                                             parameters for understanding the dynamic evolution of an explosive event, as well as for event classification
                                             and characterization in terms of magnitude and intensity [Newhall and Self, 1982]. Emission, or launch, velocity
                                             is a key parameter for constraining particle trajectories and fall out range [e.g., Lorenz, 1970; Self et al., 1980;
                                             Kilgour et al., 2010]. Initially, particle velocities were obtained using photoballistic analysis of visible imagery

BOMBRUN ET AL.                                                   ©2015. American Geophysical Union. All Rights Reserved.                                          2367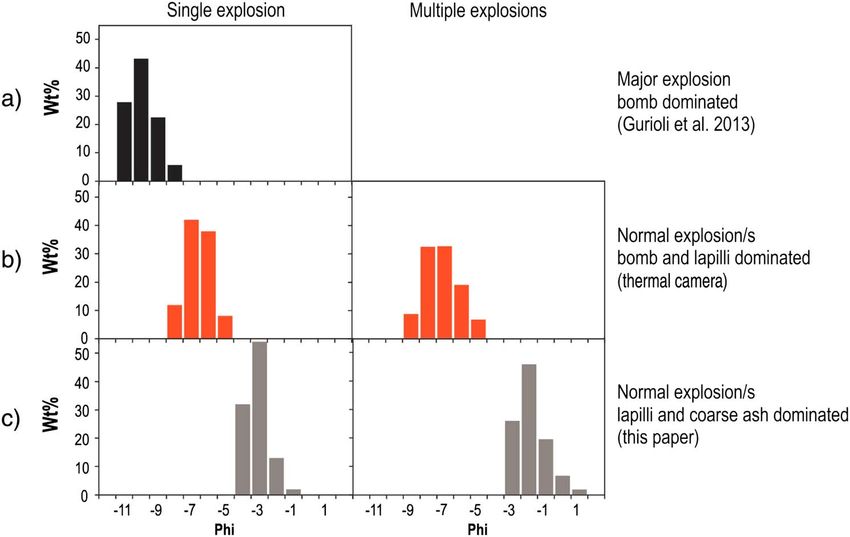
Journal of Geophysical Research: Solid Earth                                               10.1002/2014JB011556

                      [Chouet et al., 1974; Blackburn et al., 1976; Ripepe et al., 1993], but thermal camera imagery is becoming
                      increasingly used [Patrick et al., 2007; Harris et al., 2012; Delle Donne and Ripepe, 2012] along with videos from
                      high-speed visible cameras [Taddeucci et al., 2012a; Gaudin et al., 2014a, 2014b; Genco et al., 2014].
                      The use of portable (handheld) forward looking infrared (FLIR) cameras has become widespread in volcanology
                      since their first use by McGimsey et al. [1999] to image warm deposits at Pavlof and Shishaldin volcanoes
                      between 1997 and 1999 [Harris, 2013]. Thermal infrared imagery collected at wavelengths of 7–14 μm is able to
                      achieve a number of tasks difficult or impossible to accomplish using other tools. The main advantage offered
                      by the infrared camera is that the hot particles are easily spotted due to their high contrast when set against
                      a cool background. In addition, small (subpixel) hot particles, invisible to the naked eye, become apparent due
                      to their lighting up of a whole pixel [Harris et al., 2012].
                      Here we use thermal video data to fully parameterize the emission dynamics of bombs, blocks, and lapilli as
                      they leave the vent. Following emission, these will typically follow ballistic trajectories [e.g., Vanderkluysen
                      et al., 2012], unlike the plume of gas and fine particles whose ascent will be buoyancy driven [e.g., Turner,
                      1962]. For the lapilli through bomb size range, we present a large database of particle sizes, velocities, masses,
                      shapes, kinetic energies, and number. Because of our frame rate (200 Hz), this allows generation of frequency
                      distributions with thousands of points for each eruption, even if the emission lasts just a few seconds. We use
                      these results to further develop the source mechanism and emission model for ballistic-dominated explosive
                      events at Stromboli proposed by Gurioli et al. [2014].

                      2. Methodology
                      The thermal camera used in this study was a forward looking infrared (FLIR) manufactured by FLIR Systems,
                      it being the SC655 which acquires a 640 × 480 pixel image at wavelengths of 7–14 μm. The camera was
                      equipped with a 3.6X magnification lens and recorded at 200 frames per second. To allow data transfer at
                      these frame rates, the image height must be reduced to 120 pixels. The lens focal length (f) was 88.9 mm and
                      the pixel spatial resolution (or instantaneous field of view, IFOV) was 0.19 mrad. For this study, images were
                      acquired from a location that was higher than the target so that the line of sight was oblique. The average
                      distance between the camera and the eruption plane was around 280 m. Following Holst [2000], at this
                      distance (d), we should be able to detect particles with diameter (D) down to
                                                                             D ¼ dIFOV
                                                                                ¼ 2801:9104                                           (1)
                                                                                 ¼ 5:3 cm

                      To extract quantitative information for each particle, we need to convert the pixel dimensions (Xpix, where X is
                      the pixel width or height) into millimeters (Xmm). This is calculated by
                                                                             X mm ¼ YX pix                                               (2)

                      in which Y is a scaling factor given by
                                                                                      Rd
                                                                         Y¼                                                              (3)
                                                                                f sinð90  ϕ Þ
                      in which R is the spatial resolution of the camera described as a ratio of the pixel IFOV to the image field of
                      view and ϕ is the tilt angle of the camera during the acquisition.
                      Unless we apply a pixel mixture model to understand the size of a hot subpixel particle [e.g., Harris et al., 2012],
                      the limit of our measurement will be 1 pixel, i.e., 5.3 cm at our distance. Particles smaller than the pixel size will
                      be missed or, if they are large enough and hot enough to light up the pixel, lumped into the 5.3 cm size bin.
                      Thus, we just consider the lapilli and bomb component of the emission, i.e., all particles with a diameter
                      greater than 5.3 cm. However, following Gurioli et al. [2013], for such eruption types, this size range accounts
                      for more than 50% of the solid fraction of the emission by mass. The 2-D image allows us to estimate
                      dimension only in the image plane, so we have to assume symmetry to obtain 3-D information. Some ejecta
                      will be moving toward or away from the camera, thus changing their apparent size in terms of pixel
                      dimension as they move. These issues can be solved with stereoscopic imaging, but our method is specifically
                      designed for cases where stereoscopic measurements are either impractical or unavailable. We note, though,

BOMBRUN ET AL.                         ©2015. American Geophysical Union. All Rights Reserved.                                        2368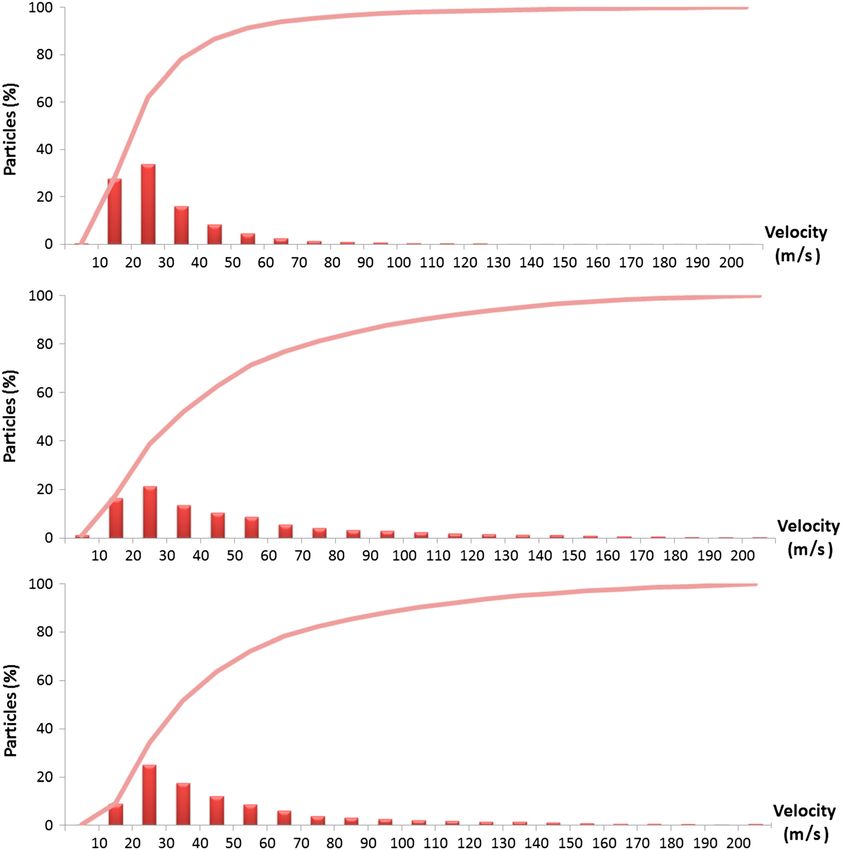
Journal of Geophysical Research: Solid Earth                                                10.1002/2014JB011556

                      that given the high frame rate and magnification of our video, such effects will be absolutely minimal. In effect,
                      the magnification lens allows us to focus on a window just above the vent so that the particles will still be
                      close to their emission point; i.e., they will be moving more or less vertically out of the vent. Besides, there is
                      typically very little difference in their position between two frames due to the high frame rate (1/200th of a
                      second); so there is little effect due to movement toward or away from the focal plane.
                      2.1. Target
                      Stromboli volcano (Aeolian Islands, Italy) was selected as a target, it being a reliable emitter of particles
                      where weakly explosive activity has persisted at least since 500 A.D. [Rosi et al., 2000]. We completed two
                      measurement campaigns, one in 2012 and a second in 2014. In 2012, we completed 8 h of recording spread
                      over 4 days spanning 27 September to 5 October 2012, during which time we recorded 13 eruptions. In 2014,
                      we recorded for 8 h on 17 and 18 May, capturing a further 18 events.
                      We set up the thermal camera at Pizzo Sopra la Fossa (PSF: 918 m above sea level) which overlooks Stromboli’s
                      active crater terrace. The terrace itself is aligned NE-SW with dimensions of 200 by 230 m and contains all of
                      the active vents. In historical times, the crater terrace has hosted three main craters [Washington, 1917], which
                      today are named southwest (SWC), central (CC), and northeast (NEC). During 2012, SWC hosted two active
                      vents, two puffing vents were active atop a small cone in CC, and NEC also contained two active vents. In 2014,
                      SWC contained three active vents, plus four degassing vents. CC comprised a large central cone, whose summit
                      vent produced near continuous spattering and explosions, and NEC comprised two pits each containing an
                      active vent. We set up on the SW end of PSF (universal transverse Mercator (UTM) coordinates: WGS84 0518574
                      4293754) from where we viewed the most active vent in SWC over a line of sight distance of 280 m. We also
                      set up on the NE end of PSF (UTM coordinates: WGS84 0518580 4293785) from where we were also able to
                      record data for an active vent in NEC over a distance of 250 m. All 13 eruptions recorded during 2012 were from
                      SWC, with 13 eruptions being recorded from SWC in 2014 and five from NEC. Each event is referenced using
                      four digits for the month and day (MM-DD) then nine digits for the time (in hour, minutes, seconds, and
                      nanoseconds) from the beginning of the video clip from which the data sequence is extracted (HHMMSSNNN).
                      During the 2012 campaign, a Guralp CMG-40 T 30 s broadband seismometer was also installed near the thermal
                      camera acquisition point.
                      In this study, we are not interested in trajectories. Instead, our aim is to capture the vent-leaving properties of all
                      measurable particles, primarily size, velocity, shape, and mass. This measurement location places us as close
                      to the point of fragmentation as possible. Such parameters collected later along the flight path, or once the
                      particle is on the ground, will be very different and heavily modified as compared with those that were actually
                      present as the particles exited the vent. For example, a molten fragment may deform and break-up in-flight
                      as well as upon ground impact. This will change the field collected shape and size parameters. Thus, by
                      computing particle parameters as soon as they exit the vent, our results are valid for the vent-leaving conditions.
                      Consequently, we focus on single frame analysis using the closest usable frame to the vent.

                      2.2. Parameter Extraction
                      Given (i) the large number of particles (tens of thousands), (ii) high particle velocities (hundreds of meters per
                      second), and (iii) the quantity of data (two hundred 640 × 120 pixel images per second = 150 kb/s in size
                      or 1.8 Gb/min), we need a simple and efficient algorithm to allow parameter extraction. Here we used an
                      algorithm based on a mathematical morphology transformation hybridized by thresholding [Bombrun et al.,
                      2014]. This algorithm allowed us to identify and count most of the particles as they exited the vent in cases
                      where plumes of finer particles did not obscure the bombs and lapilli we track.
                      To characterize particle dimension, we considered the radius of the short-axis (rS) and the radius of the long-axis
                      (rL). Using these measurements, we defined the characteristic radius (r) using the two axes, so that r = (rS + rL)/2.
                      To convert to particle volume, we applied a spheroidal assumption that used the short- and long-axis radii
                      to estimate the volume of particle i (Vi). Particles that are fluid and, at the vent, moving at high velocity in a
                      quasi-vertical direction tend to take on an elongate shape stretched in the direction of flight [Macdonald, 1972].
                      This can be best described by a prolate spheroid, so that

                                                                                     4 2
                                                                             Vi ¼     πr r L                                              (4)
                                                                                     3 S

BOMBRUN ET AL.                         ©2015. American Geophysical Union. All Rights Reserved.                                         2369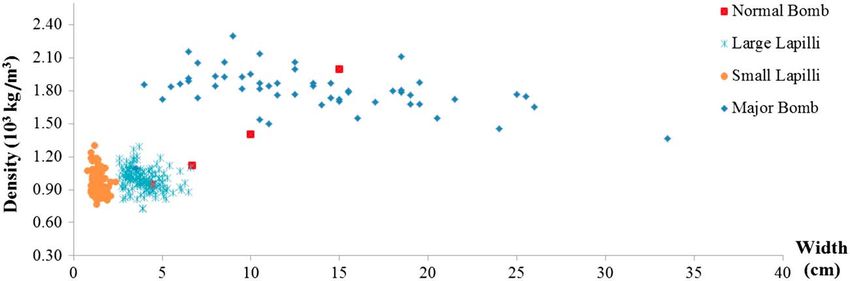
Journal of Geophysical Research: Solid Earth                                              10.1002/2014JB011556

                      Figure 1. Density of lapilli and bombs measured from samples of Stromboli’s scoria collected between 2008 and 2011.

                      Now given an appropriate density (ρi), particle volume can be converted to mass (mi):
                                                                               mi ¼ ρi V i                                              (5)

                      To define an appropriate density, we plotted density versus b axis length for lapilli and bombs collected
                      at Stromboli between 2008 and 2011 (Figure 1). This plot combined measurements from samples of fine
                      (1–2 cm) and large (4–5 cm) lapilli collected during June 2008 from two bomb-dominated normal explosions
                      [Colò, 2012] plus 53 bombs taken from a bomb field from a major explosion of January 2010 by Gurioli et al.
                      [2013]. We also plotted the density of two bombs collected in 2008 [Gurioli et al., 2014], from a bomb-dominated
                      normal explosion whose particle trajectories were defined by Vanderkluysen et al. [2012] plus two bombs
                      collected from a gas-dominated explosion in 2011 [Leduc et al., 2015]. For the density conversion, we split the
                      distribution into two fields: lapilli and bombs. For bombs (6.5 cm to 35 cm), we see no trend with increasing size,
                      but the cluster is fairly tight with a mean and standard deviation of 1 800 ± 200 kg/m3. Likewise, the lapilli
                      (0.2 cm to 6.5 cm) form a cluster with a mean and standard deviation of 980 ± 110 kg/m3. We use these two
                      values for our size-dependent conversion to mass. Thus, the mass of all particles detected is calculated with an
                      error ±11% due to the uncertainty in density.
                      The tracking step of the algorithm computed the velocity of particles following first detection [Bombrun et al.,
                      2014]. In raw form, this is expressed in terms of the number of pixels travelled by the particle between two
                      consecutive frames separated by time t. This will be in units of pixels per frame. Thus, the pixel velocity (U) of
                      the particle i at time t is

                                                                          ωi;tþ1  ωi;t
                                                                   Ui;t ¼                                                            (6)
                                                                            ðt þ 1Þ  t
                      where ωi,t is the position of the particle i at time t. We now complete the transition to velocity in m/s using
                                                                    U½m=s ¼ νY  U½pix=fr 103                                       (7)

                      in which ν is the frequency of image acquisition and Y is the scale factor defined in equation (3).
                      Particle locations are accurate to within 1 pixel, leading to absolute uncertainties on velocity of ±0.2 m/s (for
                      particles traveling vertically) which can lead to an uncertainty of ±2 m/s in the worst case of a particle moving
                      away from the focal plane at an angle of 6°. Now, given particle velocity (Ui) and mass (mi), we can estimate
                      the particle kinetic energy (εi):
                                                                                    1
                                                                             εi ¼     mi U2i                                            (8)
                                                                                    2
                      The particle database for each eruption can now be used to produce particle size, mass, and velocity distributions.
                      We can thus produce distributions for each parameter and integrate each parameter through time to obtain
                      volumes, masses, and energies released over given periods of time. To do this, let Κ = {m, V, ε}, so that
                                                                             X
                                                                        Κt ¼     Ki                                                   (9)
                                                                                       i

                      where Κt is the global parameter {V, m, ε} for all particles. If integrated over the entire emission, this will yield
                      total volume, mass, or kinetic energy. If integrated over discrete time steps, and divided by time step
                      duration, this will give volume or mass flux.

BOMBRUN ET AL.                         ©2015. American Geophysical Union. All Rights Reserved.                                       2370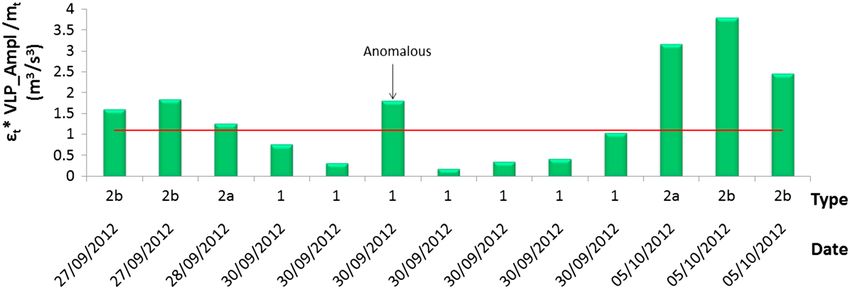
Journal of Geophysical Research: Solid Earth                                                            10.1002/2014JB011556

Table 1. Comparison of Data for a Single Explosion From 2012, All SWC Explosions From 2012, All SWC Explosions From 2014, and All NEC Explosions From 2014
Parameter                                                 Set                Minimum          Maximum            Mean         Standard Deviation   Skew   Kurtosis

Width (cm)                                         09-30_135413067              5.5                37            11                  4.0           1.7      4.4
                                                       SWC 2012                 5.5                64            12                  5.5           2.2      7.8
                                                       SWC 2014                 5.7                73            7.8                 5.0           4.4      27
                                                       NEC 2014                 6.1                64            9.3                 5.3           3.1      14
                                                                                        2
Mass (kg)                                          09-30_135413067       0.2 ± 1.7 × 10         32 ± 4       1.2 ± 0.1             2.2 ± 0.2       6.2       53
                                                                                        2
                                                       SWC 2012          0.2 ± 1.7 × 10        214 ± 24      2.3 ± 0.3             6.2 ± 0.7       12       230
                                                                                        2
                                                       SWC 2014          0.2 ± 1.9 × 10        287 ± 32      1.2 ± 0.1             6.9 ± 0.8       16       385
                                                                                        2
                                                       NEC 2014          0.2 ± 2.4 × 10        223 ± 25      1.6 ± 0.2             6.3 ± 0.7       14       307
Velocity (m/s)                                     09-30_135413067              8.2               216             34                  23           2.9      12
                                                       SWC 2012                 7.7               224             33                  24           3.1      13
                                                       SWC 2014                 8.0               226             51                  39           1.5      2.1
                                                       NEC 2014                 8.6               240             53                  39           1.8      3.0
Average total kinetic energy (MJ)                  09-30_135413067                                                      4.1
                                                       SWC 2012                                                         3.9
                                                       SWC 2014                                                         4.4
                                                       NEC 2014                                                         11
Average number of particles detected per second    09-30_135413067                                                      260
                                                       SWC 2012                                                         156
                                                       SWC 2014                                                         202
                                                       NEC 2014                                                         451
Total number of particles detected                 09-30_135413067                                                      5,449
                                                       SWC 2012                                                        29,552
                                                       SWC 2014                                                        31,493
                                                       NEC 2014                                                        22,175

                                      2.3. Classification
                                      To classify the eruption type, we used histograms for velocity, size, and mass for each explosion. For velocity and
                                      size we used 11 bins, and 26 bins for mass, which when lumped together provided a total of 48 dimensions
                                      available for event characterization. We used the k-means algorithm of MacQueen [1967], this being an iterative
                                      refinement technique which partitions observations into k clusters by minimizing the distance between the
                                      observation and the centroid of a cluster. Usually, the Euclidean distance is used for clustering [e.g., MacQueen,
                                      1967]. However, we used the Bhattacharyya distance [Bhattacharyya, 1943] which, rather than a measure of spatial
                                      similarity, is a measure of the similarity of two probability distributions, as is appropriate for the case in hand.

                                      3. Results
                                      We begin by considering a single eruption from the southwest crater in 2012. The eruption occurred on 30
                                      October at 11:58:26 UTC (reference: 09-30_135413067). The eruption lasted 17 s during which 4382 particles
                                      were detected, meaning that, when time averaged, the emission rate was 258 particles per second. The
                                      particle size distribution has a peak at the interval of 8 cm to 10 cm, with a mean particle width of 11 cm and a
                                      standard deviation of 4 cm, indicating a slight skew toward larger particles. Such a positive skew is common
                                      to all distributions (see Table 1). The particle mass distribution revealed that most particles had a low mass,
                                      where 3773 or 86%, of all of the detected particles had a mass of less than 2 kg. This population accounts
                                      for 2470 kg, or 45%, of the total mass. The remaining 1912 or 14% of the particles thus accounted for 55% of
                                      the total mass ejected, this being 5450 kg.
                                      The velocity distribution had a mode between 20 m/s and 30 m/s, with an average velocity of 34 m/s on
                                      which the standard deviation was 23 m/s. Particle velocities at Stromboli are generally less than 100 m/s
                                      [Chouet et al., 1974; Blackburn et al., 1976; Ripepe et al., 1993; Patrick et al., 2007]. Here 97.6% of all of particles
                                      measured had velocities of less than 100 m/s. However, 103 particles (2.3%) had velocities greater than
                                      100 m/s, and up to 216 m/s. This approaches the higher velocities recently found for normal explosive activity
                                      at Stromboli by Taddeucci et al. [2012a], Delle Donne and Ripepe [2012], Harris et al. [2012], and Genco et al.
                                      [2014]. All of our fast moving particles are relatively small, being less than 20 cm in width. The kinetic energy

BOMBRUN ET AL.                                         ©2015. American Geophysical Union. All Rights Reserved.                                               2371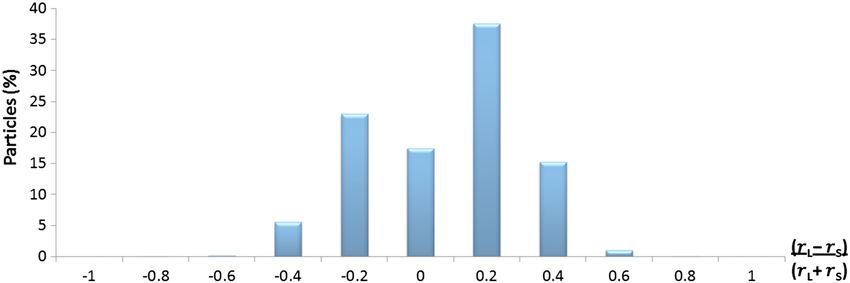
Journal of Geophysical Research: Solid Earth 10.1002/2014JB011556
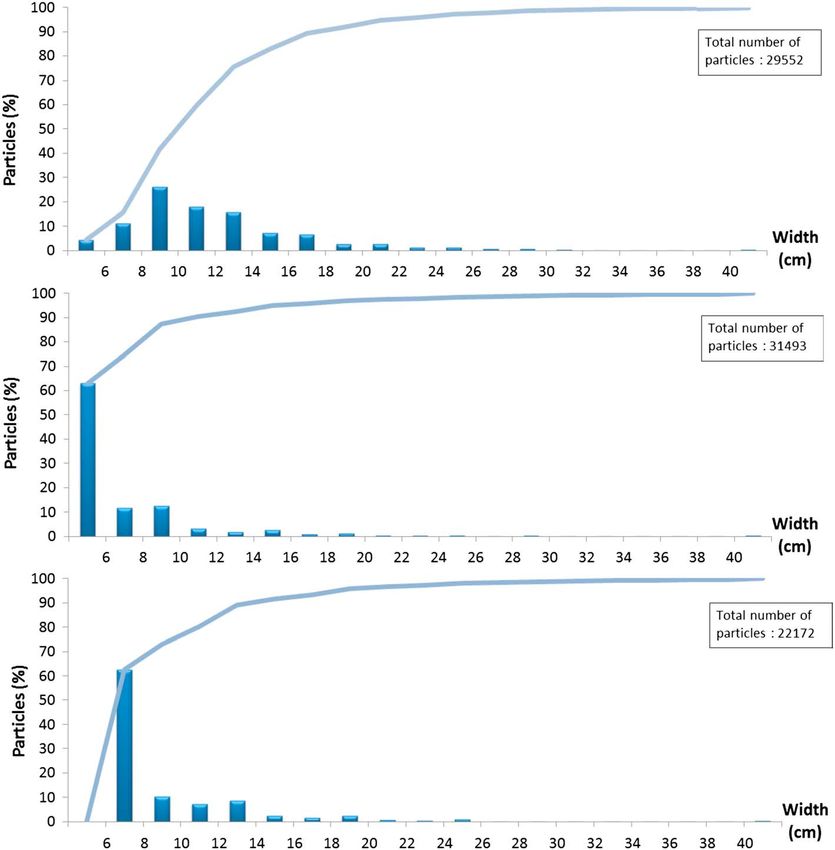
Figure 2. Particle size distribution for eruptions from (a) SWC in 2012, (b) SWC in 2014, and (c) NEC in 2014 with the cumulative
number of particles detected for each case.
carried by lapilli and bombs during this eruption was 4.1 MJ, the equivalent of 1 kg of TNT. This is consistent
with the kinetic energy range of 0.7 to 5.2 MJ as measured at Stromboli during four explosions by Ripepe
[1996] in 1991. These similarities down the years point to a consistency in the intensity and magnitude of
activity over the time scale of decades and to the temporal resilience of the system.
3.1. The 2012 Data Set
While overview statistics for all eruptions recorded during the 2012 campaign are given in Table 1, the statistics
for each of the 13 eruptions recorded in 2012 are given in Appendix A. Emission durations ranged from 5 s to 50 s,
with an average of 16 s. The number of particles detected during a single explosion ranged from 650 to 5240,
with an average of 2270. A total of 29,550 particles were detected during all 13 eruptions. Statistically, the
distribution for all parameters derived from the total 2012 data set was similar to that obtained for the single
eruption described above. We thus assume that all events were analogous or self-similar and thus can be
related to the same process. From here onward, we thus consider the total data set as a reliable descriptor of all
2012 events studied by us.
Due to the large number of particles detected, the data set is statistically robust; even if some false detections
occurred, they will have a vanishingly small impact on the final statistics. The particle size distribution (Figure 2a)
reveals that the majority of the particles (82%) had widths of between 5 cm and 15 cm with an average of 12 cm.
However, these results have to be treated with caution because particles with widths less than 5 cm will not be
detected due to the spatial resolution of our system. Masses erupted range between 1270 kg and 11,820 kg,
with an average of 5340 kg. Individual bombs have masses of up to 214 kg, and while 90% of the particles were
less than 5 kg, 75% were less than 2 kg (Figure 3a). However, the 1021 particles greater than 25 cm (i.e., 3.4% of
the total detected particles) account for 36% of the total mass. Velocities again had a mode between 20 m/s and
BOMBRUN ET AL. ©2015. American Geophysical Union. All Rights Reserved. 2372Journal of Geophysical Research: Solid Earth 10.1002/2014JB011556
Figure 3. Particle mass distribution, total mass distribution, and distribution function for eruptions from (a) SWC in 2012, (b)
SWC in 2014, and (c) NEC in 2014. The light gray histogram shows the impact of heavy particles on the total mass ejected.
30 m/s with an average of 33 m/s (Figure 4a), and 97% of particles had a velocity less than 100 m/s, with the
maximum velocity being up to 224 m/s.
3.2. The SWC Data Set From 2014
First, we focus on the 13 eruptions which occurred from the southwest crater. This data set provides information
on a further 31,500 particles. These statistics are summarized in Table 1 and broken down by eruption in
Appendix B1. Emission durations ranged from 6 s to 22 s, with an average of 12 s, and the number of particles
detected during a single explosion ranged from 610 to 4385, with an average of 2420. A total of 31,500
particles were detected during all 13 eruptions. The particle size distribution (Figure 2b) reveals that the
majority of the particles (63%) were below 6 cm and the distribution was tighter than in 2012. Masses erupted
ranged between 1840 kg and 4740 kg, with an average of 2908 kg. Ninety-six percent of the particles were
less than 5 kg, and 93% were less than 2 kg (Figure 3b). However, the 584 particles that were greater than
25 cm (i.e., 1.8% of the total detected particles) accounted for 56% of the total mass. The particle velocity
distribution (Figure 4b) had a mode between 20 m/s and 30 m/s. The average was 51 m/s, with 88% of the
particles having a velocity of less than 100 m/s, the maximum velocity being 226 m/s.
3.3. The NEC Data Set From 2014
Now we consider the five eruptions which occurred at the northeast crater in 2014. This data set provides
information for a further 22,175 particles. These statistics are summarized in Table 1 and are broken down by
eruption in Appendix B2. Emission durations ranged from 7.5 s to 16 s, with an average of 10 s. The number of
particles detected during a single explosion ranged from 2580 to 5320, with an average of 4435. A total of 22,175
BOMBRUN ET AL. ©2015. American Geophysical Union. All Rights Reserved. 2373Journal of Geophysical Research: Solid Earth 10.1002/2014JB011556
Figure 4. Particle velocity distribution and distribution function for eruptions from (a) SWC in 2012, (b) SWC in 2014, and (c)
NEC in 2014.
particles were detected during all five eruptions. We note that emission rates in terms of the number of particles
per second (pps) was higher at NEC (450 pps) than at SWC during both 2012 (155 pps) and 2014 (200 pps).
The particle size distribution for NEC (Figure 2c) was similar to that of the SWC with a mode between 6 cm and
8 cm. Masses recorded at NEC ranged between 3540 kg and 10,255 kg with an average of 6845 kg. Ninety-five
percent of all particles erupted were less than 5 kg, and 87% were less than 2 kg (Figure 3c). However, the 495
particles that were greater than 25 cm (i.e., 2.2% of all detected particles) accounted for 45% of the total mass.
The velocity distribution (Figure 4c) had a mode between 20 m/s and 30 m/s, with an average of 52 m/s. For
the NEC case, 88% of particles had a velocity less than 100 m/s, with the maximum velocity being 240 m/s.
3.4. Differences: 2012 Versus 2014—A Measure of Fragmentation Efficiency?
The proportion of low mass particles erupted in 2012 (75% < 2 kg) was less than in 2014 (93% < 2 kg at SWC
and 87% at NEC). This difference is reflected in the size distributions that were skewed toward bombs in 2012
and toward lapilli in 2014. Because bombs account for a disproportionate percentage of the mass of each
eruption, the bomb-dominated SWC eruptions of 2012 were generally of a higher mass (average of 5340 kg)
than in 2014 (average of 2908 kg) even though particles were erupted at a lower rate in 2012 (155 pps in 2012
versus 200 pps in 2014). This is all consistent with greater degrees of fragmentation, higher efficiency of
fragmentation, and higher explosion energies in 2014 as opposed to 2012 so as to create a larger number of
smaller particles in the second year. Indeed, kinetic energies were also higher at SWC in 2014 (average = 4.4 MJ)
than in 2012 (average = 3.9 MJ). In addition, eruptions in 2012 had lower average velocities (33 m/s in 2012
versus 51 m/s in 2014) and a lower number of high-velocity particles; i.e., 3% were ejected at velocities greater
than 100 m/s in 2012 compared with 12% in 2014. This seems to support the model where small particles
are carried by the fast moving gas phase [Harris et al., 2013], where the greater number of small particles
BOMBRUN ET AL. ©2015. American Geophysical Union. All Rights Reserved. 2374Journal of Geophysical Research: Solid Earth 10.1002/2014JB011556
Table 2. Preliminary Results of the Clustering Algorithm on the 2012 available for gas transport in 2014
a,b meant that there was a larger
Data Set
Eruption Reference Type 2a Type 2b Type 1 Type 2a + 1 population of high-velocity particles
in that year. These results point to a
09-27_154909271 KV
scenario, whereby changing degrees
09-27_155839983 KV
09-28_135432903 KV KV of fragmentation efficiencies can be
09-30_125847157 K V KV tracked using the global mass and
09-30_131721017 KV KV kinetic energy parameters, as well as
09-30_132029052 KV KV the typical particle velocity, size, and
09-30_133102430_1 KV KV
number statistics for each eruption.
09-30_133102430_2 K V KV
09-30_134451828 K V KV
3.5. Classification
09-30_135413067 K V KV
10-05_144505552 V K V Patrick et al. [2007] classified normal
10-05_145321701 KV explosions at Stromboli into two
10-05_150241747 KV
groups: Type 1 eruptions, which
a
The visual clustering is represented by the V, whereas the k-means are dominated by coarse ballistic
clustering is the K. particles, and Type 2 eruptions,
b
Classification is between three types: ash with bombs and lapilli (Type
2a), ash without lapilli, and bombs (Type 2b) and gas-dominated plus coarse which are ash dominated with (2a)
(Type 1). or without (2b) large number of
lapilli- to bomb-sized pyroclasts. To
this, Leduc et al. [2015] added a third
category: Type 0. This event type is characterized by gas-dominated, high-velocity jets with velocities of
hundreds of meters per second but involving few or no lapilli or bombs. Goto et al. [2014] geophysically
defined such gas-rich and fragment-poor event types finding them to be characterized by a dominant shock
wave component and supersonic velocities. Although Goto et al. [2014] termed this eruption style Type 3,
we prefer Type 0 because this nomenclature fits the initial classification philosophy:
• Type 2: Two solid components = fine (ash) plus coarse (lapilli + bombs);
• Type 1: One solid component = coarse (lapilli + bombs);
• Type 0: No solid components = gas only (with aerosols);
Of course there is a continuum between these three classes of normal explosion. Type 0 may have a few or
several particles entrained in the gas jet [Leduc et al., 2015]; Type 2, as recognized by Patrick et al. [2007], may
range between fine (Type 2a) and coarse (Type 2b) particle dominated. Likewise, Type 1 may be more or
less particle loaded. All normal explosions will involve gas, but the key in this classification is the relative
proportions of gas to fine and coarse material.
All parameters used to automatically classify the events are summarized in Table 1. These were used to
separate the events into three classes, Types 2a, 2b, and 1 (we had no Type 0 cases), by running the clustering
algorithm. We then completed a visual cluster analysis which classified the eruptions depending on their
visual character as observed from viewing the thermal video. A comparison of the results from the automatic
and manual methods is given in Table 2. We find that our algorithm separated out ballistic-dominated
eruptions (Type 2b), misclassifying only one event. However, there is some mixing of Types 2a and 1. This is
because the classification is based on particle parameters, and because Types 2a and 1 have been improved if
we had simultaneous measurement of the fine particle and gas content. For now, if we lump Types 2a and 1
together, we only have one misclassification (Table 2).
3.6. Validation
In Figure 5, we compare our results (Figure 5b) with those obtained from 690 bombs sampled from a fall out
field associated with a major (bomb dominated) explosion (Figure 5a) at Stromboli [Gurioli et al., 2013]. We
also compare our results with those obtained from a weak (lapilli dominated) explosion sampled toward the
end of the 2012 campaign [Harris et al., 2013]. This lapilli sampling involved laying out of four tarps (3 × 4 m
plastic sheets) on 28 September 2012. These were placed on the outer flank of the SWC, 75 m SW of the active
vent, and were retrieved in 5 October 2012. Upon retrieval, all juvenile coarse ash, lapilli, and Pele’s hair were
collected. This sample provides the “multiple-explosion” distribution of Figure 5c. On 5 October, fine material
from SWC explosions was being blown (by the wind) off of the top of plume toward the SW. Here material
BOMBRUN ET AL. ©2015. American Geophysical Union. All Rights Reserved. 2375Journal of Geophysical Research: Solid Earth 10.1002/2014JB011556
Figure 5. Particle weight percent by class size φ. For three eruption types: a (a) bomb-dominated explosion, a (b) normal
explosions, and a (c) lapilli-dominated explosions.
landed on a tarp that had just been cleaned following an explosion at 15:50 (local time). Fall out onto the tarp
began 20–30 s after bomb fall out within the crater was heard to finish and all coarse ash, lapilli, and Pele’s
hair that arrived during the 10 s long fall out event were collected. These were returned to the laboratory
where their sizes and masses were measured. In total, 48 lapilli were collected for the 5 October 15:50 event
with a total weight of 5.27 × 10³ kg, the largest being 2.3 cm (6.8 × 10⁴ kg) and the smallest being 2–3 mm
(1.0 × 10⁵ kg). This sample provides the “single-explosion” distribution of Figure 5c.
The thermal-camera-derived particle size distribution of Figure 5b is between the “bomb-dominated” and
“lapilli-dominated” end-members and is similar to the distribution obtained by Colò [2012] for a normal
explosion at Stromboli. We note that the fine tail made up of fine lapilli and coarse ash is not well defined
because of the detection limits of our camera. In effect, particles smaller than the pixel size, i.e., 5.3 cm
in diameter, are not detected. However, even if the number of particles that comprise the lapilli and ash
component of such emissions is significant, their impact in terms of mass is not [Gurioli et al., 2013].
The thermal-camera-derived particle size distribution shows a distribution between the bomb-dominated and
lapilli-dominated end-members (Figure 5b). The lapilli-dominated samples collected from the tarps at SWC
during the same campaign have a lapilli and coarse ash dominated distribution (Figure 5c). This is consistent
with visual observations. On 27 September, SWC was noted as giving impressive bomb-rich and gas-rich
explosions, with heavy bomb loading to 250 m above the vent, with NEC giving less frequent and less vigorous
eruptions. However, by 5 October, the SWC was giving ash jets loaded with small bombs and lapilli, with
the highest fragments reaching just 50 m above the vent. By this time, however, NEC was giving impressive
bomb-rich bursts to 200–250 m. While most of the events sampled by the thermal camera were collected
during the first 2 days of the 2012 sampling period (27 and 28 September), the sampling that contributes to
the size distribution given in multiple-explosion distribution in Figure 5c was completed on 5 October and
comprised fine-grained material that fell out on that day. Bad weather would have blown away all other
material settling onto the sheets during the preceding days, and no bombs or burn holes were observed. This is
supported by the agreement between the multiple-explosion and single-explosion distributions in Figure 5c.
For the single explosion sampled at 15:50 on 5 October, if we multiply the number of coarse ash, lapilli,
and Pele’s hair falling in our 12 m2 control zone (areal number density = 4 m2) by the 4000 m2 fall out
area identified using the thermal imagery obtained from an airborne (helicopter) vantage point, we obtain a
total particle number of 16 × 103 for this size range. This compares with a particle number of 1.3–1.6 × 10³ for
the coarse lapilli-bomb size range obtained for SWC eruptions using the thermal camera on the same day.
BOMBRUN ET AL. ©2015. American Geophysical Union. All Rights Reserved. 2376Journal of Geophysical Research: Solid Earth 10.1002/2014JB011556
a
Table 3. Ballistic Exit Velocities for Eruptions at Stromboli and Etna
Study Velocity (m/s)
Volcano Method Min Max Mean Reference
b
Etna (Italy) Photoballistics 15 79 51 McGetchin et al. [1974]
Stromboli (Italy) Photoballistics 2.5 72 26 Chouet et al. [1974]
c
Stromboli (Italy) Particle tracking - - 22 Ripepe et al. [1993]
Stromboli (Italy) Thermal video (6 Hz) 26 71 47 Vanderkluysen et al. [2012]
Stromboli (Italy) Thermal video (30 Hz) 3.0 101 34 Patrick et al. [2007]
Stromboli (Italy) Thermal video (30 Hz) 9.0 129 46 Harris et al. [2012]
Stromboli (Italy) Thermal video (50 Hz) 23 203 - Delle Donne and Ripepe [2012]
Stromboli (Italy) High-speed video (500 Hz)Journal of Geophysical Research: Solid Earth 10.1002/2014JB011556
Figure 6. Particle shape distribution of the whole data set (SWC 2012 and SWC/NEC in 2014). Most of the particles do not
have a spheroid shape but have either an oblate or prolate shape.
4.1. Particle Numbers, Sizes, Shapes, and Masses
Our particle counts range between 612 and 5316 per eruption, with an average of 2684 particles. In Figure 6,
we assess particle shape in terms of the following normalized shape index: (rL rS)/(rL + rS). Using this index, a
perfectly oblate shape will have a value of 0.3333, whereas a perfectly prolate shape will have a value of
+0.3333; a perfect sphere will have a value of 0. We found that only 17% of our particles approximate a
spherical shape. Of the remaining 83%, 29% are oblate and 54% are prolate. The dominance of the prolate
shape is consistent with deformation or stretching in the direction of motion. Our prolate particles are up
to 5.6 times longer (in the flight direction) than they are wide (index = 0.7). In the oblate direction, as we move
from an index of 0.2 to 0.6, fragments become increasingly stringlike, being stretched in the horizontal
direction until we reach a value of 1, which is technically impossible. On the video, fluid particles are seen
to stretch in the flight direction, tear, and spin, with stretching occurring over time scales of tenths of a
second. As already stated, our aim is to capture the initial vent-leaving shape before in-flight or ground
impact-induced deformation and secondary fragmentation. We observe that both of these processes are
beginning to occur, so as to modify the size and shape distributions, over just the first few meters of flight.
However, we find no relation between size and shape, probably because all of our particles are quite large,
molten, and deformable, so that all sizes in our range undergo motion-induced deformation.
The majority of Chouet et al.’s [1974] particles have diameters of less than 30 cm. In our study, 99% of the
particles are below this limit, of which 62% fall in the bomb category (i.e., they are >6.4 cm). This reduces to
11.5% if we consider the absolute total from the projection of Figure 7. Our projections indicate that by size,
the emission is dominated by particles smaller than 5.3 cm. This is consistent with the comparison with
the lapilli field sample completed in 2012, where the thermal camera captured around 10% of the particles
by number. In terms of total erupted masses during individual explosions, we obtain a range of 1270 to
11,822 kg, with a mean of 4585 kg. This is consistent with recent measurements of mass, which indicate
eruptive masses of up to 35,000 kg [Ripepe et al., 1993; Ripepe, 1996; Harris et al., 2012], compared with 8 and
100 kg obtained by Chouet et al. [1974].
4.2. Projections and Correlations in the Total Data Set
If we plot size against the number of particles, we find that number increases with decreasing size in an
exponential fashion (Figure 7). The trend indicates a total number of lapilli and bombs emitted during all 31
events of 450,000. Because we detect a total of 83,000 particles, due to spatial resolution problems, we are
Figure 7. Trend between the total number of particles detected and their sizes.
BOMBRUN ET AL. ©2015. American Geophysical Union. All Rights Reserved. 2378Journal of Geophysical Research: Solid Earth 10.1002/2014JB011556
Figure 8. Trend between mass and width of particles.
missing around 367,000 of the smallest (1 m) accounted for 31% of the
deposit by volume, such particles only accounted for 1% by number.
By number, the emission is thus dominated by small (Journal of Geophysical Research: Solid Earth 10.1002/2014JB011556
where g is the acceleration due to gravity, ρparticle is the particle density, ρgas is the gas density, CD is the drag
coefficient, and D is the particle diameter. Following Chouet et al. [1974], this equation has commonly been
reduced to [e.g., Ripepe et al., 1993]
pffiffiffiffi
U ¼ Ugas –k D (12)
The trend of equation (10) defines the maximum limit of the D versus U scatters for each of our 31 explosions.
In our data this empirical fit can be approximated by
pffiffiffiffi
U ¼ Ugas – D (13)
Thus, following Steinberg and Babenko [1978], the upper limit of the relation follows a rule whereby particle
velocity decreases with the square root of particle diameter. Below this limit, we have a “black cloud” of data
points (Figure 9). This scatter is likely due to the large number of gas densities likely apparent between
eruptions and during single events [Harris et al., 2012]. Our observations of both visible, thermal, and UV
videos suggest that all of the parameters in Steinberg and Babenko’s [1978] relation, including gas density,
likely change over the time scale of a few tenths of a second, making application of such a simple relation to a
single explosion problematic to say the least. In addition, although some particles may be coupled to the gas
phase, thereby obeying this law, others will be undergoing varying degrees of decoupling. Complete
decoupling means that we revert to the relation
sffiffiffiffiffiffiffiffiffiffiffiffiffiffiffi
dg
U¼ (14)
sinð2θÞ
in which d is the distance reached by the particle and θ is the launch angle. In short, the black cloud in Figure
9 is formed because particles with the same width show a large range of velocity and vice versa. For the same
particle size, we can have a large range of velocity and vice versa; the same velocity can be reached by
different particles. This scatter indicates a large variability in the analyzed explosive dynamics. The trend
becomes narrower toward the large particle-low velocity end of the plot, indicating that variability increases
as particle size decreases, suggesting that only the smallest particles are capable of revealing the
complexities and variability of particle launch dynamics.
Using equation (10), we obtain a maximum velocity of 456 m/s for a particle width of 1.5 cm, in line with the
findings of Taddeucci et al. [2012a], and up to 700 m/s for the smallest particle to which this relation can be
applied. Note that these “extrapolated” maximum velocities are based on projection from data for observed
particles into a field of non-observed particles. However, the excellent correlation coefficient (R2 = 0.97) for the
trend gives us confidence in these extrapolated values for particles that were too small to be resolved by our
camera system. For us, the extrapolations are thus only valid down to lower size range of lapilli and cannot
be used to assess ash parameters. Following our argument above, our physical explanation for these high
velocities is that of Harris et al. [2012], whereby the smallest particles are carried by the fast moving gas phase
which accounts for the highest velocities found for the lapilli so that they are markers for the gas velocity.
Bombs are decoupled from the gas phase due to their mass and are just driven by momentum so that lowest
velocities are found for the largest particles.
4.3. Correlation With Seismic Amplitude
Seismoacoustic recordings collected during the explosions of the 2012 experiment were in general weak.
No clear acoustic signals associated with the explosions could be identified at the reference station. This
precluded assessment of thermo-infrasonic following Ripepe et al. [2001, 2002], seismic time delays, or
assessment of free-surface level.
From a seismic point of view, signals related to explosions at Stromboli classically include a short-period (SP)
waveform (1–5 Hz) [Ripepe, 1996], a high-frequency (HF) component (>5 Hz) corresponding to the coupling
to the ground of the infrasonic wave [Braun and Ripepe, 1993], and a very long period component with
periods up to several tens of seconds [Neuberg et al., 1994]. During the 2012 experiment, SP signals were
often barely above the levels of background tremor and HF acoustic phases were non identifiable. VLP signals
were the most prominent feature associated with the explosions with the clearer waveforms being observed
BOMBRUN ET AL. ©2015. American Geophysical Union. All Rights Reserved. 2380Journal of Geophysical Research: Solid Earth 10.1002/2014JB011556
Figure 10. Volumetric acceleration of different types of eruption detected visually on the infrared video used for the 2012
data set.
on the east-west component nearly radial to the craters. We calculated the peak to peak amplitudes of these
VLP components for the EW component after filtering between 0.03 and 0.2 Hz with a two-pole Butterworth
causal filter. We find that the Type 1 events had the lowest seismic amplitudes, where some of them were
so feeble that they were within the tremor noise. There is one exception, the sixth event in the series, which
was particularly long, lasting 50 s; all other events being 5 to 22 s in duration. Type 2a and 2b events were
generally associated with greater amplitudes. There is a weaker correlation with kinetic energy and mass,
but if we combine all three parameters, we arrive at the trend of Figure 10. Given that these parameters
provide the strongest relation, we suggest that they play a fundamental role in controlling the process or
they are the main variables controlled by the process.
4.4. Source Mechanism
We see from Table 2 that during the 2012 experiment, the eruptions cycled from ash-and-bomb rich (Types
2a and 2b) to bomb-and-gas rich (Type 1) and back again to Types 2a and 2b over a time scale of 10 or
so hours. We also find that during 2012, explosions had lower particle numbers, velocities, and kinetic energies
than in 2014 but involved greater masses. This, as already stated, points to a more efficient, energetic, and
gas-driven explosion mechanism in 2014 compared with 2012.
Eruptions at Stromboli have been classically explained by generation of a large gas mass, or slug, which ascends
the magma-filled conduit to burst at the free surface [Jaupart and Vergniolle, 1989; Vergniolle and Brandeis, 1996;
James et al., 2004]. Bomb-rich eruptions may be the result of fragmentation of a viscous, degassed plug or
rheological layer at the head of the magma column which fragments upon arrival of the slug [Gurioli et al.,
2014], and/or the extraction of the degassed material stuck to the conduit wall by passage of the slug [Lautze
and Houghton, 2005]. Textures and associations of different textural facies, including the presence of dense,
crystal-rich degassed material mixed with juvenile material in bombs sampled by Gurioli et al. [2014], were
consistent with the cap model. Breaking of a cap would also require a greater degree of seismic energy, as
opposed to a situation where fragmentation is caused by bursting of a bubble at a low viscosity and yield
strength magma surface [Gurioli et al., 2014; Leduc et al., 2015]. It would also explain lower particle numbers,
velocities, and kinetic energies, along with larger particles, during such cap-dominated events. We thus suggest
that during Types 1 and 2 activity, which possess these dynamic characteristics, a complete cap was in place
which fragmented upon arrival of the gas slug, following the model of Gurioli et al. [2014].
During Types 1 and 2 events, Gurioli et al. [2014] and Leduc et al. [2015] suggested that magma levels were
relatively high with the magma column being capped by degassed material and/or, following Patrick et al.
[2007], scoria. While fragmentation of the cap feeds an impressive Type 1 particle emission [Gurioli et al.,
2014], the particles being accidental incorporation of previously degassed material [Harris et al., 2012],
grinding of scoria adds the ash component to the Type 2 events [Patrick et al., 2007]. However, convective
overturn of the cap can result in a cleaner conduit, with a lower level, where the bubble bursts at a fresh
magma surface, or through a thinner cap, so that the particle load of the gas jet is small-to-nonexistent, and
exit velocities are high due to coupling of rare but small particles to the gas phase [Leduc et al., 2015]. These
are Type 0 events. We indeed find that the fastest moving particles are small but rare and are capable of
attaining velocities toward 500 m/s. The fresh conduit scenario fits our Type 1 scenario for the 2012 data set,
where seismic energy, kinetic energy, and particle mass are lower due to the presence of a smaller cap than
during the Type 2a and 2b events (Figure 10). However, we do not record true Type 0 events as particle loads
BOMBRUN ET AL. ©2015. American Geophysical Union. All Rights Reserved. 2381Journal of Geophysical Research: Solid Earth 10.1002/2014JB011556
are still quite high. In addition, the lower masses and smaller particle sizes, but high velocities, particle
numbers, and kinetic energies during 2014 suggest a more efficient, less cap-dominated fragmentation
model for 2014 compared with 2012. However, again, relatively high particle masses are inconsistent with
true, completely cap-free and particle-free Type 0 activity.
There is bound to be a continuum of styles from Type 0 through Type 1 to Types 2a and 2b. We suggest,
that the continuum is from Type 0, which has the lowest particle masses and no cap influence, through Type 1
—which has moderate particle masses and some cap influence—to Types 2a and 2b, which have highest
particle masses and a strong cap influence and/or interaction with scoria plugs. As we move through this
sequence, the gas influence also decreases so that the size of the population of fastest moving particle
decreases, kinetic energy decreases, but seismic energy increases as more energy is produced by cap
breakage than simple bubble bursting in a low-viscosity fluid. Fragmentation efficiency also decreases so
that the number of particles erupted decreases, but their size increases. Between the two end-member
conduit scenarios, capped and uncapped, there is a density-driven convective overturn event [Allard et al.,
1994; Stevenson and Blake, 1998], after which the cap rebuilds, to push the system back to the initial
conditions. The duration of our cycles (~10 h) may be the time scale of cap construction and overturn
during the 2012 experiment. Indeed, the time scale of the persistence of our two eruption types and
associated characteristics recorded here is consistent with the time scale of convective overturn recorded
in similar geophysical data sets at Stromboli [Ripepe et al., 2002, 2005, 2008]. Convective overturn at
Stromboli has been associated with changes in the seismic-acoustic-thermal delay [Ripepe et al., 2001,
2002], which are thought to relate to changes in the magma level [Ripepe et al., 2005, 2008]. Unfortunately,
during our analysis period, seismic signals were so weak that we were unable to examine delay times.
5. Conclusions
We collected high frame rate thermal video for 31 normal explosions at Stromboli during October 2012 and
May 2014. Constraint of the vent-leaving particle dynamics allowed us to move closer to validating a model
for normal explosive activity at Stromboli, whereby the system cycles between periods of capped behavior
during which the slug fragments through a cap of degassed magma and free-surface behavior when the cap
is absent so that slugs burst through lower viscosity (uncapped) magma.
We first used the algorithm of Bombrun et al. [2014] to obtain a statistically robust database of 83,000 particles to
compute the size, mass, and velocity of each particle. Statistically, the distribution for all parameters computed
for the 13 eruptions of 2012 is similar to that obtained for the 18 eruptions of 2014. Most of the particles have
sizes between 5 cm and 15 cm, and the majority of individual bomb masses are below 0.4 kg. However,
although 4950 (6%) of the particles are heavier than 5 kg, they represent 59% of the total mass erupted.
The particle velocity distribution is positively skewed with a mode between 20 m/s and 30 m/s. Normal
explosive activity at Stromboli has typically been viewed as involving large particles with relatively low
velocities, with a mean of around 25 m/s [Chouet et al., 1974; Ripepe et al., 1993]. Recently, however, Delle Donne
and Ripepe [2012] and Harris et al. [2012] have shown that a few small (typically lapilli sized) particles can be
ejected as part of an initial high velocity gas jet, which has average velocities of 80 m/s and a maximum of
405 m/s [Taddeucci et al., 2012a]. Our data support this duality. The spatial resolution of our system allows us to
detect particles down to 5 cm. In our data, most (probably all) of the bombs (size greater than 6.4 cm) are
detected, and the bomb velocity distribution has a mode between 20 m/s and 30 m/s. Our data also indicate
that the smallest particles, carried by the gas jet, have the highest velocities with a maximum measured speed
of 240 m/s, and a projected maximum potential velocity of 700 m/s for the smallest lapilli (0.2 cm in size), as
extrapolated to the lowest particle size to which the relationship plotted in Figure 9 can be applied.
Patrick et al. [2007] and Leduc et al. [2015] classified normal explosions at Stromboli by visual clustering,
the classification depending on whether they were ballistic dominated (Type 1), ash dominated, with (2a)
or without (2b) particles, or gas dominated (Type 0). We used our measured parameters to cluster our explosions
into the same four classes. The correlation with seismic data helps to understand the source mechanism
and supports the models of Gurioli et al. [2014] and Leduc et al. [2015]: Types 2a and 2b events are a consequence
of the presence of a viscous, degassed cap at the head of the magma column, its fragmentation providing 103
to 104 kg of solid material in each eruption. However, Type 1 is a consequence of slug bursting in a “cleaner”
conduit, involving a lower mass of solid material, where true Type 0 eruptions involve almost no solid material.
BOMBRUN ET AL. ©2015. American Geophysical Union. All Rights Reserved. 2382Journal of Geophysical Research: Solid Earth 10.1002/2014JB011556
Appendix A: Southwest 2012 Data Set
Duration
Reference Number of Detected Particles Number of Frames Times (s)
09-27_154909271 1,788 2,692 13
09-27_155839983 3,064 1,600 8
09-28_135432903 715 1,000 5
09-30_125847157 3,015 2,352 12
09-30_131721017 975 3,698 18
09-30_132029052 4,215 9,999 50
09-30_133102430_1 648 3,300 16
09-30_133102430_2 1,255 2,485 12
09-30_134451828 5,240 4,513 23
09-30_135413067 4,382 3,376 17
10-05_144505552 1,392 2,502 13
10-05_145321701 1,558 2,215 11
10-05_150241747 1,305 2,963 15
a a
All 29,552 3,284 16
a
Mean value.
Width (cm)
Reference Maximum Minimum Mean Median Value Standard Deviation
09-27_154909271 59 5.8 12 10 5.4
09-27_155839983 62 5.8 14 12 6.5
09-28_135432903 50 5.7 10 9 5.2
09-30_125847157 50 5.5 12 11 5.2
09-30_131721017 42 5.5 14 12 4.9
09-30_132029052 56 5.5 14 12 5.2
09-30_133102430_1 52 5.5 14 12 6.6
09-30_133102430_2 41 5.5 12 11 4.9
09-30_134451828 46 5.5 11 10 4.3
09-30_135413067 37 5.5 11 10 4.0
10-05_144505552 64 5.9 14 12 5.2
10-05_145321701 48 5.9 12 10 5.6
10-05_150241747 62 5.9 15 13 7.4
Mean 51 5.6 12 11 5.4
Velocity (m/s)
Reference Maximum Minimum Mean Median Value Standard Deviation
09-27_154909271 224 8.3 37 27 29
09-27_155839983 218 8.4 34 27 23
09-28_135432903 199 8.4 35 25 29
09-30_125847157 198 8.0 33 25 24
09-30_131721017 158 8.9 24 20 15
09-30_132029052 195 8.1 29 24 18
09-30_133102430_1 203 9.0 22 19 18
09-30_133102430_2 180 8.4 27 22 18
09-30_134451828 204 7.7 32 24 23
09-30_135413067 216 8.2 34 27 23
10-05_144505552 221 9.3 41 35 29
10-05_145321701 209 8.5 41 30 32
10-05_150241747 223 8.5 34 26 27
Mean 204 8.4 33 25 24
BOMBRUN ET AL. ©2015. American Geophysical Union. All Rights Reserved. 2383You can also read


