Amersham Typhoon Biomolecular Imager - GE Healthcare Imaging systems, software, and accessories
←
→
Page content transcription
If your browser does not render page correctly, please read the page content below
GE Healthcare
Imaging systems, software, and accessories
Amersham™ Typhoon™
Biomolecular Imager
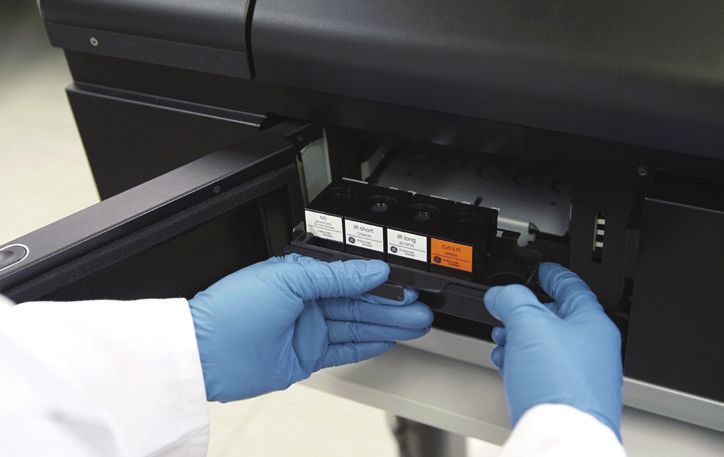
Amersham Typhoon Biomolecular Imager (Fig 1) is a new
generation of laser scanners that provide you with exceptional
data quality through extremely sensitive detection, high image
resolution, and a very broad linear dynamic range. These
versatile imaging systems support multiple imaging modes,
including phosphor imaging, red/green/blue (RGB) and near
infrared fluorescence, as well as optical densitometry (OD) of
proteins in stained gels. The Amersham Typhoon 5 model offers Fig 1. Amersham Typhoon Biomelecular Imagers are versatile, high-
performance laser scanners for sensitive and quantitative measurements in
a five-laser configuration option with advanced photomultiplier
a multiuser environment. The image shows the main instrument (right), the
tubes to cover all of these imaging modes. Two other Amersham Amersham Eraser (top left), and the accessory cabinet (bottom left).
Typhoon models are available—one for RGB fluorescence, OD
measurement, and phosphor imaging, and one dedicated for • Flexibility: modular design allows you to customize the
phosphor imaging—so you can choose the best option based on imager for your users’ needs. Systems can be adapted with
the needs of the system users. Moreover, upgrade paths among stages, detectors, filters, and lasers. Several upgrade kits
different models are available at any time after the installation. are available
Amersham Typhoon scanners deliver: • Ease of use: Amersham Typhoon 5 and RGB models have
• Versatility: use one system to image multifluorescent-, auto- and semi auto-scan functions, as well as automatic
radioisotope-labeled, and colorimetric samples on gels, filter recognition
membranes, multiwell plates, culture dishes, glass slides,
The Amersham Typhoon series of scanners provides you with
and tissue sections. The IP model is for phosphor imaging
versatile and flexible imaging to precisely quantitate proteins,
only but can be upgraded
nucleic acids, and other biomolecules. Amersham Typhoon 5
• Accurate quantitation: detect signals from as low as and Amersham Typhoon RGB are variable-mode laser scanners
3 pg of protein and differences across a dynamic range with that allow users to easily add or change filters to create new
greater than 5 orders of magnitude laser and filter combinations (Fig 2).
• High resolution: resolve fine details in your sample with a
pixel resolution of as low as 10 µm
• High sample throughput: large scanning area of
40 × 46 cm enables you to simultaneously image up to
20 gels or blots, measuring 10 × 8 cm in size. It is also
possible to scan up to 9 multiwell plates in a single scan.
This throughput facilitates comparisons among blots and
plates, reduces workload, and decreases waiting time. The
IP model has a scanning area of 35 x 43 cm, which fits GE’s
largest imaging plate Fig 2. Users can easily exchange the filters in Amersham Typhoon 5 and
RGB models. If a new filter is inserted or a filter is changed, the instrument
automatically recognizes the filter and updates the control software.
Data file, 29229537AA
Table 1. Typhoon scanner series comprises three different configurations

                                        Phosphor imaging              Densitometry (OD)                                   RGB fluorescence                       Near-infrared fluorescence
Amersham Typhoon IP                     x                             o                                                   o                                      o
Amersham Typhoon RGB                    x                             x                                                   x                                      o
Amersham Typhoon 5                      x                             x                                                   x                                      x
OD = optical density

Amersham Typhoon 5 and RGB are versatile laser scanners for                                                               8
precise quantitation of biomolecules in gels, blots, and other

                                                                                             log (integrated intensity)
                                                                                                                          7
sample types. Amersham Typhoon 5 model has the same                                                                       6
capabilities as the Amersham Typhoon RGB model, with the
                                                                                                                          5
addition of near-infrared (NIR) functionality (Table 1).
                                                                                                                          4
Amersham Typhoon 5 and RGB support the following
                                                                                                                          3
imaging modes:
                                                                                                                          2
• Near-infrared fluorescent imaging for NIR fluorescent                                                                        0          1        2         3        4        5        6
  Western blotting and other applications (Amersham                                                                                           log (pg phosphorylase B)
  Typhoon 5 only, but RGB can be upgraded)
• Visible fluorescence imaging in red, green, blue (RGB)                                    Phosphorylase B
  channels to support multiplex fluorescence imaging                                             2.8                          1.4   0.7   0.36   0.18   0.09 0.045 0.02   0.01 0.006   (ng)
  (e.g., 2D-DIGE)
• Imaging of multiplex RGB fluorescent Western blots, using
  ECL Plex™ and/or other fluorophore-labeled antibodies
                                                                                            Sample                                               Phosphorylase B in LMW marker
• Phosphorimaging, in which samples containing 3H, 14C, 32P,                                Gel                                                  Amersham WB 8-18% SDS-PAGE
                                                                                            Imaging                                              Excitation              Emission filter
  33
    P, 35S (or other sources) are exposed to a storage phosphor                                                                                  635 nm                  Cy5 670BP30
  screen (imaging plate)                                                                    LOD                                                  5.6 pg
                                                                                            DR                                                   4.8 orders of magnitude
                                                                                            Linearity                                            R2=0.9997 and k=1.01
• Optical densitometry for quantitation of colorimetrically-                                                                                     (trendline in log-log plot)
  stained samples (e.g., Coomassie™ blue, silver stain)
                                                                               Fig 3. Phosphorylase B was labeled with CyDye™ DIGE fluor Cy5 minimal
• Chemiluminescence imaging that does not require
                                                                               dye and separated using a precast gradient Amersham WB gel. The gel was
  maximum sensitivity (dark scan function); for detection                      imaged with Amersham Typhoon using normal scan speed. A selection of a
  of low abundance proteins we recommend the LAS500 or                         dilution series is shown in the image; the arrow indicates the limit of detection
  Amersham Imager 600                                                          (LOD). The detection limit was 5.6 pg, and the linear dynamic range (DR) was
                                                                               4.8 orders of magnitude.

Broad linear dynamic range
Amersham Typhoon scanners provide a broad linear dynamic                       Stages (Fig 4) give the correct positioning and stability for
range in all detection modes, for example when using Cy™5                      optimal imaging of a range of sample types. Samples that
labeled proteins (Fig 3).                                                      can be scanned include agarose and polyacrylamide gels,
                                                                               membranes, DIGE gels, microplates, culture dishes, glass slides,
Technical features                                                             and tissue sections. Also, radioisotope-labeled samples can
                                                                               be scanned using a phosphor imaging plate. The system can
Optimal choice of filter, stage, laser and PMT                                 simultaneously scan two DIGE gels, each measuring up to 21.5
Amersham Typhoon scanners can house up to 8 filters                            × 27.5 cm, with the multi-stage. The stages are easily removed
with automatic filter recognition. To attain optimal imaging                   from the system for cleaning.
conditions, you can easily access and exchange emission
filters without tools. This feature makes the instrument highly
suitable for use in a multiuser environment. In addition to
default high performance band-pass filters, there are 4 open
filter positions in which users can put IR-filters, long-pass
filters, or custom filters. This next generation of Typhoon
scanners feature easier handling of custom filters and a new
custom filter box for ease of use.

2     29229537AA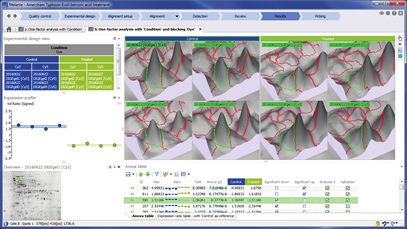
For the detection of radioactivity and fluorescence, emitted 8
light is collected and transformed to an electrical signal by 7
log (integrated intensity)
a photomultiplier tube (PMT). The electrical signal is then
6
converted into digital information by A/D conversion for image
5
display and analysis. Amersham Typhoon comes equipped
with new bi-alkali and multi-alkali PMTs. This combination 4
provides excellent detection over a very broad spectrum. Each 3
PMT is selected for optimal response to the detected emission 2
wavelength. The bi-alkali PMT is used for phosphorimaging, 1 2 3 4 5 6
log (pg phosphorylase B)
whereas the multialkali PMT is used for all fluorescence and
densitometry imaging modes.
Phosphorylase B
2.8 1.4 0.7 0.36 0.18 0.09 0.045 0.02 (ng)
Imaging applications
Sample Phosphorylase B in LMW marker
Gel Amersham WB 8-18% SDS-PAGE
Imaging Excitation Emission filter
488 nm Cy2 525BP20
LOD 22 pg
DR 4.2 orders of magnitude
Fig 4. (A)The IP stage, (B) Fluor stage, and (C) Multi stage are designed to Linearity R2=0.9989 and k=0.99
accommodate a variety of sample formats and imaging modes. (trendline in log-log plot)
Fig 5. Phosphorylase B was labeled with CyDye DIGE fluor Cy2 minimal dye
and separated using an Amersham WB electrophoresis gel. The gel was
Amersham Typhoon 5 and RGB enable users to image imaged with Amersham Typhoon using normal scan speed. A selection of a
fluorescent, radiolabeled, and colorimetrically stained gels dilution series is shown in the image; the arrow indicates the limit of detection
with a single system. (LOD). The detection limit was 22 pg, and the linear dynamic range (DR) was
4.2 orders of magnitude.
Fluorescence detection – visible and near-infrared
8
Upon excitation, light is emitted from a fluorescently labeled
sample in proportion to the amount of labeled protein or DNA 7
log (integrated intensity)
in the sample. The high sensitivity and broad dynamic range of 6
Amersham Typhoon 5 and RGB scanners (Figs 3, 5–9) makes 5
it possible to measure low and high abundant proteins in a
4
single scan.
3
Multiple fluorescent wavelengths can be detected with minimal
cross-talk for comparative expression experiments. See Table 2 2
for emission filters. 1 2 3 4 5 6
log (pg phosphorylase B)
Phosphorylase B
Table 2. Emission filters 2.8 1.4 0.7 0.36 0.18 0.09 0.045 0.02 (ng)
Filter* Wavelength range (nm) Detection examples
IP BP390 Phosphorimaging
Sample Phosphorylase B in LMW marker
Cy2 525BP20 515 to 535 Cy2, GFP Gel Amersham WB 8-18% SDS-PAGE
Imaging Excitation Emission filter
Cy3 570BP20 560 to 580 Cy3 532 nm Cy3 570BP20
Cy5 670BP30 655 to 685 Cy5 LOD 22 pg
DR 4.2 orders of magnitude
ECL Plex Cy5 Linearity R2=0.9998 and k=1.02
(trendline in log-log plot)
IRshort 720BP20 710 to 730 Alexa Fluor 700,
Cy5.5, IRDye™ 680 Fig 6. Phosphorylase B was labeled with CyDye DIGE fluor Cy3 minimal dye
and separated using an Amersham WB electrophoresis gel. The gel was
IRlong 825BP30 810 to 840 Alexa Fluor 790, IRDye
imaged with Amersham Typhoon using normal scan speed. A selection of a
800
dilution series is shown in the image; the arrow indicates the limit of detection
* Long pass filters LPB515, LPG550 and LPR660 are available as optional filters. (LOD). The detection limit was 22 pg, and the linear dynamic range (DR) was
4.2 orders of magnitude.
29229537AA 3
8
Phosphorylase B
7
log (integrated intensity)
1.2 0.58 0.29 0.15 0.073 0.045 0.018 0.009 0.005 (µg)
6
5 Sample Phosphorylase B in LMW marker
Gel ExcelGel™ SDS Gradient 8-18 (GE)
4 Imaging Excitation Emission filter
488 nm Cy3 LPG
3 LOD 5 ng
DR 2.4 orders of magnitude
2 Linearity R2=0.989
0 1 2 3 4 5 6 Fig 9. A mixture of proteins (LMW Marker, GE Healthcare) was separated by
log (pg antibody) SDS-PAGE followed by staining with SYPRO™ Ruby Protein Gel Stain. The gel
was imaged with Amersham Typhoon using normal scan speed. A selection of
a dilution series of Phosphorylase B is shown in the image; the arrow indicates
Antibody heavy chain the limit of detection (LOD). The detection limit was 5 ng, and the linear
386 192 96 48 24 12 6 3 (pg) dynamic range (DR) was 2.4 orders of magnitude.
Sensitive multiplex detection of Western blots
Sample IRDye® 680 goat anti-rabbit antibody The versatile Amersham Typhoon 5 and RGB scanners
Gel Amersham WB 13.5% SDS-PAGE are well suited for imaging of fluorescent Western blot
Imaging Excitation Emission filter
685 nm 720BP20 (IRshort)
membranes. This method is very sensitive, and the signal is
LOD 3 pg proportional to protein quantity. Moreover, it is possible to
DR 5.2 orders of magnitude
Linearity R2=0.9988 and k=1.00
detect more than one protein at the same time by means of
(trendline in log-log plot) secondary antibodies labeled with different fluorophores.
Fig 7. Antibody conjugated with IRDye 680 was separated using an Amersham Typhoon provides high sensitivity and a broad
Amersham WB electrophoresis gel. To reduce noise, the gel was imaged linear dynamic range, supporting its use for quantitative
with Amersham Typhoon using slow scan speed. A selection of a dilution Western blotting (Fig 10).
series is shown in the image; the arrow indicates the limit of detection
(LOD). The detection limit was 3 pg, and the linear dynamic range (DR) was
5.2 orders of magnitude
CHO cell lysate
8 10 5 2.5 1.25 0.63 (µg total protein)
log (integrated intensity)
7
6
5
4
3
2 Sample CHO cell lysate with transferrin
0 1 2 3 4 5 6 Membrane Amersham WB membrane card (PVDF)
Target proteins Transferrin and tubulin
log (pg antibody)
Detection Primary antibodies:
Rabbit anti-human transferrin, Mouse anti-Tubulin
Antibody heavy chain Secondary antibodies:
Amersham WB Cy5 GAR, IRDye 800 GAM
386 192 96 48 24 12 6 3 (pg) Imaging Excitation Emission filter
635 nm Cy5 670BP30
785 nm 825BP30 (IRlong)
LOD 0.63 µg
Fig 10. Multiplex detection of proteins by Western Blotting. Transferrin
Sample IRDye 800 goat anti - rabbit antibody and endogenous tubulin were targeted in a dilution series of CHO cell
Gel Amersham WB 13.5% SDS-PAGE
lysate using Amersham anti-rabbit Cy5 (red) and anti-mouse IR Dye 800
Imaging Excitation Emission filter
785 nm 825BP30 (IRlong) (green) secondary antibodies. Imaging was performed with Amersham
LOD 3 pg Typhoon scanner. The arrow indicates the limit of detection (LOD) for
DR 5.2 orders of magnitude tubulin. The low background enables reliable quantitation of specific
Linearity R2=0.9988 and k=1.00 signals relative to a housekeeping protein.
(trendline in log-log plot)
Fig 8. Antibody conjugated with IRDye 800 was separated using an
Amersham WB electrophoresis gel. To reduce noise, the gel was imaged
with Amersham Typhoon using slow scan speed. A selection of a dilution
series is shown in the image; the arrow indicates the limit of detection
(LOD). The detection limit was 3 pg, and the linear dynamic range (DR) was
5.2 orders of magnitude.
4 29229537AA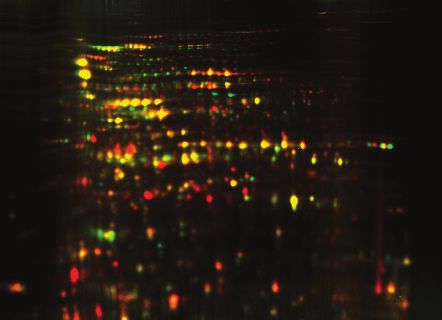
2-D DIGE
Amersham Typhoon scanners are designed for use with
analysis software such as Melanie™ 8 (Figs 11–13). The
strengths of these imaging systems—high sensitivity and
broad dynamic range for measuring low and high abundant
proteins in one scan—make them highly suited for 2-D
DIGE applications, enabling you to detect and accurately
quantitate subtle changes in protein expression. By
generating overlaid, multichannel images for each gel with
minimal cross-talk, Typhoon 5 and Typhoon RGB exploit
the multiplexing potential of CyDye DIGE fluors to remove
experimental variation between gels. When images are                          Fig 12. Example of a DIGE experiment analyzed with Melanie 8 (version
analyzed using high-quality software such as Melanie 8, you                   8.0.1) software. The effect of benzoic acid treatment on the Escherichia
will be able to accurately and confidently measure very small                 coli proteome was examined. Four replicates each were prepared for the
                                                                              control (blue) and benzoic acid-treated (green) samples, for a total of 8
differences in protein abundance.                                             different samples run on 4 gels. A pooled internal standard was included as
                                                                              a third sample on each gel. The experimental design view (top left) indicates
                                                                              that dye was used as a blocking factor in the statistical analysis. The dye-
                                                                              corrected estimates of the ANOVA p-values further improve the ability to
                                                                              detect subtle but true differences in protein expression, even for overlapping
                                                                              spots. This is shown by the 3-D views of the illustrated protein spot and the
                                                                              corresponding Expression profile (middle left).

                                                                              Control                                Benzoic acid-treated

 Sample         1 - Cell lysate of E-coli
                2 - Cell lysate of E-coli treated with benzoic acid
 IPG strips     3-10 NL, 24 cm                                                Fig 13. Representative Control (blue) and Treated (green) gel images of
 Gel            Precast low-fluorescent DIGE gel                              the experiment described in Fig 11 and Fig 12. Spots that are significantly
 Imaging        Excitation          Emission filter
                488 nm              Cy2 525BP20
                                                                              upregulated (p values < 0.001) in the Treated group are shown in red;
                532 nm              Cy3 570BP20                               downregulated spots are shown in green.
                635 nm              Cy5 670BP30

Fig 11. Overlay image of a two-dimensional difference gel electrophoresis
(2-D DIGE) gel with control and treated samples, and internal standard. The   Detection of radioactivity
control and treated samples were labeled with Cy3 and Cy5 DIGE Fluors
minimal dye labeling protocol). The internal standard sample was labeled      To detect radioactive signals using phosphor imaging, samples
with Cy2 DIGE Fluor. The data sets were evaluated using the Melanie™ 8        containing radioactive probes are exposed to a storage
(ver 8.0.1), see Fig 12 and 13).                                              phosphor screen (imaging plate). Light is emitted from the
                                                                              screen in proportion to the amount of radioactivity in the
                                                                              sample upon laser-induced stimulation (Figs 14 and 15). All
                                                                              storage phosphor screens from GE are compatible with the
                                                                              Amersham Typhoon scanners.

                                                                                                                                         29229537AA         5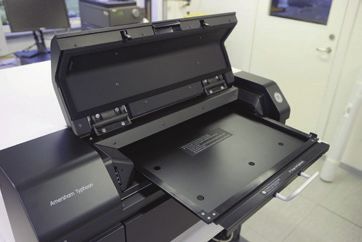
5
Carbonic anhydrase
4
log (signal intensity)
1.4 0.72 0.36 0.18 0.09 0.045 0.02 (µg)
3
2
Sample Carbonnic anhydrase in LMW marker
1
Gel Tris Glycine 8-16% SDS-PAGE (Novex)
0 Imaging mode Optical density
Imaging Excitation Emission filter
-1 532 nm Cy3 570BP20
LOD 23 ng
-2 DR 1.8 orders of magnitude
0 1 2 3 4 5 6 7 Linearity R2=0.988
log (nCi/g)
59.3 50.9 41.3 31.0 20.7 10.1 5.18 nCi/g
Fig 16. A mixture of proteins (LMW Marker, GE Healthcare) was separated
by SDS-PAGE followed by staining with Coomassie Brilliant Blue (G-350).
The gel was imaged with Amersham Typhoon in optical density mode. A
selection of a dilution series of Carbonic anhydrase is shown in the image;
the arrow indicates the limit of detection (LOD). The detection limit was
Sample 14
C autoradiographic standard (CFQ12000)
23 ng and the linear dynamic range (DR) was 1.8 orders of magnitude.
3 hour exposure to BAS-SR Imaging Plate
Imaging Excitation Emission filter
532 nm IP BP390
LOD 0.00518 µCi/g
DR 5.3 orders of magnitude
Linearity R2=0.9998 and k=1.03
(trendline in log-log plot)
File formats
Fig 14. Scanned image of a 14C autoradiographic standard using Amersham Data are stored either in linear 16-bit grayscale (.TIF file
Typhoon. A selection of the standard is shown in the image; the arrow format), in square root encoded 16-bit (.GEL file format),
indicates the limit of detection (LOD). The linear dynamic range (DR) was or log encoded 16-bit (.IMG file format). The .GEL and
hosphor 5.3 orders of magnitude .IMG formats provide the highest dynamic resolution for
maging
fluorescence and phosphor imaging.
Image analysis
Designed for seamless data transfer and quantitative gel and
blot analysis, GE provides image analysis software for use
with Amersham Typhoon (Table 3).
Table 3. Image analysis software
Software Analysis
ImageQuant ™
1-D gel electrophoresis, dot blots, arrays,
Fig 15. Autoradiography images of rat injected with 14C glucose. The magnified colony counting, and user-defined gel analysis
area shows part of the spine.
Fig. X. Autoradiography images of rat injected with 14-C glucose. Melanie 8 2D* 2-D gels, including single stain and 2-D DIGE
The zoom-in show part of the spine.
* Contact your GE representative for more information
Densitometry See tutorial regarding confidentiality
disclosures. Delete if not needed. 11
Validation support
When using Amersham Typhoon 5 and RGB, excitation light A comprehensive suite of life cycle validation services is
passes through the sample and excites a fluorescent plate. available for laboratory systems used in good practice
The emitted light from the plate passes through the sample environments, such as GLP, GMP, or GCP. The documentation
again and is collected and converted to an electrical signal. is developed and approved by validation experts. Installation
The method is suitable for documentation of colorimetrically Qualification and Operation Qualification (IQ/OQ) are
stained gels (Fig 16). The Amersham Typhoon scanners also performed on-site by trained service engineers. Our engineers
have optical density measurements for quantitation purposes. can also help with periodic re-qualification (RQ) and evaluate,
verify, and document system changes and software upgrades
with Change Control Protocols (CCP).
6 29229537AA
Product specifications
                                                      Amersham Typhoon 5                         Amersham Typhoon RGB                      Amersham Typhoon IP
Detection modes:                                      Fluorescence, phosphor                     Fluorescence, phosphor                    Phosphor imaging
                                                      imaging, densitometry, and                 imaging, densitometry, and
                                                      chemiluminescence (Dark scan)              chemiluminescence (Dark scan)
Laser excitation                                      LD488, SHG532, LD635, LD685,               LD488, SHG532, LD635                      LD635
wavelengths                                           LD785
Optional excitation                                                                              LD685, LD785                              LD488, SHG532, LD685, LD785
wavelengths:
Radioisotopes:                                        3
                                                       H, 11C, 14C, 125I, 18F, 32P, 33P, 35S,    3
                                                                                                  H, 11C, 14C, 125I, 18F, 32P, 33P, 35S,   3
                                                                                                                                            H, 11C, 14C, 125I, 18F, 32P, 33P, 35S,
                                                      99m
                                                         Tc, and other sources of                99m
                                                                                                    Tc, and other sources of               99m
                                                                                                                                              Tc, and other sources of
                                                      ionizing radiation                         ionizing radiation                        ionizing radiation
Measurable dynamic range:                             > 5 orders of magnitude                    > 5 orders of magnitude                   > 5 orders of magnitude
Bit depth:                                            16-bit                                     16-bit                                    16-bit
Scanning area:                                        40 × 46 cm                                 40 × 46 cm                                35 x 43 cm
Pixel sizes:                                          10, 25, 50, 100, 200 μm, and               10, 25, 50, 100, 200 μm, and              10, 25, 50, 100, and 200 μm
                                                      prescan 1000 μm                            prescan 1000 μm
Standard filters:                                     IP 390BP, Cy2 525BP20, Cy3                 IP 390BP, Cy2 525BP20, Cy3                IP 390BP
                                                      570BP20, Cy5 670BP30, IRshort              570BP20, Cy5 670BP30
                                                      720BP20, IRlong 825BP30
Optional filters:                                     Cy2 LPB515, Cy3 LPG550, Cy5                Cy2 LPB515, Cy3 LPG550, Cy5               Cy2 LPB515, Cy3 LPG550, Cy5
                                                      LPR660                                     LPR660                                    LPR660
Sample stages:                                        Fluor Stage, Multi Stage, and IP           Fluor Stage, Multi Stage, and IP          IP Stage
                                                      Stage                                      Stage
Dimensions (W × H × D):                               900 × 400 × 800 mm                         900 × 400 × 800 mm                        900 × 400 × 800 mm
Weight:                                               94 kg                                      93 kg                                     92 kg
Line frequency:                                       50/60 Hz                                   50/60 Hz                                  50/60 Hz
Temperature:                                          18°C to 28°C                               18°C to 28°C                              18°C to 28°C
Humidity:                                             20% to 70% (no condensation)               20% to 70% (no condensation)              20% to 70% (no condensation)
Supply voltage:                                       100 - 240 VAC ± 10%                        100 - 240 VAC ± 10%                       100 - 240 VAC ± 10%
Power consumption:                                    Approx. 0.3 kVA                            Approx. 0.3 kVA                           Approx. 0.3 kVA

Ordering information
System                                                    Quantity              Product code
Amersham Typhoon 5                                                 1               29187191
Amersham Typhoon RGB                                               1               29187193
Amersham Typhoon IP                                                1               29187194
One license of ImageQuant TL software is provided with each model of Amersham Typhoon
scanners.

Optional accessories                                      Quantity              Product code
Amersham Eraser                                                    1               29187190
Accessory Cabinet AmTyphoon                                        1               29191637
SlideGlass holder Amersham Typhoon                                 1               29191521
33 × 42 glass plate guide                                          1               29215514
Amersham Typhoon
Custom filter boxes                                                1               29191540
Amersham Typhoon
Information on upgrade kits for additional lasers, filters, and other items can be obtained by
contacting Customer Support.

                                                                                                                                                                    29229537AA       7
Phosphor screen (Imaging plate) Quantity Product code Minimum computer requirement
BAS-IP MS 2040 E 1 28956474 OS Windows® 7 Professional (64-bit)
Phosphorimaging plate, 20 × 40 cm, Windows 8.1 Pro (64-bit)
multipurpose Windows 10 Pro (64-bit)
BAS-IP MS 2025 E 1 28956475 Internal memory 8 GB
Phosphorimaging plate, 20 × 25 cm,
Processor Intel® Core i5 processor
multipurpose
Hard disk 80 GB
BAS-IP MS 3543 E 1 28956476
Phosphorimaging plate, 35 × 43 cm, USB ports USB 2.0
multipurpose
Optical drive DVD-ROM Drive
BAS-IP SR 2040 E 1 28956477 Please contact your local sales representative for the latest recommended computer configuration
Phosphorimaging plate, 20 × 40 cm,
high resolution
BAS-IP SR 2025 E 1 28956478
Phosphorimaging plate, 20 × 25 cm,
high resolution
BAS-IP TR 2040 E 1 28956481
Phosphorimaging plate, 20 × 40 cm,
for Tritium detection
BAS-IP TR 2025 E 1 28956482
Phosphorimaging plate, 20 × 25 cm,
for Tritium detection
BAS-IP ND 2040 E 1 29017133
Phosphorimaging plate, 20 × 40 cm,
for Neutron detection
BAS-IP ND 2025 E 1 29017139
Phosphorimaging plate, 20 × 25 cm,
for Neutron detection
Exposure Cassette 1 63003544
Unmounted Screen, 20 × 25 cm
Exposure Cassette 1 63003545
Unmounted Screen, 35 × 43 cm
The different screens are designed for general use (MS), high resolution suitable for morphological
work such as autoradiography (SR), detection of the weak energy of the Tritium signal (TR), and
detection of Neutron (ND).
Discontinued mounted and unmounted GP phosphor screens are compatible with Amersham
Typhoon. These products can be scanned with a Fluor stage (unmounted) and Multi stage (mounted).
The Fluor stage and Multi stage are optional accessories for Amersham Typhoon IP.
www.gelifesciences.com
GE, GE monogram, Amersham, Cy, CyDye, ECL Plex, ExcelGel, ImageQuant, and Typhoon are trademarks of General Electric Company.
Alexa Fluor and SYPRO are trademarks of Life Technologies Corporation. Coomassie is a trademark of Thermo Fisher Scientific LLC. Intel is a
trademark of Intel Corporation. IRDye is a trademark of LI-COR, Inc. Melanie is a trademark of SIB Swiss Institute of Bioinformatics. Windows
is a registered trademark of Microsoft Corporation. All other third-party trademarks are the property of their respective owner.
2-D DIGE: 2-D Fluorescence Difference Gel Electrophoresis (2-D DIGE) technology is covered by US patent number 6,127,134 and
equivalent patents and patent applications in other countries and exclusively licensed from Carnegie Mellon University.
The purchase of CyDye DIGE Fluors includes a limited license to use the CyDye DIGE Fluors for internal research and development, but not for
any commercial purposes. A license to use the CyDye DIGE Fluors for commercial purposes is subject to a separate license agreement with
GE Healthcare.
CyDye: The purchase of CyDye products includes a limited license to use the CyDye products for internal research and development
but not for any commercial purposes. A license to use the Cy and CyDye trademarks for commercial purposes is subject to a separate
license agreement with GE Healthcare. Commercial use shall include:
1. Sale, lease, license or other transfer of the material or any material derived or produced from it.
2. Sale, lease, license or other grant of rights to use this material or any material derived or produced from it.
3. Use of this material to perform services for a fee for third parties, including contract research and drug screening.
If you require a commercial license to use the Cy and CyDye trademarks please contact LSlicensing@ge.com .
© 2016 General Electric Company. First published Sep. 2016.
All goods and services are sold subject to the terms and conditions of sale of the company within GE Healthcare which supplies them.
A copy of these terms and conditions is available on request. Contact your local GE Healthcare representative for the most current information.
GE Healthcare Bio-Sciences AB, Björkgatan 30, 751 84 Uppsala, Sweden
GE Healthcare UK Ltd., Amersham Place, Little Chalfont, Buckinghamshire, HP7 9NA, UK
GE Healthcare Europe GmbH, Munzinger Strasse 5, D-79111 Freiburg, Germany
GE Healthcare Bio-Sciences Corp. GE Healthcare Dharmacon Inc., 2650 Crescent Dr, Lafayette, CO 80026, USA
HyClone Laboratories Inc., 925 W 1800 S, Logan, UT 84321, USA
100 Results Way GE Healthcare Japan Corp., Sanken Bldg., 3-25-1, Hyakunincho Shinjuku-ku, Tokyo 169-0073, Japan
Marlborough, MA 01752 For local office contact information, visit www.gelifesciences.com/contact
USA 29229537AA 09/2016You can also read