AIR QUALITY TREND ANALYSIS - Minnesota GO
←
→
Page content transcription
If your browser does not render page correctly, please read the page content below
AIR QUALITY TREND ANALYSIS
CONTENTS
Air Quality Trend Analysis ....................................................................................................................... 1
   Contents ........................................................................................................................................... 2
   Summary .......................................................................................................................................... 3
   Air Pollution ...................................................................................................................................... 3
     Measurement................................................................................................................................. 4
     Achieving Attainment in Minnesota................................................................................................... 5
     Air Quality Today ............................................................................................................................ 5
   Vehicle Impacts ................................................................................................................................. 6
     Diesel Engines ................................................................................................................................ 7
   Health Impacts .................................................................................................................................. 8
   Environmental Justice....................................................................................................................... 10
   Air Quality Improvements and Future Trends ....................................................................................... 11
     Travel Behavior and Roadway Design Trends..................................................................................... 12
     Cleaner Vehicle Technology Advancement........................................................................................ 14
   Conclusion ...................................................................................................................................... 16
   Related Trends ................................................................................................................................ 16
   Revision History ............................................................................................................................... 17

                                                                                Air Quality Trend Analysis                                             2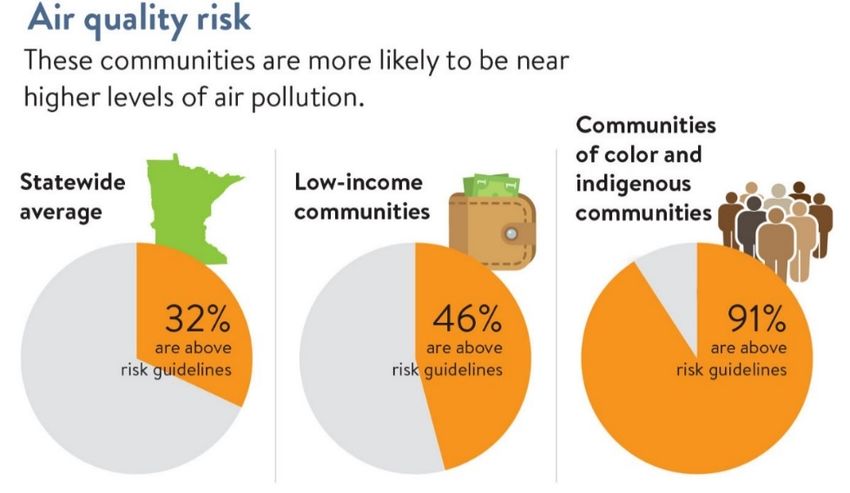
SUMMARY
The air we breathe affects our health and the health of our communities. Ambient air quality, meaning the levels
of pollutants contained in the air, has steadily improved since the 1970s due in large part to regulations
established under the federal Clean Air Act. However, air pollution at low or moderate levels can still negatively
impact the health of Minnesotans today. Fine particles and other toxins from industrial activity and transportation
can negatively affect human health at any level. Air pollution is estimated to be a major contributor to 3,200 to
6,400 deaths a year in Minnesota and more than 7 million deaths a year worldwide.
Generally, air quality levels are found to be the worst in areas where black, indigenous and people of color or
those with low incomes are more likely to live. Accordingly, air pollution adds to the disparate impacts already
present on these communities from our transportation system and economy. However, these effects are not just
felt by those communities in urban areas where air pollution is more concentrated. Rural areas of Minnesota also
see high rates of deaths caused by to air pollution.
Since 1997, total emissions of air pollution have dropped almost 50% while the economy has continued to grow. 1
This decrease in emissions has come from every segment of the economy. Today the transportation sector is the
third leading source of air pollution accounting for one fifth of all emissions. Pollutants from motor vehicles have
decreased due to regulations and better engine technology. However, this decrease in pollution has not been as
robust or consistent as other sectors of the economy.
Air quality has improved most notably from technology advances, increased emission regulations and to a lesser
extent, changes in travel behavior in urban areas. A new diesel engine sold today produces 97% less air pollutant
emissions than a similar older (pre-2006) vehicle. Personal vehicles sold in 2019 are more efficient, getting 32%
higher gas mileage on average than a vehicle sold in 2004. 2 To reduce travel by single occupant vehicles and
improve air quality through reduced vehicle miles travelled, cities, counties and MnDOT are investing in
infrastructure for people walking, bicycling, rolling and taking transit.

AIR POLLUTION
Air is monitored for six criteria pollutants through the National Ambient Air Quality Standards: particulate matter
(PM2.5 and PM10), ground-level ozone, carbon monoxide, sulfur dioxide, nitrogen dioxide and lead. 3 These
pollutants are monitored throughout the state to measure compliance with federal and state ambient air quality
standards. State and federal agencies also work in other ways to improve air quality, because some pollutants can
cause health concerns at levels below the standards. Some communities are particularly at risk related to higher
levels of air pollution because of their proximity and exposure to poor air quality. Efforts to reduce ozone and
fine-particle pollution are important in Minnesota because the levels of these pollutants in the state are near
permitted national standards for air quality. These two pollutants have been linked to health concerns, especially
for children, people over age 65 and people with underlying health conditions. Along with agriculture and

1
  Minnesota Pollution Control Agency, The Air we Breathe: The State of Minnesota’s Air Quality, Amanda Jarrett Smith, Ralph Pribble, Fawkes Steinwand.
Saint Paul, Minnesota: Minnesota Pollution Control Agency, 2019. https://www.pca.state.mn.us/sites/default/files/lraq-1sy19.pdf.
2
  “The 2019 EPA Automotive Trends Report,” Environmental Protection Agency (Environmental Protection Agency, March 2020),
https://nepis.epa.gov/Exe/ZyPDF.cgi?Dockey=P100YVFS.pdf.
3
  “NAAQS Table.” Criteria Air Pollutants. Environmental Protection Agency, 2016. https://www.epa.gov/criteria-air-pollutants/naaqs-table.

                                                                                 Air Quality Trend Analysis                                              3
construction, decisions and practices in the transportation industry play a role in minimizing these impacts on our
communities and the environment.
MEASUREMENT
The Air Quality Index (AQI) is a measure developed by the United States Environmental Protection Agency (EPA)
for reporting daily air quality conditions to the public. There are four categories: good, moderate, unhealthy for
sensitive groups and unhealthy. The Minnesota Pollution Control Agency (MPCA) uses this index to report air
quality at 30 stations across the state based on concentrations of four pollutants: particulate matter, ozone, sulfur
dioxide and carbon monoxide.
Measurements of the AQI index have shown a trend of improving air quality in Minnesota in recent years. In 2019
there were 240 days where air quality was considered good across the state compared to 154 in 2009 (Figure 1).
In 2019, there were four days where air quality was considered unhealthy compared to nine in 2009 (Figure 2).
These figures are part of an encouraging trend for the state and at-risk populations are on average experiencing
nearly 100 more good air quality days now than a decade ago. Improved emission standards and other
regulations for vehicles, engines and fuels combined with continued technological improvements have led to
decreased levels of air pollution in the state overall. This improvement is spite of the fact that vehicle miles
driven, industrial activity and population has continued to increase in Minnesota.
Days with unhealthy air quality are becoming rarer in recent years, but the causes of these unhealthy days
continue to change as well. Poor air quality days are now due to increased fire activity in the Western United
States and Canada. This trend could continue to worsen over time as forest fires become more numerous due to
changing climatic conditions on the continent.
Figure 1: Number of g ood air quality days in Minnesota, 2009-2019 (ozone and fine particles) 4
276
251
236 240
209 215
204
175 177
163
154
2009 2010 2011 2012 2013 2014 2015 2016 2017 2018 2019
4
“Annual AQI Summary Reports.” Minnesota Pollution Control Agency, June 29, 2018. https://www.pca.state.mn.us/air/annual-aqi-summary-reports.
Air Quality Trend Analysis 4Figure 2: Number of unhealthy air quality days in Minnesota, 2009-2019 (ozone and fine particles) 5
13
9 9 9
7 7
6
5
4
3
0
2009 2010 2011 2012 2013 2014 2015 2016 2017 2018 2019
ACHIEVING ATTAINMENT IN MINNESOTA
The EPA monitors air quality through the Ambient Air Monitoring Program. 6 Several areas in Minnesota failed to
meet air quality standards during the 1980s and 1990s. Since standards weren’t met, some areas in Minnesota
fell into a status called “non-attainment” and the state was required to demonstrate progress toward achieving
federal air quality requirements. The MPCA submitted an updated plan to get back into attainment and the state
went into a limited maintenance plan in 2009. New roadway monitors were installed in addition to other actions
to ensure the state is meeting federal requirements and stays on track to achieve attainment again. As of 2020,
the state is only in non-attainment status in Dakota County based on lead levels. 7 The state currently has a State
Implementation Plan to bring lead levels back within EPA requirements. Once attainment is achieved however,
the requirements do not expire. For the EPA to ensure that an area does not fall back into non-attainment status,
this area is identified as a “maintenance area” and any changes to pollution control measures must first be
approved by the EPA.
AIR QUALITY TODAY
The Federal Clean Air Act resulted in a large reduction of air pollution from factories and power plants but did not
lead to a large reduction in pollution from vehicles, small businesses, heating and cooling of buildings and
recreational equipment. Eighty percent of air pollution in Minnesota comes from these smaller sources. 8 Gas
stations, dry cleaners, auto body shops, construction and agricultural equipment, homes, vehicles and
recreational equipment can cause pollution nearest to where people live and work (Figure 3). These individual
sources may not cause much pollution on their own, but in total and when in close proximity, they can cause
many environmental and health concerns. While in 2017 on-road vehicles were still the third largest single source
of air emissions of four key air toxics, vehicles are seeing steady progress in limiting emissions.
5
MPCA. “Annual AQI Summary Reports.”
6
“Air Quality.” Air Quality Planning and Standards. Environmental Protection Agency, August 6, 2016. https://www3.epa.gov/airquality/cleanair.html.
7
“Current Nonattainment Counties for All Criteria Pollutants.” Green Book. Environmental Protection Agency, February 29, 2020.
https://www3.epa.gov/airquality/greenbook/ancl.html.
8 Minnesota Pollution Control Agency. “The Air We Breathe 2019”.
Air Quality Trend Analysis 5Figure 3: Sources of air pollution in Minnesota in 2019 (includes PM2.5, SO2, NOX, VOCs) 9
45%
20% 18% 17%
Point (industrial facilities, Non-Point (neighborhood On-Road Vehicles (cars, Off-Road Vehicles
factories, power plants, etc.) sources: dry cleaners, trucks, etc.) (construction, agriculture,
homes, backyard fires, etc.) yard equipment, etc.)
Minnesota’s air quality has generally been considered good for the last decade and has been steadily improving
with each year. As the COVID-19 pandemic has gripped the world in 2020, many major industrial centers and
cities around the world have seen dramatic air quality improvements. With cars and trucks off America’s
extensive road network, cities like Los Angeles and Washington D.C. are seeing the best air quality in decades.
Concentrations of nitrogen dioxide, a major pollutant from vehicles, has plummeted 25.5% in the Northeast
United States. 10 In Minnesota, the change has been less pronounced, due in part to the air quality in the state
already being generally good and the variable role weather patterns have in air quality. Particulate matter (PM2.5 )
has mostly been unchanged at monitoring sites in the state and nitrogen oxide (NO2 ) has seen modest declines
near roadways in the seven-county metro area metro.
VEHICLE IMPACTS
Vehicles, construction and agricultural equipment now emit as much air pollution in Minnesota as all factories
and power plants combined. 11 Federal regulations on fuel efficiency and emissions have reduced air pollution
from new vehicles, especially in diesel vehicles. Air pollution reduced significantly over recent decades while fuel
efficiency improved for both cars and trucks, but the growth in vehicle usage has kept the transportation sector at
the top of total emissions. However, the trend towards improved vehicle efficiency and reduced pollution is
forecasted to continue. 12 Despite these improvements, vehicles are a key driver of air pollution in Minnesota and
will continue to be a large contributor to poor health. Much of these improvements made over the previous
decades are in danger of being setback by new federal policies. In response to the COVID-19 pandemic, the
Trump Administration announced emission and fuel efficiency rules on new automobiles would be reduced. On
March 31, 2020 the National Highway Traffic Safety Administration (NHTSA) and the EPA released the Safer
Affordable Fuel-Efficient Vehicles Rule that will lower the stringency of the corporate average fuel economy
9Statewide and County Air Emissions (Minnesota Pollution Control Agency, August 15, 2018), https://www.pca.state.mn.us/air/statewide-and-
county-air-emissions.
10
“Air pollution in the U.S. declines during the COVID-19 pandemic.” University of Minnesota July 10, 2020. https://twin-cities.umn.edu/news-events/air-
pollution-us-declines-during-covid-19-pandemic.
11MPCA. “The Air We Breathe 2019”.
12“Highlights of the Automotive Trends Report.” Automotive Trends Report. Environmental Protection Agency, March 2, 2020.
https://www.epa.gov/automotive-trends/highlights-automotive-trends-report.
Air Quality Trend Analysis 6(CAFE) standards and carbon dioxide emissions standards from 2021 through 2026. This rollback of regulations
could lead to an increase in ambient air pollution and greenhouse gas emissions nationwide. 13
Vehicle type can have a big impact on the amount of air pollution each vehicle emits. Consumers’ preference for
heavier, less fuel-efficient vehicles like SUVs, trucks and crossovers increased in recent years and have also played
a role in offsetting the significant efficiency gains seen by improved vehicle technology. Trucks and SUVs continue
to increase in popularity with light trucks (includes SUVs) making up 70% of all new light duty vehicle 14 sales in
Minnesota in 2019. 15 In 2011, the number of SUVs, trucks and crossovers surpassed the number of cars on the
road in Minnesota. Today, these larger vehicles make up 57% of all passenger vehicles on the road and emit 70%
of the passenger-vehicle related pollution. 16
DIESEL ENGINES
Diesel engines power equipment essential to food production, construction and the supply chain. Diesel accounts
for more than half of the harmful particulate matter emissions from vehicles. According to the EPA, diesel
emissions contain 40 toxic chemicals including 15 carcinogens (chemical compounds known to increase human’s
risk of cancer). Diesel vehicles also last 20 years or more and may drive up to a million miles. Fuel efficiency for
large diesel trucks has improved greatly over recent years. A new diesel truck can produce 97% less fine
particulate matter than a similar older truck. 17 Regardless, there are still health risks for people living near areas
with heavy diesel exhaust. In 2012, the World Health Organization linked diesel particles with lung cancer. The
MPCA found that risk is greater near urban areas and highways where there is a higher concentration of vehicles,
construction equipment, boilers and generators. Diesel exhaust has disparate impacts on some Minnesota
communities as discussed in the Environmental Justice section below.
In 2015, the EPA found that Volkswagen was intentionally cheating standards on emissions from its diesel
engines. In the U.S., 590,000 Volkswagen vehicles were emitting harmful pollutants at levels 40 times higher than
the permitted level. 18 The State of Minnesota received $47 million of the $15 billion settlement. This money is
being used to fund grant programs in the state which replace older diesel vehicles with new, cleaner models and
to invest in electric vehicle infrastructure. The MPCA created a three-phase plan to invest the money and is
currently on Phase Two, which is distributing $23.5 million from 2020 to 2023 in six grant programs eligible to
both public and private organizations. 19
13
Eby, Brianne. “DOT and EPA Roll Back Obama-Era Automobile Fuel Efficiency Standards.” The Eno Center for Transportation, April 3, 2020.
https://www.enotrans.org/article/dot-and-epa-roll-back-obama-era-automobile-fuel-efficiency-standards/.
14
Light duty vehicles are defined as all passenger vehicles below 8,500 pounds of gross vehicle weight.
15
“Annual Financial Profile of America’s Franchised New-Car Dealerships 2019.” National Automobile Dealerships Association, 2019.
16 MPCA. “The Air We Breathe 2019”.
17 Ibid.
18
“Volkswagen Clean Air Act Civil Settlement.” Enforcement. Environmental Protection Agency, October 31, 2019.
https://www.epa.gov/enforcement/volkswagen-clean-air-act-civil-settlement.
19
“Minnesota’s Plan for Volkswagen Settlement Funds Phase 2 (2020-2023).” Minnesota Pollution Control Agency, February 2020.
https://www.pca.state.mn.us/sites/default/files/aq-mvp2-36.pdf.
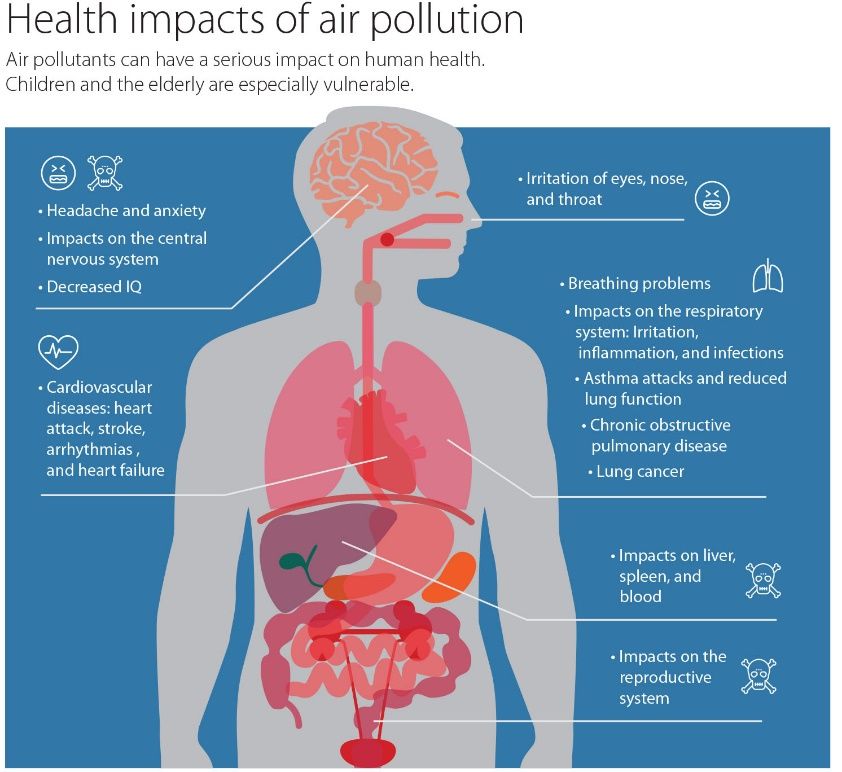
Air Quality Trend Analysis 7HEALTH IMPACTS
The amount and type of air pollution people are exposed to determine the extent of health impacts. Ambient air
polluted with fine particles and other toxics from industrial activity and transportation negatively effects humans
at any concentration level and air pollution is estimated to be a major contributor to over 7 million deaths a year
worldwide. 20 According to a report by the MPCA, fine particulate matter and increased ozone pollution has been
estimated to contribute to 3,200 to 6,400 premature deaths in Minnesota in 2013. 21 If air quality is poor enough,
it can have a negative impact on the cardiovascular and respiratory system, cause irritation or have other
potential toxic effects. Examples of these effects are detailed in Figure 5. Air pollution contributed to 5% to 10%
of all deaths and 1% to 5% of hospitalizations for heart and lung problems for Minnesotans in 2013. 22 While these
negative health outcomes are found in higher absolute numbers in urban areas, as seen in Table 1 and 2, the
rates of premature death and hospitalizations from both particulate matter and ozone pollution are higher in
rural counties than urban counties and the statewide average. 23 Air pollution impacts low income and
communities of color in greater numbers and higher concentrations than other communities in the state, but is a
health issue for all Minnesotans.
Table 1: Attributable early death rates due to particulate matter air pollution (ages 25 and over) in Minnesota by
Office of Rural Health Designation. 24
County Group Rate per Attributable rate Percent of
100,000 people per 100,000 people total events
Statewide 1,103.0 112.8 10.2%
Rural 1,524.5 134.1 8.8%
Micropolitan Area 1,428.7 134.8 9.4%
Metropolitan Area 1,155.7 109.7 9.5%
Twin Cities Metro 924.6 104.7 11.3%
20
“How Air Pollution Is Destroying Our Health.” Air Pollution. World Health Organization, 2020. https://www.who.int/airpollution/news-and-events/how-air-
pollution-is-destroying-our-health.
21
Bael, David, and Kathy Raleigh. “Life and Breath: How Air Pollution Affects Health in Minnesota.” Minnesota Pollution Control Agency, Minnesota
Department of Health, June 2019. https://www.pca.state.mn.us/sites/default/files/aq1-64.pdf.
22
MPCA. “Life and Breath”
23
Ibid.
24
Ibid.
Air Quality Trend Analysis 8Table 2: Attributable early death rates due to Ozone air pollution (all ages) in Minnesota by Office of Rural Health
Designation. 25
County Group Rate per Attributable rate Percent of total
100,000 people per 100,000 people events
Statewide 98.4 1.05 1.1%
Rural 158.5 1.66 1.0%
Micropolitan Area 139.8 1.57 1.1%
Metropolitan Area 103.2 1.01 1.0%
Twin Cities Metro 75.7 0.83 1.1%
Figure 4: MPCA report on health impacts of air pollution 26
Another major health risk of air pollution is from air toxics, which are air pollutants that cause or may cause
cancer or other serious health effects, or adverse environmental and ecological effects. There are more than 100
air pollutants that have been found to cause serious health effects including cancer, reproductive effects or birth
defects, or adverse environmental effects. 27 Since these pollutants aren’t federally regulated, the MPCA works to
ensure the levels of these pollutants are lower than health benchmarks.
25
Ibid.
26
Minnesota Pollution Control Agency, The Air we Breathe: The State of Minnesota’s Air Quality, Amanda Jarrett Smith, Cassie McMahon, Barbara Conti.
Saint Paul, Minnesota: Minnesota Pollution Control Agency, 2017. https://www.pca.state.mn.us/sites/default/files/lraq-1sy17.pdf.
27
“About Urban Air Toxics.” Urban Air Toxics. Environmental Protection Agency, February 9, 2017. https://www.epa.gov/urban-air-toxics/about-urban-air-
toxics.
Air Quality Trend Analysis 9As seen in Figure 4, air pollution is known to cause respiratory issues for humans. Air pollution has played a key
role in the COVID-19 pandemic as Sars-CoV-2, the coronavirus which causes COVID-19, attacks a person’s
respiratory system. A recent Harvard University study has found that long term exposure to common air
pollutants like fine particulate matter has a meaningful effect on health outcomes for COVID-19 patients. With
even a small increased and sustained exposure to PM 2.5, the death rate associated with COVID-19 was seen to
increase by 8%. 28 This study demonstrates that impacts of health outcomes from the pandemic are exacerbated
by local conditions such as increased levels of air pollution. The relationship between air pollution exposure and
COVID-19 health outcomes highlights how local conditions can worsen health disparities and social inequities. 29
ENVIRONMENTAL JUSTICE
Air pollution impacts those that live near its source the most. As seen in Figure 5, many communities of color and
people with lower income bear a disproportionate burden of traffic-related and general poor air quality health
impacts while contributing less to vehicle pollution. 30 Studies have found that while communities of color and
people with lower incomes tend to own fewer vehicles, drive less and use public transit more often than other
groups, they are exposed to higher levels of traffic-related pollution. This is due, in part, to the siting of the
nation’s transportation network, which was built to allow easier and quicker freeway access to and from the
urban core. In many of America’s cities, these routes tend to travel through lower income communities and
communities of color, the result of deliberate planning by federal and state transportation departments.
Examples of this practice can be found in nearly every major city in the nation. Locally, a notable example can be
found in the Rondo neighborhood of St. Paul, which today is bisected by Interstate 94 (I-94). Rondo was once the
bustling hub of African American life in St. Paul before the planning and construction of I-94. This event
precipitated a drop in the quality of life for the neighborhood by destroying hundreds of homes and businesses,
severing the community in half and burdening it with greatly decreased air quality due to the freeway below. 31
Like Rondo, the interstate network was largely built through communities of color and low-income populations
resulting in the removal or degradation of communities and persistent air pollution for those who live in these
neighborhoods. 32
28
“Exposure to air pollution and COVID-19 mortality in the United States.” Xiao Wu, Rachel C. Nethery, Benjamin M. Sabath, Danielle Braun, Francesca
Dominici. medRxiv 2020.04.05.20054502; doi: https://doi.org/10.1101/2020.04.05.20054502.
29
COVID-19’s Unequal Effects in Massachusetts.” Office of the Massachusetts Attorney General, June 5, 2020. https://www.mass.gov/doc/covid-19s-
unequal-effects-in-massachusetts/download.
30 MPCA. “The Air We Breathe 2019”.
31
“Interstate 94: A History and Its Impact.” Minnesota Department of Transportation, Twin Cities Public Television. April 1, 2017.
https://www.tpt.org/interstate-94-a-history-and-its-impact.
32Pratt, Gregory C., et al. "Traffic, air pollution, minority and socio-economic status: addressing inequities in exposure and risk." International
journal of environmental research and public health 12.5 (2015): 5355-5372.
Air Quality Trend Analysis 10Figure 5: MPCA statistics on likelihood of a community’s risk to air pollution. 33
A 2019 study released by the MPCA, and seen in Figure 5, showed negative health risks due to pollution are
closely tied to a community’s ethnic, racial or income status. While this study was focused at the county level and
did not account for more in-depth differences at the neighborhood or community level, the disparity of air
pollution impacts between races can still clearly be seen. At 11.3% of deaths attributable to air pollutants
commonly emitted from motor vehicles, counties with populations of 20% or more people of color saw a higher
percentage of deaths than the state as a whole (10.2%) and even more than counties with populations of 10% or
less people of color (9.4%). 34
MnDOT has been working to rectify past actions when designing and constructing roadway projects. MnDOT
conducts environmental justice analysis of all its programed projects annually to ensure projects do not have a
disproportionate burden on communities of color or low-income populations. MnDOT and other state agencies
continue to work on and improve policies and practices around environmental justice as part of a statewide effort
to reduce racial and ethnic health and income inequality. MnDOT, through the Advancing Transportation Equity
Initiative, is exploring ways to consider benefits and burdens beyond what is expected through environmental
justice considerations.
AIR QUALITY IMPROVEMENTS AND FUTURE TRENDS
While air quality is still unhealthy at times, overall air quality in the United States has improved dramatically since
the 1970s and is expected to continue to do so in the future. Some of that trend is due to what was described
previously; technology is quickly improving to produce cleaner vehicles which emit less pollutants and use fossil
fuels more efficiently. Additionally, fully electrified vehicles, such as urban rail systems, electric busses and electric
personal vehicles, which create little to no source emissions, are becoming more common. Other sectors of the
economy are transforming to better air quality as well, Minnesota’s largest power producer, Xcel Energy, has
33
MPCA. “The Air We Breathe 2019”.
34
Bael, David, and Kathy Raleigh. “Life and Breathe: How Air Pollution Affects Health in Minnesota.” Publication. Life and Breathe: How Air Pollution Affects
Health in Minnesota. Minnesota Department of Health and Minnesota Pollution Control Agency, 2019. https://www.pca.state.mn.us/sites/default/files/aq1-
64.pdf.
Air Quality Trend Analysis 11committed to eliminating all coal fired power plants by 2030 and to producing 100% carbon-free electricity by
2050. 35 These actions and technological trends are having real effects on the air quality in Minnesota, as seen in
figures 1 and 2, which show steadily improving air quality over the previous decade. However, recent trends
related to climate change, such as an increase in wildfire activity, have shown this air quality improvement could
be reversed by natural phenomena.
TRAVEL BEHAVIOR AND ROADWAY DESIGN TRENDS
For the transportation sector, travel behavior and street design changes are providing a different approach to
improving air quality. In certain communities, transit is an efficient way to move high volumes of people while also
reducing emissions, particularly when transit providers use electrified vehicles. However, transit agencies across
the county have seen a recent trend of stagnating or dropping ridership numbers, but certain modes like rail have
continued to see growth year over year despite the overall decline in transit trips. By 2017, fixed guideway transit
(rail) accounted for 50% of all transit trips in the US, an achievement not seen since 1946, when many streetcar
systems were being removed across the nation (figure 6). 36
Increased usage of electrified trains, like subways, light rail and streetcars, produce significantly less air emissions
per trip than on-road transportation like buses, ride shares and personal vehicles. 37 It is not only tailpipe
emissions from on-road vehicles which contribute to air emissions. Vehicle brake, tire and road deterioration and
kicked up road dust all contribute particulate matter into the air on and near roadways. Model predictions
conducted with the California Air Resource Board suggest that these non-exhaust emissions could become the
dominant source of PM2.5 and PM10 emissions as vehicle technology improves. 38 Other studies have indicated
that riders of rail based vehicles inhale less particulate matter while in transit than riders of buses or those
walking within a city. 39 These studies show that an increased share of trips being taken on rail help to reduce
ambient levels of and better protect riders from the inhalation of, many air toxics emitted from the transportation
sector.
35
“Xcel Energy to End All Coal Use in the Upper Midwest.” Xcel Energy New Releases. Xcel Energy, May 20, 2019.
https://www.xcelenergy.com/company/media_room/news_releases/xcel_energy_to_end_all_coal_use_in_the_ upper_midwest.
36
“2020 Public Transportation Fact Book.” Research Reports. American Public Transportation Association, March 2020. https://www.apta.com/wp-
content/uploads/APTA-2020-Fact-Book.pdf.
37
Puchalsky, Christopher. (2005). Comparison of Emissions from Light Rail Transit and Bus Rapid Transit. Transportation Research Record. 1927. 31-37.
10.3141/1927-04.
38
“California Air Resources Board,” Brake & Tire Wear Emissions (California Air Resource Board, 2020), https://ww2.arb.ca.gov/resources/documents/brake-
tire-wear-emissions.
39
Teresa Moreno et al., “Urban Air Quality Comparison for Bus, Tram, Subway and Pedestrian Commutes in Barcelona,” Environmental Research 142 (2015):
pp. 495-510, https://doi.org/10.1016/j.envres.2015.07.022.
Michael Chertok et al. “Comparison of air pollution exposure for five commuting modes in Sydney - car, train, bus, bicycle and walking.” Health promotion
journal of Australia: official journal of Australian Association of Health Promotion Professionals. (2004). https://doi.org/10.1016/j.atmosenv.2013.04.028.
Air Quality Trend Analysis 12Figure 6: Percent share of all transit passenger trips taken on roadway transit (bus, vanpool, demand response)
and fixed guideway transit (all rail) from 1920 to 2018. 40
100.0%
80.0%
60.0%
40.0%
20.0%
0.0%
Roadway Transit Fixed Guideway Transit
The trend of declining overall transit usage, but increased use of rail and other higher service quality transit is also
playing out in Minnesota. While overall ridership in the seven-county metro area has declined from a peak in
2015, this drop in ridership is almost entirely from local bus service. In 2019, 91.5 million trips were completed,
with light rail and bus rapid transit (BRT) continuing strong year over year ridership gains. 41 In Greater Minnesota,
transit usage has continued to grow with demand projected to increase from 15.1 million trips in 2017 to 20.1
million trips by 2030. 42
MnDOT and local agencies are also reconstructing roadways differently to address congestion at the project level.
While overall congestion is rising regionally in the seven-county metro area due to continued population growth
and increased driving, congestion and vehicle idling is being improved at the project level through the design of
new or reconstructed roadways. For example, newly constructed or reconstructed roadways include
roundabouts, improved signal timing, strategic passing lanes and other improvements to help with traffic flow,
thereby reducing idling. MnDOT’s complete streets policy, adopted in 2013, helps ensure that modes other than
motorized vehicles are included by default in the design of new roadway projects. Bicycle and pedestrian facilities
are built to accommodate active transportation for diverse populations in rural and urban areas and promote
more active transportation in Minnesota communities and reduce unnecessary vehicle trips.
Minnesota roads now have 75.5 miles of managed lanes either under construction or in operation today.
Managed lanes incentivize transit use and carpooling by allowing these road users free access to lanes that are
less congested and charging drivers of single-occupancy vehicles for access to these lanes. For more on managed
lanes, see the Dynamic Road Pricing trend. If all envisioned managed lanes from the Metropolitan Council’s 2040
Transportation Policy Plan were constructed, the managed lane system would stretch 321 miles on the seven-
county metro area most congested freeways. Toll lanes and other access management strategies like ramp
40
“2020 Public Transportation Fact Book.” American Public Transportation Association.
41
“2019 Year End Ridership.” Transportation Committee Agenda. Metropolitan Council, March 9, 2020. https://metrocouncil.org/Council-
Meetings/Committees/Transportation-Committee/2020/March-9,-2020/Inf o-1-2019-4th-Quarter-Ride rship-Re port-Final.aspx.
42
“2017 Transit Report: A Guide to Minnesota’s Public Transit Systems.” Minnesota Department of Transportation, March 28, 2018.
https://www.dot.state.mn.us/transit/reports/transit-report/pdf/annual-transit-report-2017.pdf.
Air Quality Trend Analysis 13metering, reduce overall congestion on freeways and incentivize higher occupancy vehicle travel during peak
travel times all help to reduce vehicle emissions.
The COVID-19 pandemic has shown what a future with cleaner air can look like to many communities. As national
lockdowns kept vehicles off roads and factories idled, a potential future with cleaner air has been seen by people
worldwide. Whether this clean air will be a temporary respite, or the beginning of a sustained cleaner future is
still yet to be seen, but some governments in Europe are using this tragic event as a catalyst to reorganize their
communities around cleaner modes of transport. Milan, Italy recently announced an ambitious new program
intended to immediately repurpose 22 miles of city streets from serving vehicles to pedestrians and cyclists. 43
American cities have announced similar initiatives. During the pandemic, the Minneapolis Parks and Recreation
Board temporarily closed or limited vehicle traffic on many of its parkways along lakes and the Mississippi River to
allow for more people to be outside while keeping distance from others. 44 While these changes are likely not to
be permanent in many American cities, they illustrate what reorganized right-of-way could look like for cities in
the future.
CLEANER VEHICLE TECHNOLOGY ADVANCEMENT
Vehicles producing lower levels of emissions are becoming more common on our roadways, most notably, electric
vehicles. As of February 2020 there were 12,950 electric vehicles registered in Minnesota, an increase of nearly
3,000 vehicles from April of 2019, when there were 10,150 electric vehicles on the road. 45 Electric vehicles emit a
much smaller amount of harmful emissions like nitrogen oxide and particulate matter and produce no tailpipe
emissions (Figure 7). Local private companies are working to improve their emissions through efficient supply
chains, fleets of hybrid and electric vehicles and programs to encourage employees to commute by means other
than driving single occupant vehicles.
These programs are known as travel demand management (TDM) strategies. Organizations across the state
incentivize their employees to commute to work by bike, transit or carpool to lesson negative impacts from
excessive vehicle use. TDM strategies can also include means to lesson peak travel time burdens to facilities which
in turn lesson congestion on roadways. Many non-profits are driving change by convening stakeholders and
engaging local communities to pursue air quality goals, administering grant programs and advocating for clean
vehicle adoption and usage, influencing local and state leaders to set more aggressive air quality and emissions
goals and more.
43
Laker, Laura. “Milan Announces Ambitious Scheme to Reduce Car Use after Lockdown.” The Guardian. Guardian News and Media, April 21, 2020.
https://www.theguardian.com/world/2020/apr/21/milan-seeks-to-prevent-post-crisis-return-of-traffic-pollution.
44
“Minneapolis Park and Recreation Board Announces Additional Updates to Parkway Closures to Allow for Social Distancing by Pedestrians.” Minneapolis
Park & Recreation Board, April 16, 2020. https://www.minneapolisparks.org/news/2020/04/16/minneapolis-park-and-recreation-board-announces-
additional-updates-to-parkway-closures-to-allow-for-social-distancing-by-pedestrians/.
45
“Sustainability and Public Health,” Electric Vehicles - Sustainability and Public Health - MnDOT, http://www.dot.state.mn.us/sustainability/electric-vehicle-
dashboard.html.
Air Quality Trend Analysis 14Figure 7: Annual gas-powered and electric vehicle emissions (12,000 miles) of nitrogen oxide (NOx) and
particulate matter (PM) 46
11.0
Amount of 6.5
Emissions
(lbs) 4.0
2.3
0.4 0.4 0.0 0.0 0.1
Gas-powered EV charged with traditional power EV charged with renewable power
Carbon Dioxide (thousands of lbs) Nitrus Oxide Particulate Matter
Since 2005, the EPA has given grants to projects that reduce emissions from existing diesel engines. Almost 3,200
school buses were retrofitted nationally, which reduced children’s exposure to harmful particulates by 20% to
25%. The previously described settlement with Volkswagen and the EPA which provided Minnesota with $47
million has helped the MPCA begin a state program to update older diesel buses. Beyond the settlement amount
and funding duration, there is currently no permanent program in place.
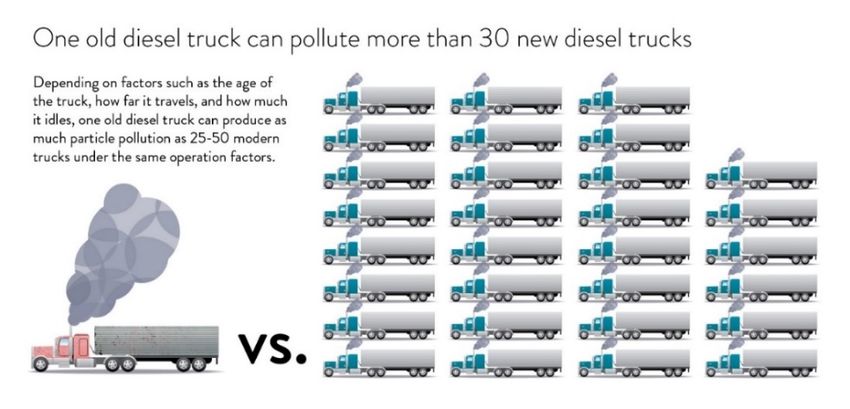
A major source of air pollutants in the transportation sector is in the nation’s supply chain, most notably, large
trucks. Like buses, large trucks almost exclusively run on diesel engines. Diesel engines have historically been one
of the largest emitters of air pollution in the transportation sector, but as seen in figure 8, new diesel trucks have
become significantly cleaner than their older counterparts. However, diesel engines are very long lasting, with
some trucks operating on the same engine for upwards of one million miles, so many heavy polluting vehicles
remain on the road today. Similar to the EPA and other MPCA programs mentioned previously, the MPCA has a
program called Project Green Fleet which distributes grant money to diesel engine users, like trucking companies,
to help in retrofitting and purchasing new diesel trucks and engines over to newer and much cleaner versions.
New diesel trucks reduce fine particle emissions by up to 97%, nitrous oxide by 80% and carbon dioxide by 4%
and are cheaper to operate and maintain for trucking firms.
46 MPCA. “The Air We Breathe 2019”.
Air Quality Trend Analysis 15Figure 8. Comparison of emissions of one older diesel truck to its new diesel trucks counterpart. 47
CONCLUSION
Air quality continues to be a concern for communities across the country. Improvements in air quality have been
made through regulation, technological improvements and behavior changes, but these improvements have not
been seen equally throughout communities in the U.S. and there is still much work to be done to improve air
quality. The more these older, dirtier and less efficient vehicles can be replaced on Minnesota roads, whether that
be a diesel truck or bus or gasoline car, the less toxic Minnesota’s air will be for life in the state and the better life
can continue to thrive for future generations to come.
RELATED TRENDS
• Biodiversity
• Climate Change
• Health and Transportation
• Race and Transportation
• Transportation Behavior
• Water Quality
Minnesota's vision for transportation is known as Minnesota GO. The aim is that the multimodal transportation
system maximizes the health of people, the environment, and our economy. A transportation vision for
generations, Minnesota GO guides a comprehensive planning effort for all people using the transportation system
and for all modes of travel. Learn more at MinnesotaGO.org.
47
MPCA. “The Air We Breathe 2017”.
Air Quality Trend Analysis 16REVISION HISTORY
Date Summary of revisions
November 2015 Original paper (part of Environmental Quality trend analysis).
January 2018 Updated to reflect new data and separated into Air Quality-specific trend analysis.
April 2021 Updated to reflect new data and information.
Air Quality Trend Analysis 17You can also read