Age estimation using methylation sensitive high resolution melting (MS HRM) in both healthy felines and those with chronic kidney disease
←
→
Page content transcription
If your browser does not render page correctly, please read the page content below
www.nature.com/scientificreports
OPEN Age estimation using
methylation‑sensitive
high‑resolution melting (MS‑HRM)
in both healthy felines and those
with chronic kidney disease
Huiyuan Qi1, Kodzue Kinoshita1, Takashi Mori2, Kaori Matsumoto2,4, Yukiko Matsui3 &
Miho Inoue‑Murayama1*
Age is an important ecological tool in wildlife conservation. However, it is difficult to estimate in
most animals, including felines—most of whom are endangered. Here, we developed the first DNA
methylation-based age-estimation technique—as an alternative to current age-estimation methods—
for two feline species that share a relatively long genetic distance with each other: domestic cat
(Felis catus; 79 blood samples) and an endangered Panthera, the snow leopard (Panthera uncia; 11
blood samples). We measured the methylation rates of two gene regions using methylation-sensitive
high-resolution melting (MS-HRM). Domestic cat age was estimated with a mean absolute deviation
(MAD) of 3.83 years. Health conditions influenced accuracy of the model. Specifically, the models built
on cats with chronic kidney disease (CKD) had lower accuracy than those built on healthy cats. The
snow leopard-specific model (i.e. the model that resets the model settings for snow leopards) had a
better accuracy (MAD = 2.10 years) than that obtained on using the domestic cat model directly. This
implies that our markers could be utilised across species, although changing the model settings when
targeting different species could lead to better estimation accuracy. The snow leopard-specific model
also successfully distinguished between sexually immature and mature individuals.
Age is an important ecological tool for wildlife conservation. As it is related to reproduction1,2 and mortality
rates3, knowing the accurate age of an animal is helpful in estimating the structure of populations4 and, con-
sequently, in the prediction of the present and future extinction risk for a wildlife population. Age estimation
of wild-born individuals placed in captivity for their protection is beneficial for better health management and
a more efficient reproduction schedule. However, most of the prevailing age-estimation methods have some
deficiencies. For instance, estimating age through individual tracking, e.g. direct observation of p rimates5 and
mark-recapture of b ats6, is time consuming and difficult to apply to species that are difficult to observe and
recapture. Observation of appearance change is also only possible for a limited number of species that exhibit
easily observable and significant age-related changes, such as the accumulation of scars in c etaceans7. Methods
based on observing the age-related development and eruption of teeth and bones can only be executed either
on dead bodies or through capture and long-term restraint of living individuals for measurement or for taking
dental photographs8–10.
Recently, an increasing number of studies have focused on molecular aging markers, which can be used to
determine an individual’s age by sampling and analysing only a small amount of material. DNA methylation is
one representative of molecular aging m arkers3,11,12. Changes in aging-associated DNA-methylation levels occur
in CpG islands—CpG dinucleotides occur in clusters that are often present in gene promoter sites13. This change
is a factor that determines the level and integrity of gene expression and results in loss of body function14. Pre-
vious studies have established DNA methylation as one of the most accurate age m arkers3,11,12. However, these
studies are mainly limited to humans12,15,16 and m ice17,18, with only a few studies on other species, such as dogs
1
Wildlife Research Center, Kyoto University, Kyoto 606‑8203, Japan. 2Kyoto Medical Center, Daktari
Animal Hospital, Kyoto 615‑8234, Japan. 3Tama Zoological Park, Tokyo 191‑0042, Japan. 4Present address:
Miyazaki Prefectural Miyakonojo Livestock Hygiene Service Center, Miyazaki 889‑4505, Japan. *email:
murayama.miho.5n@kyoto-u.ac.jp
Scientific Reports | (2021) 11:19963 | https://doi.org/10.1038/s41598-021-99424-4 1
Vol.:(0123456789)
www.nature.com/scientificreports/
Gene Primers Length n(CpGs) PCR conditions NCBI sequence ID: position References
F: TgTYgTYgYggYgTTTTTtgT 95 ℃ (5 min), [95 ℃ (10 s); 55 ℃ (30 s); 72 ℃ NC_018727.3: 17,965,149 to 17,965,265
ELOVL2 117 13 32
R: ccaAaAAcRAAcRAcRAAtcc (12 s)]*42 cycles (reverse complement)
F: gCgatggttTtgtagaTaagg 95 ℃ (5 min), [95 ℃ (10 s); 50 ℃ (30 s); 72 ℃
RALYL 109 9 NC_018740.3: 34,400,393 to 34,400,501 20
R: cgttttttccataaaaccaAttA (10 s)]*45 cycles
Table 1. Primer information and PCR conditions. Capital letter: bisulfite-converted letter (F: c → T, R: g → A).
Mixed base: Y = C + T, R = G + A.
Figure 1. The standard curve of (a) ELOVL2 (elongation of very long chain fatty acid protein) and (b)
RALYL (RALY RNA binding protein-like) for domestic cat samples. Df value is the raw fluorescence data
from methylation-sensitive high-resolution melting (MS-HRM). Data on snow leopard samples is shown in
Supplementary Fig. S1.
(Canis familiaris)19,20, wolves (Canis lupus)19,20, chimpanzees (Pan troglodytes)21, humpback whales (Megaptera
novaeangliae)22, and Bechstein’s bats (Myotis bechsteinii)23.
The domestic cat (Felis catus) is both an important companion animal and a model animal for other felines;
therefore, it could be said that the domestic cat is an ideal choice as the first DNA methylation-based age-
estimation target in felines. Knowing a cat’s age helps individuals who adopt abandoned cats to take steps to
prevent age-related diseases and improve cat welfare. Although estimating age by measuring the development
and eruption of teeth is a widely used method in domestic cats, dental c hecks24 require a longer duration of
restraint for obtaining dental photographs, which in turn places the individual under prolonged stress. It would
be more convenient to determine the age of blood DNA, which can be obtained during regular health checks
wherein blood sampling is required. In this way, with only a short duration of restraint, it may be possible to
obtain age-related information together with the results of other biochemical and blood parameters. The model
and markers designed for domestic cats are expected to be useful for other wild felines, as related species share
similar age-related DNA methylation changes as implied by previous studies on humans and chimpanzees12, and
on dogs and wolves19. To verify this hypothesis, we compared the sequences of age-estimation markers used in
our models among all felines whose genome data were published. If the sequences were highly conserved, it was
assumed that the markers would also have high applicability to other felines. To further verify this by experiment,
we used the blood samples of the snow leopard (Panthera uncia) available to our team25,26, an endangered large cat
species that shares long genetic distance with the domestic cat27, to test the markers and models developed with
domestic cat samples. Although it is difficult to collect blood samples from the wild, it is still possible once an
individual is captured. A more accurate age can be estimated by applying the methylation-based age-estimation
method together with traditional dental morphology-based methods.
In this study, we included not only healthy individuals but also those with chronic kidney disease (CKD), one
of the most common diseases in elderly f elines28,29, to determine the influence of CKD on estimation accuracy.
To our knowledge, our study presents the first age-estimation model applied to non-human species, including
diseased individuals, by which we could devise specific ways to apply our model in the future. Specifically, if the
estimation accuracy was influenced by CKD, it would imply that the markers should be used with a combination
of disease biomarkers or pre-knowledge of the health condition of target individuals.
In this study, we developed a DNA methylation-based age-estimation technique for felines as a promising
alternative to current age-estimation methods. We analysed the methylation rate of two epigenetic aging marker
candidates (Table 1): (1) ELOVL230–32 (elongation of very long chain fatty acid protein) and (2) RALYL20 (RALY
RNA binding protein-like) via methylation-sensitive high-resolution melting (MS-HRM)30,31,33–35.
Results
Standard curves. In MS-HRM analysis, a standard curve was prepared for each experiment to calculate the
methylation status of the samples, following Eq. (1) in the “Calculation of methylation rates” of the “Materials
and methods” section. The standard curves of ELOVL2 and RALYL in domestic cats are shown in Fig. 1. The
standard curves of the snow leopards are shown in Supplementary Fig. S1. The estimated value of “a” in Eq. (1)
for each species and each gene region are summarised in Supplementary Table S1.
Scientific Reports | (2021) 11:19963 | https://doi.org/10.1038/s41598-021-99424-4 2
Vol:.(1234567890)
www.nature.com/scientificreports/
Figure 2. Correlation between methylation rate and chronological age for each gene region of each species: (a)
domestic cat & ELOVL2 (elongation of very long chain fatty acid protein), (b) domestic cat & RALYL (RALY
RNA binding protein-like), (c) snow leopard & ELOVL2, and (d) snow leopard & RALYL. Domestic cat photo ©
H. Q., snow leopard photo © K. K.
Correlation between methylation rates and age. The methylation rates of ELOVL2 and RALYL in
domestic cats were significantly correlated with age (ELOVL2: cor = 0.68, p < 0.001; RALYL: cor = 0.67, p < 0.001)
(Fig. 2a, 2b). The results for the snow leopard were similar (ELOVL2: cor = 0.84, p < 0.01; RALYL: cor = 0.83,
p < 0.01) (Fig. 2c, 2d).
Age‑estimation model. Model that used all domestic cat samples. As the methylation rates of the two
gene regions were correlated with age, both were used as explanatory variables in the age-estimation model. Af-
ter leave-one-out validation (LOOCV) (Fig. 3a), the mean absolute deviation (MAD) was 3.83 years. To evaluate
the source of the deviation of the model, we used linear regression to determine the factors that contributed to
the estimated age difference (i.e. the difference between the predicted age and chronological age). As a result,
the best regression model (R2 = 0.41) included age, sex, and health conditions as explanatory variables. Male
individuals and those with CKD had larger estimated age differences, whereas older individuals had smaller
estimated age differences (Table 2). Although other unknown factors might also contribute to the estimated age
difference based on the low R2, the factors found in this model are still important.
Models for different sex and health condition combinations. As both sex and health conditions contributed to
the estimated age differences obtained from the model that used all samples, the age-estimation accuracy was
expected to improve when separate estimation models were built for different sex and health condition com-
binations (healthy females: 20 samples; CKD females: 23 samples; healthy males: 18 samples; CKD males: 18
samples). The estimation accuracy was improved in the models of females, especially in the model of healthy
females with MAD after LOOCV at 2.93 years (Table 3). For the male models, MAD improved before LOOCV
(Table 3); however, after LOOCV, the accuracy degraded significantly (Table 3).
Snow leopard models. First, snow leopard samples were used as a test set to validate whether the model devel-
oped on domestic cats (Fig. 3a) could be directly used for snow leopards. MAD was 2.91 years for snow leop-
ards. Although the accuracy was similar to that of domestic cats, the age of most samples was underestimated
(Fig. 3b). On examining the model of relative age, which is the ratio of chronological age to the age of the oldest
individual of the respective species in our study, the underestimation was worse (Fig. 3c, MAD = 0.306 relative
age). Next, we reset the model parameters (Supplementary Table S2) for snow leopards, and the accuracy was
significantly improved (Fig. 3d; after LOOCV, MAD = 2.10 years). On rebuilding the model using only healthy
samples (i.e. excluding one CKD sample), the estimation accuracy was at the same level as that in the snow
leopard-specific model using all samples (after LOOCV, MAD = 2.02 years).
Scientific Reports | (2021) 11:19963 | https://doi.org/10.1038/s41598-021-99424-4 3
Vol.:(0123456789)
www.nature.com/scientificreports/
Figure 3. Correlation between predicted age and chronological age: (a) domestic cat, (b) snow leopard using
the cat model directly. (c) Correlation between the predicted relative age and chronological relative age of
snow leopards on using cat model directly. (d) Correlation between the predicted age and chronological age
of snow leopards in snow leopard-specific model. The black line represents the y = x diagonal line. The region
between blue dash lines of each plot was the mean absolute deviation (MAD) range: (a) MAD = 3.83 years, (b)
MAD = 2.91 years, (c) MAD = 0.306 relative age, and (d) MAD = 2.10 years.
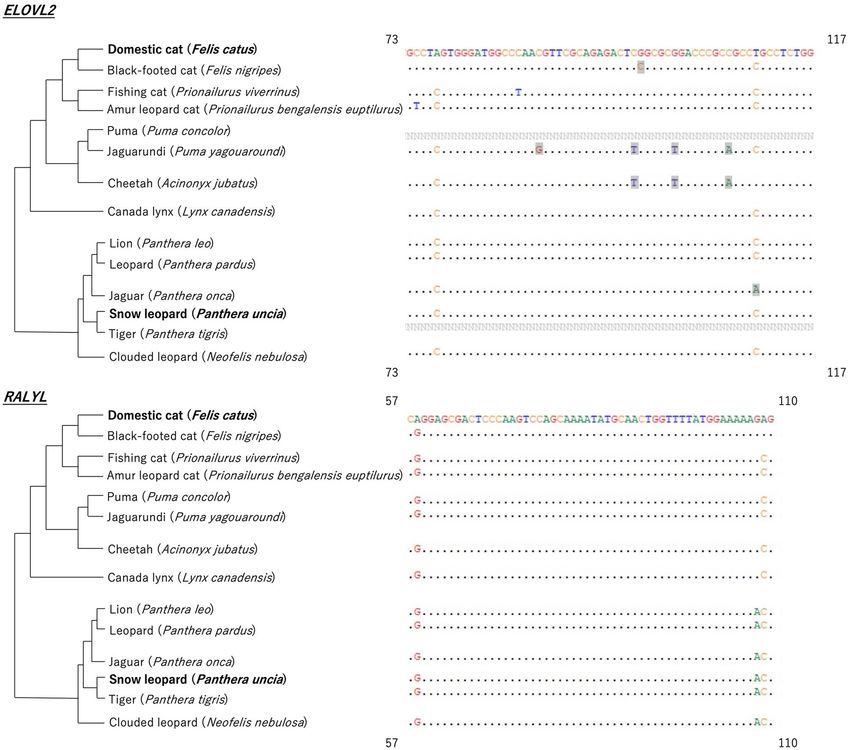
The potential use of markers in other felines. Data for the puma and tiger were absent from the database of the
ELOVL2 region (Fig. 4). The majority of the sequences among the felines were the same, although there was a
decrease in some CpG sites (i.e. bases highlighted in grey) compared to that in either the domestic cat or the
Scientific Reports | (2021) 11:19963 | https://doi.org/10.1038/s41598-021-99424-4 4
Vol:.(1234567890)www.nature.com/scientificreports/
Estimate P-value
(Intercept) 2.00 < 0.01**
Age − 0.43 < 0.001***
Sex (M) 1.88 < 0.01**
Health condition (CKD) 2.03 < 0.05*
Table 2. Coefficient value with p value in the linear regression model of estimated age difference which was
got from the model using all domestic cat samples. CKD chronic kidney disease.
The target of models MAD (year) MAD (year) (after LOOCV)
Healthy female 1.03 2.93
CKD female 0.94 3.76
Healthy male 2.20 4.63
CKD male 2.20 5.08
Table 3. Mean absolute deviation (MAD) results for each domestic cat model with different sex and health
condition combinations. CKD chronic kidney disease, LOOCV leave-one-out validation.
snow leopard. For the RALYL region, although there were some differences in some bases, the CpG sites were
identical to those of either the domestic cat or the snow leopard.
Discussion
This is the first epigenetic age-estimation study in felines and includes both healthy and diseased individuals.
The age-estimation model of domestic cats predicted age from blood samples with an MAD value of 3.83 years
(i.e. 19.3% of the oldest age) (Fig. 3a). The estimation accuracy was further improved to 2.93 years when only
healthy female samples were targeted (i.e. 18.9% of the oldest age). The estimation accuracy of our study was
lower than that of previous studies in other species using similar targeted bisulfite s equencing22,23 (approximately
10% of the oldest age). This is not due to the difference in the accuracy of methods; for MS-HRM was reported
to share an accuracy similar to that of pyrosequencing36,37, which is the major targeted bisulfite sequencing
method used in previous studies22,23. The relatively low estimation accuracy is possibly caused by the limited
number of age-estimation markers used in our study. It is hoped that the accuracy may be further improved by
increasing the number of markers. MS-HRM is a real-time PCR-based technique, which is easier, quicker (almost
2 h for each run), and more cost-effective (costs $7 per sample for age estimation based on two markers) than
pyrosequencing (needs 3–4.5 h for each run, and costs $14 per sample for age estimation based on two mark-
ers)23,38. The disadvantage of MS-HRM is that only the average methylation rate of target regions, but not that
of individual CpG sites, could be known, whereas that of individual CpG sites is not that necessary to know in
clinical measurement. Overall, for domestic cats, this study provided a new possibility to estimate the age of an
adopted cat from blood that could be obtained rapidly during regular health checks, as an alternative to dental
check-ups that require a longer time of restraint24 and are limited to some age s tages39.
As diseases have been reported to affect DNA methylation levels in some regions40,41, clarifying whether dis-
eases affect selected genetic markers could contribute to a more applicable and accurate age-estimation model.
This implies that, if the markers were found to be influenced, knowing the health condition of the targeted indi-
viduals and estimating the age of healthy and diseased individuals separately would be necessary. However, it is
difficult to find practical studies on age estimation to study the influence of health conditions on model accuracy,
in which the target species are neither humans nor mice. Furthermore, no previous research has investigated
whether CKD influences the methylation levels of ELOVL2 and RALYL in blood. In our study, we found that the
estimation accuracy was affected by health conditions, and the estimation accuracy of the healthy individuals’
model was higher than that of the CKD model. CKD had different levels of influence on health at different age
stages, which could consequently decrease the estimation accuracy. CKD is a common disease in older felines
and might affect over 30%–40% of cats over 10 years of a ge28,29; therefore, it is reasonable to assume that older
CKD individuals could still have normal health conditions and, thus, a normal physiological/predicted age,
whereas it is the opposite in young individuals with CKD. Therefore, for CKD females, most of whom were older
individuals (> 10 years) (Fig. 3a), CKD did not have a significant influence on the estimation accuracy. However,
in the CKD male group with both young and old individuals in equal proportions (Fig. 3a), CKD had different
influences at different age stages, which led to a low estimation accuracy. The higher ratio of young individuals
in the CKD male group than in the CKD female group is also consistent with the report that male cats are more
frequently diagnosed with CKD than females at a young age42. For future studies, other common feline diseases
should also be considered to determine their influence on the age-estimation model.
For the results of snow leopards, the estimation accuracy was much improved after resetting model param-
eters for snow leopards, i.e. MAD changed from 2.91 years (Fig. 3b) to 2.10 years (Fig. 3d), which implies that
although the markers were common in the two related species, the model could be species-specific. Therefore,
Scientific Reports | (2021) 11:19963 | https://doi.org/10.1038/s41598-021-99424-4 5
Vol.:(0123456789)www.nature.com/scientificreports/
Figure 4. The alignment of feline ELOVL2 (elongation of very long chain fatty acid protein) and RALYL (RALY
RNA binding protein-like) marker regions with feline phylogenetic trees. Only the parts of sequence where
differences between felines appear are shown, with starting and ending positions shown in the four corners of
the alignments. Bases highlighted in grey were located in the domestic cat’s and the snow leopard’s CpG sites,
which were not conserved in the relevant species.
for further application to other feline species, it might be necessary to reoptimize the model settings for each
species. We also successfully distinguished young individuals (i.e. those around 2–3 years old) and other elderly
individuals (Fig. 3d). Based on the life cycle information from c aptive1 and w
ild43 snow leopards, it is reported
that these animals become sexually mature around 2–3 years of age. Thus, it could be said that our model can
help to distinguish between individuals at the reproductive stage and those who are not. This would, in turn,
contribute to both wild- and captive-population management. The greatest deficiency of our snow leopard model
was the small sample size (11 samples). In future studies, more snow leopard samples should be used to evaluate
our snow leopard model and analyse the influence of sex and health conditions on the model, which could not
be analysed in our study due to the small sample size.
Although we only studied domestic cats and snow leopards, we found that the two gene regions we used were
also highly conserved in other felines, which implies high applicability of our markers in all felines. The slight
sequence difference between species implied a slightly different methylation background. This also implied that,
although the markers could be widely applied, the age-estimation model could be species-specific or specific to
those sharing exactly the same sequence. One caution is that for the black-footed cat, the PUMA lineage (i.e.
puma, jaguarundi, cheetah), and the jaguar, the number of CpG sites in ELOVL2 was slightly less than that in
the domestic cat and the snow leopard. The MS-HRM method could only determine the average methylation
of the whole target region, therefore we could not determine which CpG sites were important and whether they
were conserved in these species or not. Thus, future studies should verify whether the ELOVL2 marker is usable
in black-footed cats, the PUMA lineage, and the jaguar before applying it to these species.
Scientific Reports | (2021) 11:19963 | https://doi.org/10.1038/s41598-021-99424-4 6
Vol:.(1234567890)www.nature.com/scientificreports/
In addition, when this method is applied to wild animals, it is important to determine whether the environ-
ment and difference in food resources between captive and wild individuals could influence the model function.
Some previous studies have implied that DNA methylation of some gene regions is influenced by these external
factors44,45. For future utilisation in wild individuals, more robust markers that are not easily influenced by the
environment or food resources should be selected.
Materials and methods
Ethics statement. All methods were carried out in accordance with relevant guidelines and regulations.
The study was carried out in compliance with the ARRIVE guidelines. All experimental protocols were approved
by the ethical committee of Wildlife Research Center of Kyoto University and all sample collection and experi-
ments were conducted with permission from the ethical committee with approval number WRC-2019-012A,
WRC-2020-012A and WRC-2021-001A. All domestic cat samples were obtained in agreement with cat owners.
All snow leopard samples were collected with the approval of each zoo. Data anonymization was done for all the
samples.
Sample collection and DNA extraction. Residual blood samples from health check-ups of 79 domestic
cats were collected from the Daktari Animal Hospital and Anicom Specialty Medical Institute Inc. between
July and September 2020. Information on age, cat breed, neuter status, sex, and health condition was recorded
by the veterinarians. The cats were either healthy or had CKD. The diagnosis of CKD followed the IRIS CKD
guidelines wherein serum creatinine and symmetric dimethylarginine (SDMA) in blood were both used as diag-
nostic markers46. All domestic cat samples were stored at − 80 °C for less than 1 month before DNA extraction.
Most domestic cat samples were obtained from mixed breed individuals (n = 52). The remaining 27 individuals
were pure breed cats (British Shorthair, 3; Chinchilla, 1; Chinchilla Persian; 1; exotic Shorthair, 4; Japanese cat,
2; Munchkin, 4; Norwegian Forest Cat, 6; Russian Blue, 2; Scottish Fold, 3; Somali, 1). As there were only a few
samples for pure breed cats, breed was not considered an important factor that could have influenced the meth-
ylation rates. Of these, 25 individuals were unneutered, most of whom were younger than 2 years of age. The age
distributions with different sex and health condition combinations are shown in Supplementary Table S3. The
sex ratio (F:M) was 43:36, age ranged from 0.41 to 21.04 years, and the number of healthy individuals was 38.
The other patients had CKD (n = 41).
For snow leopards, 11 samples from individuals between 2.25 and 14.67 years of age were used. Seven indi-
viduals were male and four were female. The age and sex information were summarised in Supplementary
Table S4. According to the diagnosis of veterinarians, all individuals were in good health condition, except for the
oldest individual who was diagnosed with CKD based on blood tests but did not exhibit significant symptoms.
These samples were stored at –20 ℃ before DNA extraction. DNA from all the above samples of both species
was extracted using the DNeasy Blood & Tissue Kit (QIAGEN GmbH, Hilden, Germany) and stored at –20 °C
until use.
Standard DNA. Standard DNA is needed in MS-HRM to calculate the methylation status of the samples. A
0% methylated standard DNA was obtained by performing whole genome amplification treatment on one DNA
sample from each species using the REPLI-g Mini Kit (QIAGEN GmbH, Hilden, Germany). We obtained 100%
methylated standard DNA by fully methylating the same DNA sample with CpG methyltransferase (M.SssI;
New England Biolabs, Beverly, MA, USA). Standard DNA (0% and 100%) was purified using a High Pure PCR
Product Purification Kit (Roche Molecular Systems, Pleasanton, CA, USA).
Bisulfite conversion. DNA samples and purified standard DNA were bisulfite-converted using the EZ
DNA Methylation-Gold Kit (Zymo Research, Irvine, CA, USA). The concentration of bisulfite-converted DNA
was then measured with a Qubit 4 Fluorometer using a Qubit ssDNA Assay Kit (Thermo Fisher Scientific, San
Jose, CA, USA) and finally adjusted to 5 ng/μL.
Gene regions and primer design. The target genes were ELOVL2 (elongation of very long chain fatty
acids protein 2) and RALYL (RALY RNA binding protein-like). ELOVL2 is a well-known biomarker of aging,
which has been widely reported in humans30–32, chimpanzees12, and mice47. Although there are few studies on
RALYL, it has been reported to be hypermethylated in cancer tissues48,49 and was used as a biomarker by Lowe
et al. (2018)20 to estimate the age of domestic dogs, the carnivorous relatives of felids20. Homogeneous gene
regions were blasted in the domestic cat genome (GCA_000181335.4) provided by NCBI50 via BLASTN51. PCR
primers were designed using Methyl Primer Express v1.0 (Thermo Fisher Scientific, San Jose, CA, USA; Table 1).
The same primers and conditions were used for both species.
Methylation‑sensitive high‑resolution melting (MS‑HRM). In MS-HRM, bisulfite-converted DNA
samples were PCR-amplified, followed by melting analysis. PCR amplification was carried out using a Roche
LightCycler 480 Instrument II (Roche Molecular Systems, Branchburg, NJ, USA) equipped with the Gene Scan-
ning Software 96 (version 1.5.1.62 SP2) in a 25 μL total volume containing 1 × EpiTect HRM PCR Master Mix
(EpiTect HRM PCR Kit; QIAGEN GmbH, Hilden, Germany), 750 nM of each primer, and 2 μL of template
DNA (5 ng/μL bisulfite-converted DNA). The PCR conditions are presented in Table 1. After PCR amplification,
samples were cooled to 65 °C for 1 s and then heated to 95 °C at 0.02 °C/s to melt gradually. The continuous
fluorescence data was gained at 25 acquisitions/s during the entire process. Standard curves with known meth-
ylation ratios (0%, 5%, 10%, 15%, 25%, 40%, 50%, 75%, and 100%) were included in each assay and were later
Scientific Reports | (2021) 11:19963 | https://doi.org/10.1038/s41598-021-99424-4 7
Vol.:(0123456789)www.nature.com/scientificreports/
used to calculate the methylation rate of each sample. The standard series was prepared by mixing 0% methylated
standard DNA and 100% unmethylated standard DNA in appropriate ratios. All reactions were performed in
duplicate.
After the experiment, the melting curves were normalised relative to the two temperature regions before and
after the major fluorescence decrease. We set the pre-melt temperature region to 66–68 °C and the post-melt
temperature region to 84.5–85 ℃ for ELOVL2. For RALYL, the pre-melt temperature region was 67–68 °C and
the post-melt temperature region was 82–83 °C.
The difference curves (Supplementary Fig. S2) were then derived from the first derivative of the melt curves
after setting the data of the 0% methylated standard sample as a baseline. The maximum absolute value of the
relative signal difference from the difference curves were defined as “Df value” (Supplementary Fig. S2), for
each sample.
Calculation of methylation rates. The Df values of the standard series were plotted for each species, gene
region, and plate. The standard curve follows a non-linear regression model designed by Hamano et al. (2016)30
as follows:
a∗M Df
= (1)
100 − M Df max − Df
fmax is the Df value of 100% methylated standard sample and “a” is a coefficient.
where M is methylation rate, D
The conduction of the regression model and the calculation of the estimated value of "a" were carried out using
the nls command in R 4.0.3. The methylation rates of the samples were calculated later by substituting the Df
value into Eq. (1).
Age‑estimation model and model validation. Before building the model, we calculated Pearson’s prod-
uct-moment correlation coefficients with p values between age and the methylation rate of each target region. To
build the age-estimation models, we used support vector regression (SVR), which is implied by Xu et al.52, to be
a robust choice that has high estimation accuracy with a low-level overfit. The R package “e1071”53 was used to
build the models. The parameters of the SVR models were optimised using the “tune” command with optimiz-
able parameters “cost” and “epsilon” and fixed settings “type = eps-regression, kernel = radial, gamma = 0.5”. The
optimised parameters are summarised in Supplementary Table S2. LOOCV was used to validate the overfitting
of the optimised models. To evaluate the source of the deviation in the model that used all domestic cat samples,
a linear regression model with the age-estimation difference (predicted age − chronological age) as the response
variable was built using the “lm” command. The model selection was conducted with the “MuMIn” package.
Sequences of the target regions in other felines. We also compared the similarity of our target regions
among the felines with published genome data. We used the sequences of domestic cats as queries and per-
CBI50 or DNA Zoo Consortium54). The sequence
formed a BLASTN search in the feline genome database (i.e. N
data where differences between species appeared were summarised with phylogenetic trees of f elines27 (Fig. 4).
Data availability
The raw data and R script of this study can be accessed from the DOI (https://doi.org/10.5061/dryad.66t1g1k2t).
Received: 5 July 2021; Accepted: 22 September 2021
References
1. Blomqvist, L. & Sten, I. Reproductive Biology of the Snow Leopard. Panthera Books, London (1982).
2. Kirkwood, T. B. & Austad, S. N. Why do we age?. Nature 408, 233–238 (2000).
3. Zhao, M., Klaassen, C. A. J., Lisovski, S. & Klaassen, M. The adequacy of aging techniques in vertebrates for rapid estimation of
population mortality rates from age distributions. Ecol. Evol. 9, 1394–1402 (2019).
4. Oli, M. K. & Dobson, F. S. The relative importance of life-history variables to population growth rate in mammals: Cole’s prediction
revisited. Am. Nat. 161, 422–440 (2003).
5. Mori, A. Analysis of population changes by measurement of body weight in the Koshima troop of Japanese monkeys. Primates 20,
371–397 (1979).
6. WILkINSON, G. S. & Brunet-Rossinni, A. K. Methods for age estimation and the study of senescence in bats. In Ecological and
behavioral methods for the study of bats 315–325 (Johns Hopkins University Press, 2009).
7. Hartman, K. L., Wittich, A., Cai, J. J., van der Meulen, F. H. & Azevedo, J. M. N. Estimating the age of Risso’s dolphins (Grampus
griseus) based on skin appearance. J. Mammal. 97, 490–502 (2016).
8. Chevallier, C., Gauthier, G. & Berteaux, D. Age estimation of live arctic foxes Vulpes lagopus based on teeth condition. Wildl. Biol.
4, 1–6 (2017).
9. White, P. A. et al. Age estimation of African lions Panthera leo by ratio of tooth areas. PloS One 11, e0153648 (2016).
10. Siegal-Willott, J., Isaza, R., Johnson, R. & Blaik, M. Distal limb radiography, ossification, and growth plate closure in the juvenile
Asian elephant (Elephas maximus). J. Zoo Wildl. Med. 39, 320–334 (2008).
11. Paoli-Iseppi, D. et al. Measuring animal age with DNA methylation: From humans to wild animals. Front. Genet. 8, 106 (2017).
12. Horvath, S. DNA methylation age of human tissues and cell types. Genome Biol. 14, 3156 (2013).
13. Schübeler, D. Function and information content of DNA methylation. Nature 517, 321–326 (2015).
14. Field, A. E. et al. DNA methylation clocks in aging: Categories, causes, and consequences. Mol. Cell 71, 882–895 (2018).
15. Weidner, C. I. et al. Aging of blood can be tracked by DNA methylation changes at just three CpG sites. Genome Biol. 15, 1–12
(2014).
16. Bocklandt, S. et al. Epigenetic predictor of age. PloS One 6, e14821 (2011).
Scientific Reports | (2021) 11:19963 | https://doi.org/10.1038/s41598-021-99424-4 8
Vol:.(1234567890)www.nature.com/scientificreports/
17. Petkovich, D. A. et al. Using DNA methylation profiling to evaluate biological age and longevity interventions. Cell Metab. 25,
954–960 (2017).
18. Stubbs, T. M. et al. Multi-tissue DNA methylation age predictor in mouse. Genome Biol. 18, 1–14 (2017).
19. Thompson, M. J., vonHoldt, B., Horvath, S. & Pellegrini, M. An epigenetic aging clock for dogs and wolves. Aging (Albany NY) 9,
1055–1068 (2017).
20. Lowe, R. et al. Ageing-associated DNA methylation dynamics are a molecular readout of lifespan variation among mammalian
species. Genome Biol. 19, 22 (2018).
21. Ito, H., Udono, T., Hirata, S. & Inoue-Murayama, M. Estimation of chimpanzee age based on DNA methylation. Sci. Rep. 8, 1–5
(2018).
22. Polanowski, A. M., Robbins, J., Chandler, D. & Jarman, S. N. Epigenetic estimation of age in humpback whales. Mol. Ecol. Resour.
14, 976–987 (2014).
23. Wright, P. G. et al. Application of a novel molecular method to age free-living wild Bechstein’s bats. Mol. Ecol. Resour. 18, 1374–1380
(2018).
24. Park, K. et al. Determining the age of cats by pulp cavity/tooth width ratio using dental radiography. J. Vet. Sci. 15, 557 (2014).
25. Yoshimura, H. et al. The relationship between plant-eating and hair evacuation in snow leopards (Panthera uncia). PLOS ONE 15,
e0236635 (2020).
26. Kinoshita, K. et al. Long-term monitoring of fecal steroid hormones in female snow leopards (Panthera uncia) during pregnancy
or pseudopregnancy. PLOS ONE 6, e19314 (2011).
27. Li, G., Davis, B. W., Eizirik, E. & Murphy, W. J. Phylogenomic evidence for ancient hybridization in the genomes of living cats
(Felidae). Genome Res. 26, 1–11 (2016).
28. Marino, C. L., Lascelles, B. D. X., Vaden, S. L., Gruen, M. E. & Marks, S. L. Prevalence and classification of chronic kidney disease
in cats randomly selected from four age groups and in cats recruited for degenerative joint disease studies. J. Feline Med. Surg. 16,
465–472 (2014).
29. Sparkes, A. H. et al. ISFM consensus guidelines on the diagnosis and management of feline chronic kidney disease. J. Feline Med.
Surg. 18, 219–239 (2016).
30. Hamano, Y. et al. Forensic age prediction for dead or living samples by use of methylation-sensitive high resolution melting. Leg.
Med. 21, 5–10 (2016).
31. Hamano, Y., Manabe, S., Morimoto, C., Fujimoto, S. & Tamaki, K. Forensic age prediction for saliva samples using methylation-
sensitive high resolution melting: exploratory application for cigarette butts. Sci. Rep. 7, 10444 (2017).
32. Bekaert, B., Kamalandua, A., Zapico, S. C., Van de Voorde, W. & Decorte, R. Improved age determination of blood and teeth
samples using a selected set of DNA methylation markers. Epigenetics 10, 922–930 (2015).
33. Hussmann, D. & Hansen, L. L. Methylation-sensitive high resolution melting (MS-HRM). In DNA Methylation Protocols (ed. Tost,
J.) vol. 1708, pp. 551–571 (Springer New York, 2018).
34. Wojdacz, T. K. & Dobrovic, A. Methylation-sensitive high resolution melting (MS-HRM): A new approach for sensitive and high-
throughput assessment of methylation. Nucleic Acids Res. 35, e41 (2007).
35. Mawlood, S. K., Dennany, L., Watson, N. & Pickard, B. S. The EpiTect methyl qPCR assay as novel age estimation method in forensic
biology. Forens. Sci. Int. 264, 132–138 (2016).
36. Migheli, F. et al. Comparison study of MS-HRM and pyrosequencing techniques for quantification of APC and CDKN2A gene
methylation. PLOS ONE 8, e52501 (2013).
37. Xiao, Z. et al. Validation of methylation-sensitive high-resolution melting (MS-HRM) for the detection of stool DNA methylation
in colorectal neoplasms. Clin. Chim. Acta 431, 154–163 (2014).
38. Šestáková, Š, Šálek, C. & Remešová, H. DNA methylation validation methods: A coherent review with practical comparison. Biol.
Proc. Online 21, 19 (2019).
39. Fleming, P. A., Crawford, H. M., Auckland, C. & Calver, M. C. Nine ways to score nine lives—Identifying appropriate methods to
age domestic cats (Felis catus). J. Zool.
40. Smyth, L. J., McKay, G. J., Maxwell, A. P. & McKnight, A. J. DNA hypermethylation and DNA hypomethylation is present at dif-
ferent loci in chronic kidney disease. Epigenetics 9, 366–376 (2014).
41. Chen, J. et al. Elevated Klotho promoter methylation is associated with severity of chronic kidney disease. PloS One 8, e79856
(2013).
42. White, J. D., Norris, J. M., Baral, R. M. & Malik, R. Naturally-occurring chronic renal disease in Australian cats: A prospective
study of 184 cases. Aust. Vet. J. 84, 188–194 (2006).
43. Snow Leopard Trust. Snow leopard facts/life cycle. Snow Leopard Trust http://snowleopard.org/snow-leopard-facts/life-cycle/.
44. Dhingra, R., Nwanaji-Enwerem, J. C., Samet, M. & Ward-Caviness, C. K. DNA methylation age—Environmental influences, health
impacts, and its role in environmental epidemiology. Curr. Environ. Health Rep. 5, 317–327 (2018).
45. Lea, A. J., Altmann, J., Alberts, S. C. & Tung, J. Resource base influences genome-wide DNA methylation levels in wild baboons
(Papio cynocephalus). Mol. Ecol. 25, 1681–1696 (2016).
46. IRIS. IRIS Kidney—Guidelines—IRIS Staging of CKD. http://www.iris-kidney.com/guidelines/staging.html (2019).
47. Spiers, H. et al. Age-associated changes in DNA methylation across multiple tissues in an inbred mouse model. Mech. Ageing Dev.
154, 20–23 (2016).
48. Vignettes, C.-B. Proceedings from the 2015 Annual Meeting of the American College of Physicians, Wisconsin Chapter. WMJ (2015).
49. Zhang, X. et al. Genome-wide analysis of cell-free DNA methylation profiling with MeDIP-Seq identified potential biomarkers
for colorectal cancer (2021).
50. MD, B., US, N. L. of M. & US, N. C. for B. I. National Center for Biotechnology Information (NCBI). https://www.ncbi.nlm.nih.
gov/.
51. Altschul, S. F., Gish, W., Miller, W., Myers, E. W. & Lipman, D. J. Basic local alignment search tool. J. Mol. Biol. 215, 403–410 (1990).
52. Xu, C. et al. A novel strategy for forensic age prediction by DNA methylation and support vector regression model. Sci. Rep. 5,
17788 (2015).
53. Chang, C.-C. & Lin, C.-J. LIBSVM: a library for support vector machines. ACM Trans. Intell. Syst. Technol. (TIST) 2, 1–27 (2011).
54. Dudchenko, O. et al. De novo assembly of the Aedes aegypti genome using Hi-C yields chromosome-length scaffolds. Science 356,
92–95 (2017).
Acknowledgements
We are grateful to the staff of Daktari Animal Hospital and Dr. Minori Arahori of Anicom Specialty Medi-
cal Institute Inc. for providing samples and individual information on domestic cats. We would like to thank
the following zoos for providing snow leopard samples: Adventure World, Akita Omoriyama Zoo, Asahikawa
City Asahiyama Zoo, Kobe Oji Zoo, Nagoya Higashiyama Zoo and Botanical Gardens, Omuta City Zoo, Tama
Zoological Park, and the Japanese Association of Zoos and Aquariums (JAZA). We would like to offer special
thanks to Prof. Ryosuke Takahashi, Graduate School of Medicine, Kyoto University, for his technical support. We
would like to thank Editage (www.editage.jp) for English language editing. This study was supported financially
Scientific Reports | (2021) 11:19963 | https://doi.org/10.1038/s41598-021-99424-4 9
Vol.:(0123456789)www.nature.com/scientificreports/
by KAKENHI Grant Numbers: 17K19426 (M.I-M), JP20H03008 (K.K), Bilateral Research Program Numbers
JPJSBP120219921 (M. I-M), JPJSBP120209915 (K.K), and Environment Research and Technology Development
Fund (JPMEERF20214001) of the Environmental Restoration and Conservation Agency of Japan (M.I-M).
Author contributions
H.Q. designed and conducted the study and wrote the manuscript. K.K. and M.I-M. designed the study, con-
tacted the institutes for samples, and revised the manuscript. T.M. and K.M. diagnosed the health conditions of
domestic cats and recorded the information of the domestic cat samples. Y.M. provided information on snow
leopards as the coordinator of the JAZA snow leopard studbook. All authors have approved the final manuscript
for publication.
Competing interests
The authors declare no competing interests.
Additional information
Supplementary Information The online version contains supplementary material available at https://doi.org/
10.1038/s41598-021-99424-4.
Correspondence and requests for materials should be addressed to M.I.-M.
Reprints and permissions information is available at www.nature.com/reprints.
Publisher’s note Springer Nature remains neutral with regard to jurisdictional claims in published maps and
institutional affiliations.
Open Access This article is licensed under a Creative Commons Attribution 4.0 International
License, which permits use, sharing, adaptation, distribution and reproduction in any medium or
format, as long as you give appropriate credit to the original author(s) and the source, provide a link to the
Creative Commons licence, and indicate if changes were made. The images or other third party material in this
article are included in the article’s Creative Commons licence, unless indicated otherwise in a credit line to the
material. If material is not included in the article’s Creative Commons licence and your intended use is not
permitted by statutory regulation or exceeds the permitted use, you will need to obtain permission directly from
the copyright holder. To view a copy of this licence, visit http://creativecommons.org/licenses/by/4.0/.
© The Author(s) 2021
Scientific Reports | (2021) 11:19963 | https://doi.org/10.1038/s41598-021-99424-4 10
Vol:.(1234567890)You can also read