Identification of Prognostic Risk Model Based on DNA Methylation-Driven Genes in Esophageal Adenocarcinoma
←
→
Page content transcription
If your browser does not render page correctly, please read the page content below
Hindawi
BioMed Research International
Volume 2021, Article ID 6628391, 20 pages
https://doi.org/10.1155/2021/6628391

Research Article
Identification of Prognostic Risk Model Based on DNA
Methylation-Driven Genes in Esophageal Adenocarcinoma

 Yuhua Chen,1 Jinjie Wang,2,3 Hao Zhou,2,3 Zhanghao Huang,2,3 Li Qian ,4 and Wei Shi 5

 1
 Nantong Health College of Jiangsu Province, Nantong, 226010 Jiangsu, China
 2
 Nantong Key Laboratory of Translational Medicine in Cardiothoracic Diseases and Research Institution of Translational Medicine
 in Cardiothoracic Diseases, Affiliated Hospital of Nantong University, Nantong, 226001 Jiangsu, China
 3
 Department of Thoracic Surgery, Affiliated Hospital of Nantong University, Nantong, 226001 Jiangsu, China
 4
 Department of Oncology, Affiliated Hospital of Nantong University, Nantong 226001, China
 5
 Department of Science and Technology, Affiliated Hospital of Nantong University, Nantong 226001, China

 Correspondence should be addressed to Li Qian; ntqianli@163.com and Wei Shi; fyweis@ntu.edu.cn

 Received 7 December 2020; Revised 15 April 2021; Accepted 8 May 2021; Published 11 June 2021

 Academic Editor: Suyan Tian

 Copyright © 2021 Yuhua Chen et al. This is an open access article distributed under the Creative Commons Attribution License,
 which permits unrestricted use, distribution, and reproduction in any medium, provided the original work is properly cited.

 Background. DNA methylation is an important part of epigenetic modification, and its abnormality is closely related to esophageal
 adenocarcinoma (EAC). This study was aimed at using bioinformatics analysis to identify methylation-driven genes (MDGs) in
 EAC patients and establish a risk model as a biological indicator of EAC prognosis. Method. Downloaded EAC DNA
 methylation, transcriptome, and related clinical data from TCGA database. MethylMix was used to identify MDGs. R package
 clusterProfiler and the ConsensusPathDB online database were used to analyze the rich functions and pathways of these MDGs.
 The prognostic risk model was established by univariate Cox regression, Lasso regression, and multivariate Cox regression
 analysis. Finally each MDG in the model were carried out through the survival R package. Results. A total of 273 MDGs were
 identified, which were enriched in transcriptional regulation and embryonic organ morphogenesis. Cox regression analysis
 established a risk model consisting of GPBAR1, OLFM4, FOXI2, and CASP10. In addition, further survival analysis revealed
 that OLFM4 and its two related sites were significantly related to the EAC patients’ survival. Conclusion. In summary, this study
 used bioinformatics methods to identify EAC MDGs and established a reliable risk prognosis model. It provided potential
 biomarkers for the early treatment and prognosis evaluation of EAC.

1. Introduction States from 2009 to 2015 is only 20%, most of which are
 EAC patients [5]. Almost all EAC develop from Barrett’s
Esophageal cancer (EC) is a common malignant tumor of the esophagus (BE), which is the most important facilitator for
digestive system. Its global morbidity and total mortality EAC. However, progress from BE to EAC is very slow, and
ranked seventh and sixth, respectively, in 2018 [1]. There are patients with BE usually have no obvious symptoms, which
two main histological subtypes of EC, esophageal adenocarci- make early diagnosis and treatment impossible [6]. Current
noma (EAC) and esophageal squamous cell carcinoma treatment methods for EAC include a combination of surgery,
(ESCC). Among them, ESCC is the principal subtype, chemotherapy, and radiation therapy. However, EAC usually
accounting for 80% of all EC [2]. ESCC is one of the most has metastasized at the time of diagnosis, so the patient’s prog-
aggressive squamous cell carcinomas, which is very wide- nosis is poor [7]. Therefore, early diagnosis and intervention
spread in Southeast Asia and Africa. Since the diagnosis is gen- are of great significance to reduce the morbidity and mortality
erally at an advanced stage, the mortality rate is high [3, 4]. of EAC.
However, in the western world, the incidence of EAC is Epigenetic modification plays an important role in the
increasing at an alarming rate, and the overall 5-year relative occurrence and development of tumors and may cause
survival rate of esophageal cancer diagnosed in the United changes in the expression of tumor-related genes in the early
2 BioMed Research International

stage [8]. Among them, DNA methylation is an important came from the Illumina HiSeq RNASeq platform and the
aspect of epigenetics research, and its relationship between Illumina Infinium Human Methylation 450k platform,
tumors has been a hot research topic in recent years [9–11]. respectively. Meanwhile, when studying the clinical prognosis,
Generally, tumor-suppressor genes are usually hypermethy- samples with incomplete clinical information (including 16
lated and their transcription levels are reduced, while hypo- EAC tissues) had been excluded (Table S1).
methylation of tumor-promoting genes increases their At the same time, we downloaded the EAC and esopha-
expression, thereby jointly promoting the maintenance and geal normal squamous tissue methylation expression data
development of tumors [12]. Since DNA methylation usually set GSE81334 from GEO (https://www.ncbi.nlm.nih.gov/
occurs in the early stages of cancer, and in future studies, we geo/). We selected 56 cases of esophageal normal squamous
are expected to detect EAC early by detecting changes in tissue and 23 cases of EAC in this data set for the next study.
DNA methylation in the blood, so we can detect the occur- The GSE81334 data set was built on the results of the Illu-
rence of cancer earlier by monitoring changes in the gene mina HumanMethylation450 BeadChip.
DNA methylation status [13].
 With the superiority of the big data field, online publicly 2.2. Identification of MDGs. First, the LIMMA package in R
available databases such as The Cancer Genome Atlas software was used to normalize the downloaded data [17].
(TCGA) contain gene expression levels, methylation charac- With the help of the MethylMix R software package, we obtain
teristics, and related clinical prognosis information of various the DNA methylation value of all CpG sites related to each
tumors and normal samples [14]. This allows us to find gene, and the total β value of each gene was calculated by aver-
potential aberrant DNA methylation genes through online aging all the methylation value. Then, the MDGs were identi-
databases. In order to find methylation-driven genes (MDGs) fied with the screening criteria of (∣logFC ∣ >0:2, P < 0:05,
in EAC patients, we used the MethylMix R software package, ∣Cor ∣ >0:3). At the same time, Pheatmap R software package
which is an algorithm based on the β mixed model that can was used to draw the differential distribution map of the
compare the DNA methylation status of tumors and normal expression and methylation of these genes. Finally, we estab-
samples and perform correlation analysis through tran- lished a β-mixed model with these MDGs. All data came
scriptome data to identify the MDGs of the disease. More directly from the TCGA database and did not require the
precisely, the MethylMix package first identifies each CpG approval of the local ethics committee.
site and associates it with the closest gene. Secondly, the
 2.3. Enrichment Analysis and Functional Annotations of the
methylation status of genes is determined by univariate
 MDGs. Gene Ontology (GO) and Kyoto Encyclopedia of
mixed β model. The variable included in the mixed model
 Genes and Genomes (KEGG) pathways of these MDGs were
is the DNA value, which refers to the β value. For a gene, each
 performed using the R package cluster profiler based on the
β mixed value represents a class of patients, and their β
 http://org.Hs.eg.db database [18]. The GO and KEGG analy-
methylation status is determined as a distribution of specific
 sis results were visualized using the enrichplot and the
DNA values. The methylation status of cancer is compared
 GOplot package [19]. In addition, the signal pathway analysis
with the methylation status of normal tissues to screen out
 of MDGs was carried out by ConsensusPathDB, which
genes with different degrees of methylation. Finally, if the
 contains 32 different public databases and describes multiple
methylation level of a gene in the linear regression equation
 functional aspects of genes, proteins, complexes, and metab-
can be significantly correlated with the gene mRNA expres-
 olites [20]. We set the P value < 0.05 as the default setting.
sion, then this is the MDG we need [15, 16].
 In this study, we used bioinformatics methods to extract 2.4. Construction of a Prediction Risk Model Based on the
RNA data, DNA methylation data, and clinical data of EAC MDGs. In order to screen out the MDGs related to the prog-
patients from TCGA. Then, MethylMix R software package nosis of EAC patients, we used Survival R software package to
was utilized to obtain MDGs. In addition, a practical and perform univariate Cox regression analysis, Lasso regression
reliable prognostic risk model was established and verified. analysis, and multivariate Cox regression analysis to
This model can effectively identify patients with poor prog- construct a prognostic risk model [21]. The regression coeffi-
nosis and guide individualized treatment. Finally, based on cient was then multiplied by the corresponding mRNA level
the gene methylation level and the methylation level of to obtain the prognostic risk score. The screening criteria
gene-related sites, survival analysis was conducted to further were all P < 0:05.
study the potential key targets in the model.
 2.5. Assessment of the Accuracy of the Risk Model. According
2. Materials and Methods to the formula, the risk score of each EAC patient in TCGA
 was obtained, and then, the median was taken to divide the
2.1. Data Source. RNA-sequencing data (including 9 normal EAC patients into two groups (high-risk and low-risk). The
esophageal tissues and 78 EAC tissues), DNA methylation data Kaplan-Meier survival analysis in the survival R package
(including 12 normal esophageal tissues and 87 EAC tissues), was used to compare the overall survival (OS) rate of the
and the original clinical data of EAC patients (including 87 two groups [22]. Then, we used the survivalROC package
EAC tissues) were downloaded from the official website of to draw a 3-year dependent receiver operating characteristic
the TCGA database (https://portal.gdc.cancer.gov) (Table S3). (ROC) curve to evaluate the accuracy of the model [23].
Among them, 78 EAC tissues have both RNA-seq and DNA The AUC value is between 1.0 and 0.5. When the AUC is
methylation data. The transcriptome and methylation data closer to 1, the diagnostic effect is better. In addition, the
BioMed Research International 3

 Type

 10

 5

 0

 −5

 Type
 Normal
 Tumor

 (a)

 Figure 1: Continued.

4 BioMed Research International

 Type

 0.8

 0.6

 0.4

 0.2

 Type
 Normal
 Tumor

 (b)

Figure 1: Heat map of MDGs between esophageal adenocarcinoma (EAC) and esophageal normal tissues. The blue rectangular bar at the top
of the figure represents esophageal normal tissues, and the red rectangular bar represents EAC tissues. (a) Heat map of mRNA expression of
MDGs: red: upregulated genes; blue: downregulated genes. (b) Heat map of DNA methylation β value: red: hypermethylated genes; green:
hypomethylated genes.
BioMed Research International 5

 Cor = −0.802 (P value = 1.064e‑18) Mixture model of ZNF518B
 8
 5

 4 6
 ZNF518B expression

 Density
 3 4

 2
 2

 1
 0
 0 0.00 0.25 0.50 0.75 1.00
 0.2 0.3 0.4 0.5 0.6 0.7 DNA methylation
 ZNF518B methylation
 Mixture component
 1
 2
 (a) (b)
 Cor = −0.763 (P value = 4.789e‑16) Mixture model of ZNF502
 5
 4
 4
 ZNF502 expression

 3
 3
 Density

 2 2

 1
 1

 0
 0 0.00 0.25 0.50 0.75 1.00
 0.3 0.4 0.5 0.6 0.7 DNA methylation
 ZNF502 methylation
 Mixture component
 1
 2
 (c) (d)

Figure 2: Typical examples of MDGs. (a, c) Correlation between methylation level and gene expression: the abscissa is the β value of the DNA
methylation, and the ordinate represents the mRNA expression of the gene. Cor is the correlation coefficient. (b, d) Distribution of
methylation level of MDGs: red curve: the methylation level of EAC tissue; green curve: the methylation level of normal tissue; 1: normal
tissue; 2: tumor tissue.

clinical characteristics (age, gender, stage, T, M, and N) and 2.7. Survival Analysis of MDGs and Related Sites in the Risk
risk score were combined to perform univariate Cox analysis, Model. In order to evaluate the independent prognostic
and multivariate analysis was then performed to further evaluation of each MDG in the risk model, we conducted sur-
determine whether the risk score was an independent risk vival analysis on the methylation level of each MDG and per-
factor. At the same time, a stratified analysis was carried formed Kaplan-Meier curve analysis through the survival R
out according to the clinical pathological characteristics of package. In addition, we used the Perl software package to
the patient’s gender, tumor grade, and stage. extract methylation-related sites from the methylation data
 of EAC patients downloaded by TCGA. We combined meth-
2.6. Validation of the Methylation Risk Model through the ylation sites with corresponding transcriptome data to assess
GEO Data Set. The GSE81334 data set was used to verify the effect of methylation sites on their expression. ∣Cor ∣ >
the difference in methylation levels of the four MDGs in 0:45 was considered to be highly correlated [24]. We
the model between normal esophageal squamous tissue and performed a prognostic survival analysis for each highly cor-
EAC. Meanwhile, each sample was scored by the model related methylation site and drew a Kaplan-Meier curve
formula to verify the wide applicability of the model in tumor through the survival R package. P < 0:05 was considered
and normal samples. statistically significant.
6 BioMed Research International

 P value
 Embryonic organ development
 Embryonic organ morphogenesis
 Regionalization
 Sulfur compound biosynthetic process
 Ear morphogenesis

 BP
 Cell fate specification
 Feeding behavior
 Linoleic acid metabolic process
 0.02
 Alpha−linolenic acid metabolic process
 Serine family amino acid catabolic process
 Integral component of synaptic membrane
 Presynaptic membrane
 Intrinsic component of synaptic membrane
 Integral component of presynaptic membrane
 Intrinsic component of presynaptic membrane

 CC
 Rough endoplasmic reticulum 0.04
 Neuron projection terminus
 Intercellular bridge
 Lateral element
 Calyx of Held
 Neuropeptide receptor activity
 RNA polymerase II activating transcription factor binding
 Neurotransmitter binding 0.06
 Ferrous iron binding
 Galanin receptor activity

 MF
 Amine binding
 Serotonin binding
 Fatty acid synthase activity
 Protein serine/threonine phosphatase inhibitor activity
 Glutathione binding
 0.02 0.04 0.06
 Gene ratio
 Count
 5
 10
 15
 (a)
 GO:
 71 0048
 0 090 562
 GO:0
 GO

 ID Description
 471

 :00
 0042

 GO:0048562 Embryonic organ morphogenesis
 436
 5

 GO:0043651 Linoleic acid metabolic process
 1
 GO:

 GO:0048568 Embryonic organ development
 GO:

 GO:0003002 Regionalization
 72

 0048

 GO:0036109 Alpha−linolenic acid metabolic process
 442 0

 568

 GO:0044272 Sulfur compound biosynthetic process
 O:0 G

 GO:0042471 Ear morphogenesis
 GO
 109 030
 :00 GO:0009071 Serine family amino acid catabolic process
 0036 02
 GO:

 z-score

 Decreasing Increasing
 LogFC
 Upregulated
 (b)

 Figure 3: Continued.
BioMed Research International 7

 ZNF614
 ZNF67

 ZNF43
 ZNF
 ZNF
 ZN
 ZN
 logFC

 ZN 82

 F47

 583
 ZN 5

 568
 F5
 0

 F7

 5
 ZN 879

 F5

 69
 ZN S1

 1
 90
 F8
 FA 3

 F
 ZN F52

 D 0
 Z

 F7 8
 ZN
 N
 ZN F25
 ZN F350 7
 ZN F682
 ZNF F793
 ZNF 334
 ZNF8 492
 GSTM 13
 ZNF354 2
 C
 ZNF418
 ZNF429
 SLC6A11
 ZNF347
 ZFP82
 ZNF677
 GNB4
 GLDC
 3
 GSTM 65
 ZNF6 701
 ZNF 254
 ZNF F578
 ZN NAI1 6
 G F25 8
 ZN F20
 ZN
 F3 1
 ZN F33

 F 0
 ZN 0
 N

 BH 708
 Z

 GP T
 M
 X7

 ZN 4
 AD 2
 CY
 H

 3

 2
 5
 F8

 ZNF721
 ID

 L2
 VL

 AMT
 SRSF8

 BST2
 ELOV
 ELO

 GO terms
 Herpes simplex virus 1 infection Glutathione metabolism
 GABAergic synapse Fatty acid elongation
 Biosynthesis of unsaturated fatty acids Glycine, serine and threonine metabolism
 Fatty acid metabolism

 (c)

Figure 3: Functional annotation and enrichment analysis of MDGs in EAC. (a) GO analysis is divided into three functional groups: biological
process (BP), cell component (CC), and molecular function (MF). The scatter plot shows the top 10 important GO items. (b) GO analysis of
significant enrichment items of MDGs in different functional groups. (c) The distribution of MDGs in different KEGG enrichment groups.

 Dimathylglycine dehydrogenase deficiency
 Non-ketotic hyperglycinemia
 Biosynthesis of unsaturated fatty acids - Homo sapiens (human)
 Gene expression (transcription)

 RNA polymerase II transcription
 3-phosphoglycerate dehydrogenase deficiency Dihydropyrimidine dehydrogenase deficiency (DHPD)
 Alpha-linolenic (omega3) acid linoleic (omega6) acid metabolism
 Dimathylglycine dehydrogenase deficiency
 Glutathione metabolism - Homo sapiens (human) Linoleic acid (LA) metabolism
 Hyperglycinemia, non-ketatic Amine ligand–binding receptors

 Transcriptional regulation of pluripotent stem cells

 Sarcosinemia Glycine and serine metabolism Alpha-linolenic acid (ALA) metabolism
 Generic transcription pathway

 Monoamine GPCRs

 Node label color Node size (# genes) Node color (P value) Edge width (% shared geneas) Edge color (genes from input)
 The node label color 8 genes Hide legend
 denotes the type of
 P < 10−11 1% 41
 the gene sets: 104 genes
 Neighborhood-based set
 Manually curated pathway P < 10−5 50% 20
 Gene ontology category
 Protein complex 1373 genes
 P = 1.0 100% 0

Figure 4: Pathway enrichment analysis of MDGs in EAC by ConsensusPathDB. Node size: number of genes; node color: P value; edge width:
percentage of shared genes; edge color: genes from input.
8 BioMed Research International

 15 15 15 14 12 12 11 10 10 10 9 9 8 6 0 15 13 11 10 8
 13

 8
 10.0
 3
 9
 Partial likelihood deviance

 6

 9.5
 4

 Coefficients
 6
 2
 9.0 8

 5
 7
 2
 11
 0 15
 10

 8.5
 −2
 41
 16

 8.0 −4 14
 12

 −6 −5 −4 −3 −2 −6 −5 −4 −3 −2
 Log ( )
 (a) (b)
 1.00 ++++++ 1.0
 ++ ++
 ++ +
 +
 Survival probability

 0.75 + ++ 0.8
 ++ ++ +
 + + ++ + +
 True positive rate

 0.50 +
 ++ + 0.6
 ++
 ++
 0.25 +
 P = 2.698e−04 0.4

 0.00
 0 1 2 3 4 5 6 0.2
 Time (years)
 Risk 0.0
 + High risk
 + Low risk 0.0 0.2 0.4 0.6 0.8 1.0
 False positive rate

 Risk score (AUC = 0.868) T (AUC = 0.587)
 Age (AUC = 0.545) M (AUC = 0.568)
 Gender (AUC = 0.495) N (AUC = 0.715)
 Stage (AUC = 0.771)

 (c) (d)

Figure 5: Prognostic risk model based on EAC MDGs. (a) The choice of the adjustment parameter λ by Lasso-penalized Cox regression
analysis. (b) Each curve represents a MDG. Tenfold cross-validation was utilized to calculate optimal lambda, which leads to minimum
mean cross-validation error. The vertical axis represents the mean-square error, while the horizontal axis represents the value of log (λ).
(c) EAC patients were divided into two groups according to the risk model score, and Kaplan-Meier survival curves were compared by
log-rank test. P < 0:001. (d) ROC curve of the 3-year overall survival rate of the risk model.

3. Results Table 1: Multivariate Cox regression analysis of 4 MDGs associated
 with overall survival in EAC patients.
3.1. Identification of MDGs in EAC Patients from TCGA.
Download the methylation data of 87 specimens (78 cancer ID Coef HR HR 95L HR 95H P value
specimens and 9 normal specimens) and 99 specimens (87 GPBAR1 7.29573 1473.992 9.667861 224729.3 0.004447
cancer specimens and 12 normal specimens) from TCGA.
 OLFM4 -4.06339 0.017191 0.000272 1.086215 0.054748
First, we performed normalization and difference analysis
on the downloaded data through the LIMMA software pack- FOXI2 6.166957 476.7333 8.376708 27131.74 0.002783
age. Then, we assessed the correlation between the methyla- CASP10 13.10559 491681.2 523.6679 4.62E+08 0.000175
tion level and the expression level of each gene based on Abbreviation: HR: hazard ratio.
the MethylMix software package. With the standard of ∣
logFC ∣ >0:2, P < 0:05, and ∣Cor ∣ >0:3, we screened 273
MDGs related to EAC, including 250 hypermethylated genes

BioMed Research International 9

 10
 8

 Risk score
 6
 4
 2
 0
 0 20 40 60 80
 Patients (increasing risk socre)
 High risk
 Low risk
 (a)
 Survival time (years)

 6
 5
 4
 3
 2
 1
 0
 0 20 40 60 80
 Patients (increasing risk socre)
 Dead
 Alive
 (b)
 Type
 0.8
 CASP10
 0.7

 GPBAR1 0.6
 0.5
 OLFM4 0.4
 0.3
 FOXI2
 0.2
 Type
 High
 Low
 (c)

Figure 6: The prognostic value of the risk model based on 4 MDGs in EAC. (a) The risk score of each EAC patient in TCGA increases from
left to right. (b) The survival time and survival status of each EAC patient in TCGA. (c) The expression levels of MDGs in the risk model in the
low-risk group and the high-risk group.

and 23 hypomethylated genes (Table S2). The heat maps of in cell development, DNA binding regulation, and transcrip-
mRNA expression and DNA methylation β values of these tion regulation. GO analysis showed that in terms of BP, these
MDGs are shown in Figures 1(a) and 1(b). genes were enriched in “embryonic organ development,
 At the same time, the MethylMix R software package was embryonic organ morphogenesis, pattern specification pro-
used to draw a distribution map of the methylation degree of cess.” In MF, genes were mainly involved in “DNA-binding
MDGs. The two genes with the highest correlation between transcription activator activity, RNA polymerase II-specific,
these genes were selected as shown in Figure 2. The distribu- DNA-binding transcription repressor activity, RNA polymer-
tion of the degree of methylation indicated that in the normal ase II-specific and RNA polymerase II activating transcription
lung tissue group, ZNF518B and ZNF502 presented a hypo- factor binding.” In terms of CC, “integral component of
methylated state, while in the EAC cancer group, ZNF518B presynaptic membrane” was their main function (Figures 3(a)
and ZNF502 presented a hypermethylated state. In addition, and 3(b)).
Figures 2(a) and 2(c) show the correlation between the meth- KEGG showed that these MDGs were mainly enriched in
ylation levels of ZNF518B and ZNF502 and their gene expres- “Herpes simplex virus 1 infection.” Through the analysis of
sions, respectively. the ConsensusPathDB approach, the methylation-driven
 genes were mainly enriched in the gene expression, RNA
3.2. Functional Annotation and Enrichment Analysis of MDGs polymerase II transcription, and generic transcription path-
in EAC. In order to further explore the molecular mechanism way (Figure 4).
of these MDGs during the progress of EAC, we used the R
clusterProfiler software package and the ConsensusPathDB 3.3. Establishment of a Risk Model Based on EAC MDGs. Uni-
online database for function and pathway enrichment analy- variate Cox regression analysis was performed on the
sis. Functional analysis showed that they were mainly involved obtained MDGs, and 16 MDGs related to EAC’s survival
10 BioMed Research International

 P value Hazard ratio

 Age 0.194 0.983 (0.957−1.009)

 Gender 0.346 0.598 (0.205−1.743)

 Stage 0.001 2.035 (1.322−3.135)

 T 0.283 1.304 (0.803−2.117)

 M 0.052 2.459 (0.992−6.095)

 N 0.117 1.471 (0.907−2.385)

 Risk score 0.001 1.057 (1.022−1.092)

 0 1 2 3 4 5 6
 Hazard ratio
 (a)

 P value Hazard ratio

 Age 0.201 0.980 (0.950−1.011)

 Gender 0.020 0.221 (0.062−0.791)

 Stage 0.003 5.244 (1.763−15.599)

 T 0.149 0.617 (0.320−1.189)

 M 0.097 0.194 (0.028−1.346)

 N 0.287 0.673 (0.324−1.396)

 Risk score 0.001 1.060 (1.023−1.098)

 0 5 10 15
 Hazard ratio
 (b)

Figure 7: Cox analysis on the impact of risk score and clinical characteristics on the survival of EAC patients. (a) Forest plot of univariate Cox
regression independent prognostic analysis of EAC patients. (b) Forest plot of independent prognostic analysis of multivariate Cox regression
for EAC patients. Hazard ratio > 1 represents risk factors for survival and hazard ratio < 1 represents protective factors for survival. T: tumor,
N: node, M: metastasis.

were screened out, and the model was further optimized Meanwhile, we established a similar prognostic model
through Lasso regression analysis and multivariate Cox based on mRNA expression levels. As shown in Supplemen-
regression analysis (Figures 5(a) and 5(b)). Finally, four tary Figure 1, although the prognosis model based on mRNA
prognostic-related MDGs (GPBAR1, OLFM4, FOXI2, and expression can also distinguish the prognosis of the high- and
CASP10) were supposed to establish a prognostic risk model low-risk groups, its AUC value was 0.727, which was lower
(Table 1). Risk score = ð7:2957 × GPBAR1Þ + ð−4:0634 × than the previous model, indicating that its prediction
OLFM4Þ + ð6:1670 × FOXI2Þ + ð13:1056 × CASP10Þ. Next, accuracy was lower than that of the methylation risk model.
the EAC patients in TCGA were scored according to the At the same time, Figures 6(a) and 6(b), respectively,
scoring formula, the median was selected as the cutoff value, showed the risk score, survival time, and survival status of
and EAC patients were then divided into high-risk groups each EAC patient. It can be seen from Figure 6 that as the
(39 cases) and low-risk groups (39 cases). Kaplan-Meier risk score increased, the survival time of EAC patients
survival analysis results show that patients in the high-risk decreased and the proportion of deaths gradually increased.
group had poor survival rates (P < 0:01) (Figure 5(c)). Figure 6(c) showed the methylation levels of the 4 MDGs in
 the low-risk group and the high-risk group.
3.4. The Accuracy and Reliability of the Risk Model. From At the same time, in order to further verify the indepen-
Figure 5(d), the AUC value of the model’s 3-year overall dent prognostic value of this model, we extracted EAC
survival rate was 0.868. Compared with other clinical traits, patients with complete clinical information. Combining each
it can better reflect the prognosis of EAC patients. patient’s age, gender, stage, and pathological T, M, N, and
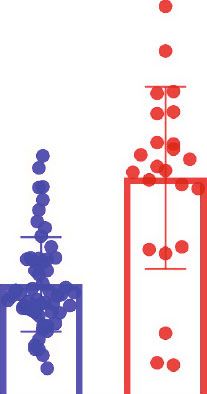
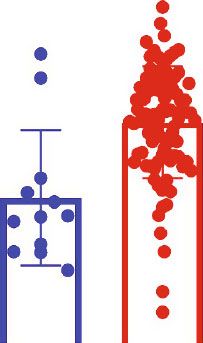
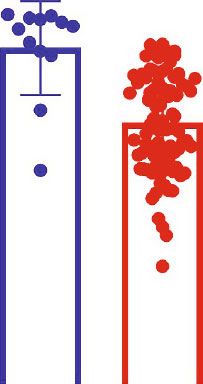
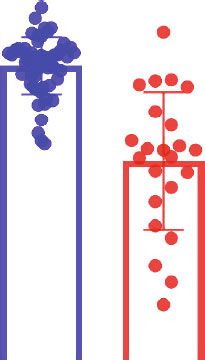
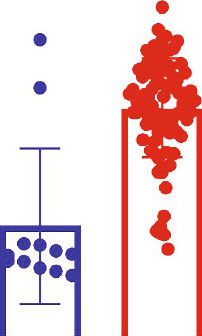
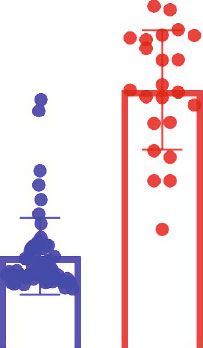
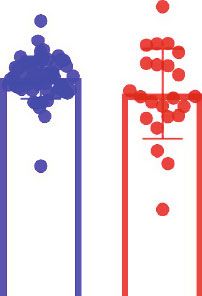
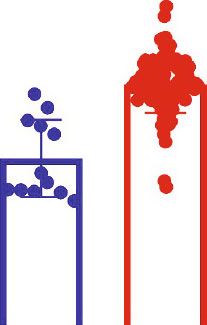
BioMed Research International

 FOX12 methylation level in TCGA GPBAR1 methylation level in TCGA
 Methylation risk level in TCGA

 0
 5
 10
 15
 0.4
 0.5
 0.6
 0.7
 0.8
 0.9

 0.0
 0.2
 0.4
 0.6
 0.8
 1.0
 Normal (n = 12) Normal (n = 12) Normal (n = 12)

 (c)
 (a)

 (e)
 ⁎⁎
 ⁎⁎
 ⁎⁎

 Tumor (n = 87) Tumor (n = 87) Tumor (n = 87)

 GPBAR1 methylation level in GSE81334 CASP10 methylation level in TCGA OLFM4 methylation level in TCGA

 0.4
 0.6
 0.8
 1.0
 0.0
 0.2
 0.4
 0.6
 0.8

 0.0
 0.1
 0.2
 0.3
 0.4

Figure 8: Continued.
 Normal (n = 56) Normal (n = 12) Normal (n = 12)

 (f)
 (b)

 (d)

 ⁎
 ⁎⁎

 ⁎⁎

 Tumor (n = 23) Tumor (n = 87) Tumor (n = 87)
 11
12 BioMed Research International

 OLFM4 methylation level in GSE81334

 FOX12 methylation level in GSE81334
 ⁎⁎ ⁎⁎
 0.9 1.0

 0.8 0.8

 0.7 0.6

 0.6 0.4

 0.5 0.2

 0.4 0.0

 Normal (n = 56)

 Tumor (n = 23)
 Normal (n = 56)

 Tumor (n = 23)
 (g) (h)
 ⁎⁎
 CASP10 methylation level in GSE81334

 ⁎⁎
 0.9

 Methylation risk level in GSE81334
 17

 0.8 16

 0.7 15

 0.6 14

 0.5 13

 0.4 12
 Normal (n = 56)

 Tumor (n = 23)

 Normal (n = 56)

 Tumor (n = 23)

 (i) (j)

Figure 8: Validate the risk model with the GEO data set. (a–d) DNA methylation status of GPBAR1, OLFM4, FOXI2, and CASP10 in normal
and EAC cancer tissues in the TCGA database. (e) The risk values of normal and EAC cancer tissues in the TCGA database. (f–i) DNA
methylation status of GPBAR1, OLFM4, FOXI2, and CASP10 in normal and EAC cancer tissues in the GSE81334 data set. (j) GSE81334
data set normal and EAC cancer tissue risk values. Two-tailed P value by unpaired t test, ∗∗ P < 0:0001, ∗ P < 0:05.

risk scores, univariate and multivariate Cox regression anal- 3.6. Survival Analysis of MDGs in the Risk Model. To further
yses were performed (Figures 7(a) and 7(b)). Both univariate explore the independent prognostic value of each MDG in
and multivariate Cox regression analyses showed that the the risk model, we combined the methylation level of each
pathological stage and the prognostic risk score can be used MDG with the survival information of EAC patients in
as independent prognostic factors. TCGA and drew the survival curve. It can be observed in
 Figures 9(a)–9(d) that only the methylation level of OLFM4
 had an impact on the survival prognosis. The patient group
3.5. Verification of the Risk Model by the GEO Data Set. In with a high OLFM4 methylation level had a better survival
order to verify the DNA methylation level of MDGs in the prognosis than the patient group with a low OLFM4 methyl-
risk model and the reliability of the risk model, we chose ation level. There was a statistical difference between the two
the data set GSE81334 in GEO. As shown in Figures 8(f)– groups (P < 0:05). At the same time, there was no significant
8(i), in the EAC tumor group, FOXI2 was in a hypermethy- differences in the survival prognosis of EAC patients grouped
lated state, while in the normal group, OLFM4 and CASP10 based on the GPBAR1, FOXI2, and CASP10 methylation
were in a hypermethylated state. These results maintained levels. This indicated that OLFM may have an independent
the consistency of the results of the TCGA cohort study prognostic correlation for EAC patients.
(Figures 8(a)–8(d)). Interestingly, after scoring the EAC
samples and normal esophagus samples in GSE81334, the
EAC risk value was significantly higher than that of the 3.7. Correlation Analysis between Methylation Sites and
normal esophagus group (Figure 8(j)), which was consistent Corresponding Gene Expression Levels. To make a thorough
with the results of the TCGA cohort. inquiry of the specific role of methylation sites for each
BioMed Research International 13

 Survival curve (P = 0.348) Survival curve (P = 0.017)
 1.0 1.0

 0.8 0.8
 Survival rate

 Survival rate
 0.6 0.6

 0.4 0.4

 0.2 0.2

 0.0 0.0
 0 2 4 6 8 10 0 2 4 6 8 10
 Time (year) Time (year)
 GPBAR1 hypermethylation OLFM4 hypermethylation
 GPBAR1 hypomethylation OLFM4 hypomethylation
 (a) (b)
 Survival curve (P = 0.657) Survival curve (P = 0.367)
 1.0 1.0

 0.8 0.8
 Survival rate

 Survival rate

 0.6 0.6

 0.4 0.4

 0.2 0.2

 0.0 0.0
 0 2 4 6 8 10 0 2 4 6 8 10
 Time (year) Time (year)
 FOX12 hypermethylation CASP10 hypermethylation
 FOX12 hypomethylation CASP10 hypomethylation
 (c) (d)

Figure 9: Kaplan-Meier survival curve of MDGs in the risk model. (a) According to the GPBAR1 methylation level, the EAC patients in the
TCGA were divided into high and low groups and their survival curves were drawn. (b) According to the OLFM4 methylation level, the EAC
patients in the TCGA were divided into high and low groups and their survival curves were drawn. (c) According to the FOXI2 methylation
level, the EAC patients in the TCGA were divided into high and low groups and their survival curves were drawn. (d) According to the
CASP10 methylation level, the EAC patients in the TCGA were divided into high and low groups and their survival curves were drawn.

MDG in the risk model, we used Perl software to obtain the CASP10 (∣Cor ∣ >0:45) (Figures 10(f)–10(i)). This means that
methylation site information about GPBAR1, OLFM4, it is possible that these highly correlated sites have a compre-
FOXI2, and CASP10. We found that the GPBAR1 gene had hensive effect on the corresponding genes’ function.
8 sites, of which only cg22678065 had a high correlation with After that, we performed survival analysis on the highly
GPBAR1 (Figure 10(a)). The OLFM4 gene had 8 sites, of correlated sites of genes. Using P < 0:05 as an important
which cg24932628 and cg12582008 were highly related to indicator of prognosis, we found that there were only two
OLFM4 (Figures 10(b) and 10(c)). The FOXI2 gene had 21 prognostic-related sites in these genes: cg24932628 and
sites, of which cg26115633 and cg13929328 were highly cg12582008. The high methylation level of these two sites had
related to FOXI2 (Figures 10(d) and 10(e)). The CASP10 a better prognosis (Figure 11). This means that cg24932628
gene had 10 sites, of which cg12105450, cg04781494, and cg12582008 may have independent prognostic effects on
cg24401737, and cg24599065 were highly correlated with EAC patients.
14 BioMed Research International

 Cor = −0.522 (P value = 3.051e‑07) Cor = −0.551 (P value = 4.501e‑08)

 4
 12

 10
 3
 GPBAR1 expression

 OLFM4 expression
 8

 2 6

 4
 1
 2

 0 0
 0.5 0.6 0.7 0.8 0.9 1.0 0.2 0.3 0.4 0.5 0.6 0.7 0.8
 cg22678065 methylation cg24932628 methylation
 (a) (b)
 Cor = −0.472 (P value = 5.241e‑06) Cor = −0.51 (P value = 6.282e‑07)

 12
 1.5
 10
 OLFM4 expression

 FOX12 expression

 8
 1.0
 6

 4 0.5

 2

 0 0.0
 0.2 0.4 0.6 0.8 0.0 0.2 0.4 0.6 0.8
 cg12582008 methylation cg26115633 methylation
 (c) (d)
 Cor = −0.481 (P value = 3.152e‑06) Cor = −0.608 (P value = 6.5931e‑10)

 1.5 4
 CASP10 expression
 FOX12 expression

 1.0 3

 2
 0.5

 1

 0.0
 0.2 0.4 0.6 0.8 0.1 0.2 0.3 0.4 0.5 0.6 0.7
 cg13929328 methylation cg12105450 methylation
 (e) (f)

 Figure 10: Continued.
BioMed Research International 15

 Cor = −0.607 (P value = 7.504e‑10) Cor = −0.535 (P value = 1.316e‑07)

 4 4
 CASP10 expression

 CASP10 expression
 3 3

 2 2

 1 1

 0.1 0.2 0.3 0.4 0.5 0.6 0.7 0.2 0.4 0.6 0.8
 cg04781494 methylation cg24401737 methylation
 (g) (h)
 Cor = −0.502 (P value = 9.838e‑07)

 4
 CASP10 expression

 3

 2

 1

 0.1 0.2 0.3 0.4 0.5 0.6
 cg24599065 methylation
 (i)

Figure 10: Gene methylation sites and gene expression level in risk model. (a) The correlation between methylation sites and gene GPBAR1
expression. (b, c) The correlation between methylation sites and gene OLFM4 expression. (d, e) The correlation between methylation sites and
gene FOXI2 expression. (f–i) The correlation between methylation sites and gene CASP10 expression.

4. Discussion driven genes to predict the prognosis of EAC [29]. Therefore,
 it is of great significance to establish a risk model for early
Esophageal cancer (EC) is a common malignant tumor in the diagnosis and survival of EAC.
digestive system, and its morbidity and mortality rank With the rapid development of bioinformatics and the
among the top ten in China [25]. Esophageal squamous cell sharing of online databases, we can use big data to study
carcinoma (ESCC) and esophageal adenocarcinoma (EAC) the molecular characteristics and genetic information about
are the main histological subtypes of EC. Drinking and EC and provide an effective basis for seeking potential
smoking are the two main risk factors for ESCC [26], and biomarkers. Epigenetics refers to changes in gene expression
the pathogenesis of EAC is mainly related to the abnormal that can be inherited without relying on changes in DNA
proliferation of esophageal epithelial cells caused by gastro- sequence [8]. DNA methylation is one of the epigenetic mod-
esophageal reflux disease (GERD) [27]. Despite surgical ifications; it controls cell proliferation, differentiation, and
treatment, radiotherapy, chemotherapy, and the use of apoptosis in eukaryotes and directly or indirectly controls
targeted drugs, the prognosis of EC is still very poor [28]. tumorigenesis [30]. In particular, hypermethylation or hypo-
Recent studies have demonstrated that lung cancer and lung methylation in the promoter region of a gene will affect the
nodules can be distinguished early by detecting changes in expression of the corresponding mRNA, thereby affecting
DNA methylation in the blood. This also provides support different stages of tumor development. Recent studies have
for us to establish a risk model based on methylation- shown that DNA methylation has been widely used in the
16 BioMed Research International

 Survival curve (P = 0.184) Survival curve (P = 0.006)
 1.0 1.0

 0.8 0.8
 Survival rate

 Survival rate
 0.6 0.6

 0.4 0.4

 0.2 0.2

 0.0 0.0
 0 2 4 6 8 10 0 2 4 6 8 10
 Time (year) Time (year)
 cg2267865 hypermethylation cg24932628 hypermethylation
 cg2267865 hypomethylation cg24932628 hypomethylation
 (a) (b)
 Survival curve (P = 0.001) Survival curve (P = 0.947)
 1.0 1.0

 0.8 0.8
 Survival rate

 Survival rate

 0.6 0.6

 0.4 0.4

 0.2 0.2

 0.0 0.0
 0 2 4 6 8 10 0 2 4 6 8 10
 Time (year) Time (year)
 cg12582008 hypermethylation cg26115633 hypermethylation
 cg12582008 hypomethylation cg26115633 hypomethylation
 (c) (d)

 Figure 11: Continued.
BioMed Research International 17

 Survival curve (P = 0.934) Survival curve (P = 0.909)
 1.0 1.0

 0.8 0.8
 Survival rate

 Survival rate
 0.6 0.6

 0.4 0.4

 0.2 0.2

 0.0 0.0
 0 2 4 6 8 10 0 2 4 6 8 10
 Time (year) Time (year)
 cg13929328 hypermethylation cg12105450 hypermethylation
 cg13929328 hypomethylation cg12105450 hypomethylation
 (e) (f)
 Survival curve (P = 0.206) Survival curve (P = 0.393)
 1.0 1.0

 0.8 0.8
 Survival rate

 Survival rate

 0.6 0.6

 0.4 0.4

 0.2 0.2

 0.0 0.0
 0 2 4 6 8 10 0 2 4 6 8 10
 Time (year) Time (year)
 cg04781494 hypermethylation cg24401737 hypermethylation
 cg04781494 hypomethylation cg24401737 hypomethylation
 (g) (h)

 Figure 11: Continued.
18 BioMed Research International

 Survival curve (P = 0.585)
 1.0

 0.8

 Survival rate
 0.6

 0.4

 0.2

 0.0
 0 2 4 6 8 10
 Time (year)
 cg24599065 hypermethylation
 cg24599065 hypomethylation
 (i)

Figure 11: Kaplan-Meier survival curve of relevant methylation sites. (a) GPBAR1-related methylation site survival curve. (b, c) OLFM4-
related methylation site survival curve. (d, e) FOXI2-related methylation site survival curve. (f–i) CASP10-related methylation site survival
curve.

diagnosis and prognosis of different cancer types [31]. Previ- OLFM4, FOXI2, and CASP10 can be used as an independent
ous studies have shown that abnormal methylation patterns prognostic factor for EAC.
of genes (APC, CdH1, CDKN2A, and ESR1) are not only GPBAR1 (G protein-coupled bile acid receptor 1) is a
limited to adenocarcinoma tissues but also found in precan- member of the G protein-coupled receptor (GPCR) superfam-
cerous BE tissues. This indicates that DNA hypermethylation ily. GPBAR1 is implicated in the suppression of macrophage
is an early epigenetic change in the multistep progression of functions and regulation of energy homeostasis by bile acids
EAC [32]. In addition, the methylation frequency of multiple [35]. A previous report stated that GPBAR1 is highly expressed
genes (APC, ID4, MGMT, RUNX3, SFRP1, TIMP3, and in human gastric adenocarcinoma and is positively correlated
TMEFF2) found in metaplastic BE is similar to EAC. It shows with the expression of the epithelial-mesenchymal transition
that gene methylation occurs in the early stage of Barrett’s (EMT) marker N-cadherin. It suggests that GPBAR1 may be
metaplasia [33]. Therefore, DNA methylation may become involved in gastric adenocarcinoma [36]. OLFM4 (olfactome-
one of the methods for early diagnosis of EAC. Recently, a din 4) is a secreted glycoprotein, usually called the antiapopto-
study on EC established an epigenetic signature to evaluate tic molecule GW112 [37]. Olfm4 is frequently upregulated in a
the prognosis of EC [34]. However, the prognostic model variety of human tumors, and the latest research shows that
for EAC alone is still lacking. Therefore, it is still of great the low expression of OLFM4 is independently associated with
significance to discuss the epigenetic changes of EAC and the lymph node metastasis of EAC, so it may prove to be a new
the molecular mechanism of its progress separately. biomarker [38]. FOXI2 plays a role during development,
 In our current study, we screened out 273 MDGs between especially in the early stages of craniofacial development
EAC patients and normal samples from TCGA. In order to [39]. Its methylation status may be associated with an
examine the functional enrichment of these MDGs, we per- increased risk of oral cancer and colorectal cancer [40, 41].
formed GO and KEGG analysis. They had abundant molecu- CASP10 belongs to the caspase class of promoters, which is
lar functions (Mf) with DNA binding transcription activator a homolog of caspase-8 and plays an important role in cell
activity. In cellular components (CC), these genes showed apoptosis. CASP10 can inhibit the occurrence of tumors by
abundant expression in the components of the presynaptic inhibiting ATP-citrate lyase-mediated and epigenetic repro-
membrane. In addition, the biological process (BP) showed gramming [42].
that they were mainly manifested in the process of embryonic For the MDGs in the risk model, we further studied the
organ morphogenesis. These functions not only showed the effect of their individual gene methylation levels on the prog-
functions enriched by these MDGs but also showed how nosis of EAC patients. The results showed that only OLFM4
abnormal DNA methylation affects genes. had an effect on the prognosis of EAC survival, because DNA
 To further establish a prognostic risk mode, we used uni- methylation mainly occurs on CpG islands of genomic DNA.
variate Cox, Lasso regression, and multiple Cox regression Therefore, we also did a survival analysis on the relevant sites
analyses to screen out MDGs related to survival. The results of each methylation driver gene. We found that only two
showed that a risk model consisting of the four genes GPBAR1, related sites of OLFM4 in these genes, cg24932628 and
BioMed Research International 19

cg12582008, have an impact on the prognosis. This result [5] R. L. Siegel, K. D. Miller, and A. Jemal, “Cancer statistics,
also confirmed that OLFM4 may affect the occurrence, devel- 2020,” CA: a Cancer Journal for Clinicians, vol. 70, no. 1,
opment and patient prognosis of cancer through the abnor- pp. 7–30, 2020.
mal methylation of these two sites. [6] R. C. Fitzgerald, M. di Pietro, K. Ragunath et al., “British Soci-
 Compared with previous studies, we separately screened ety of Gastroenterology guidelines on the diagnosis and man-
the risk model of EAC MDGs on the prognosis of EAC agement of Barrett's oesophagus,” Gut, vol. 63, no. 1, pp. 7–42,
patients. The accuracy and reliability of the model are 2014.
verified, and the results show that the model has a certain [7] H. Kuwano, Y. Nishimura, T. Oyama et al., “Guidelines for
predictability for the prognosis of EAC patients. diagnosis and treatment of carcinoma of the esophagus April
 2012 edited by the Japan Esophageal Society,” Esophagus,
 vol. 12, no. 1, pp. 1–30, 2015.
Data Availability
 [8] M. Rodriguez-Paredes and M. Esteller, “Cancer epigenetics
https://portal.gdc.cancer.gov,https://www.ncbi.nlm.nih.gov/geo/. reaches mainstream oncology,” Nature Medicine, vol. 17,
 no. 3, pp. 330–339, 2011.
 [9] A. Bird, “DNA methylation patterns and epigenetic memory,”
Conflicts of Interest Genes & Development, vol. 16, no. 1, pp. 6–21, 2002.
The authors declare that they have no known competing [10] J. Liu, H. Zhao, Y. Huang et al., “Genome-wide cell-free DNA
financial interests or personal relationships that could have methylation analyses improve accuracy of non-invasive diag-
appeared to influence the work reported in this paper. nostic imaging for early-stage breast cancer,” Molecular Can-
 cer, vol. 20, no. 1, p. 36, 2021.
 [11] H. Y. Huang, J. Li, Y. Tang et al., “MethHC 2.0: information
Authors’ Contributions repository of DNA methylation and gene expression in human
 cancer,” Nucleic Acids Research, vol. 49, no. D1, pp. D1268–
Yuhua Chen and Jinjie Wang contributed equally to this
 D1275, 2021.
work.
 [12] H. Akhavan-Niaki and A. A. Samadani, “DNA methylation
 and cancer development: molecular mechanism,” Cell Bio-
Supplementary Materials chemistry and Biophysics, vol. 67, no. 2, pp. 501–513, 2013.
Supplementary Figure 1: prognostic risk model based on [13] K. Ennour-Idrissi, D. Dragic, E. Issa et al., “DNA methylation
 and breast cancer risk: an epigenome-wide study of normal
mRNA expression levels. (A) The expression levels of genes
 breast tissue and blood,” Cancers, vol. 12, no. 11, p. 3088, 2020.
in the risk model in the low-risk group and the high-risk
group. (B) EAC patients were divided into two groups [14] G. F. Gao, J. S. Parker, S. M. Reynolds et al., “Before and after:
 comparison of legacy and harmonized TCGA genomic data
according to the risk model score, and Kaplan-Meier survival
 commons' data,” Cell Systems, vol. 9, no. 1, pp. 24–34.e10,
curves were compared by log-rank test. P < 0:001. (C) ROC 2019.
curve of the 3-year overall survival rate of the risk model.
 [15] O. Gevaert, R. Tibshirani, and S. K. Plevritis, “Pancancer anal-
Table S1: clinical information of EAC patients in TCGA
 ysis of DNA methylation-driven genes using MethylMix,”
database. Table S2: methylation-driven genes (MDGs) in Genome Biology, vol. 16, no. 1, p. 17, 2015.
EAC. 250 hypermethylated genes and 23 hypomethylated
 [16] O. Gevaert, “MethylMix: an R package for identifying DNA
genes are shown in Table S2. The table shows the average methylation-driven genes,” Bioinformatics, vol. 31, no. 11,
expression of each MDG in normal and tumor tissues and pp. 1839–1841, 2015.
the statistical relationship between the two groups. Table
 [17] M. E. Ritchie, B. Phipson, D. Wu et al., “limma powers differ-
S3: the barcodes of each TCGA file. S4: the R codes of the ential expression analyses for RNA-sequencing and microar-
main step. (Supplementary Materials) ray studies,” Nucleic Acids Research, vol. 43, no. 7, p. e47, 2015.
 [18] G. Yu, L. G. Wang, Y. Han, and Q. Y. He, “clusterProfiler: an R
References package for comparing biological themes among gene clus-
 ters,” OMICS, vol. 16, no. 5, pp. 284–287, 2012.
 [1] F. Bray, J. Ferlay, I. Soerjomataram, R. L. Siegel, L. A. Torre,
 and A. Jemal, “Global cancer statistics 2018: GLOBOCAN esti- [19] W. Walter, F. Sanchez-Cabo, and M. Ricote, “GOplot: an R
 mates of incidence and mortality worldwide for 36 cancers in package for visually combining expression data with func-
 185 countries,” CA: a Cancer Journal for Clinicians, vol. 68, tional analysis,” Bioinformatics, vol. 31, no. 17, pp. 2912–
 no. 6, pp. 394–424, 2018. 2914, 2015.
 [2] S. Ohashi, S.’. Miyamoto, O. Kikuchi, T. Goto, Y. Amanuma, [20] A. Kamburov, K. Pentchev, H. Galicka, C. Wierling,
 and M. Muto, “Recent advances from basic and clinical studies H. Lehrach, and R. Herwig, “ConsensusPathDB: toward a
 of esophageal squamous cell carcinoma,” Gastroenterology, more complete picture of cell biology,” Nucleic Acids Research,
 vol. 149, no. 7, pp. 1700–1715, 2015. vol. 39, suppl_1, pp. D712–D717, 2011.
 [3] C. C. Abnet, M. Arnold, and W. Q. Wei, “Epidemiology of [21] I. S. Lossos, D. K. Czerwinski, A. A. Alizadeh et al., “Prediction
 esophageal squamous cell carcinoma,” Gastroenterology, of survival in diffuse large-B-cell lymphoma based on the
 vol. 154, no. 2, pp. 360–373, 2018. expression of six genes,” The New England Journal of Medi-
 [4] D. C. Codipilly, Y. Qin, S. M. Dawsey et al., “Screening for cine, vol. 350, no. 18, pp. 1828–1837, 2004.
 esophageal squamous cell carcinoma: recent advances,” Gas- [22] Z. Sun and H. M. Xu, “Identifying the minimum number of
 trointestinal Endoscopy, vol. 88, no. 3, pp. 413–426, 2018. lymph nodes required to ensure adequate pN staging:
20 BioMed Research International

 Kaplan-Meier survival analysis versus Cox regression model,” [38] L. Suzuki, F. J. C. ten Kate, A. W. Gotink et al., “Olfactomedin
 Annals of Surgery, vol. 252, no. 2, pp. 410-411, 2010. 4 (OLFM4) expression is associated with nodal metastases in
[23] C. Combescure, T. V. Perneger, D. C. Weber, J. P. Daures, and esophageal adenocarcinoma,” PLoS One, vol. 14, no. 7, article
 Y. Foucher, “Prognostic ROC curves: a method for represent- e0219494, 2019.
 ing the overall discriminative capacity of binary markers with [39] T. Ohyama and A. K. Groves, “Expression of mouse Foxi class
 right-censored time-to-event endpoints,” Epidemiology, genes in early craniofacial development,” Developmental
 vol. 25, no. 1, pp. 103–109, 2014. Dynamics, vol. 231, no. 3, pp. 640–646, 2004.
[24] T. Hachiya, R. Furukawa, Y. Shiwa et al., “Genome-wide iden- [40] J. P. Foy, C. R. Pickering, V. A. Papadimitrakopoulou et al.,
 tification of inter-individually variable DNA methylation sites “New DNA methylation markers and global DNA hypome-
 improves the efficacy of epigenetic association studies,” NPJ thylation are associated with oral cancer development,” Cancer
 Genomic Medicine, vol. 2, no. 1, p. 11, 2017. Prevention Research (Philadelphia, Pa.), vol. 8, no. 11,
[25] S. Yang, S. Lin, N. Li et al., “Burden, trends, and risk factors of pp. 1027–1035, 2015.
 esophageal cancer in China from 1990 to 2017: an up-to-date [41] S. M. Mitchell, J. P. Ross, H. R. Drew et al., “A panel of genes
 overview and comparison with those in Japan and South methylated with high frequency in colorectal cancer,” BMC
 Korea,” Journal of Hematology & Oncology, vol. 13, no. 1, Cancer, vol. 14, no. 1, p. 54, 2014.
 p. 146, 2020. [42] R. Kumari, R. S. Deshmukh, and S. Das, “Caspase-10 inhibits
[26] T. L. Vaughan, S. Davis, A. Kristal, and D. B. Thomas, “Obe- ATP-citrate lyase-mediated metabolic and epigenetic repro-
 sity, alcohol, and tobacco as risk factors for cancers of the gramming to suppress tumorigenesis,” Nature Communica-
 esophagus and gastric cardia: adenocarcinoma versus squa- tions, vol. 10, no. 1, p. 4255, 2019.
 mous cell carcinoma,” Cancer Epidemiology, Biomarkers &
 Prevention, vol. 4, pp. 85–92, 1995.
[27] Y. M. Yang, P. Hong, W. W. Xu, Q. Y. He, and B. Li,
 “Advances in targeted therapy for esophageal cancer,” Signal
 Transduction and Targeted Therapy, vol. 5, no. 1, p. 229, 2020.
[28] Q. L. Xu, H. Li, Y. J. Zhu, and G. Xu, “The treatments and post-
 operative complications of esophageal cancer: a review,” Jour-
 nal of Cardiothoracic Surgery, vol. 15, no. 1, p. 163, 2020.
[29] L. M. Schotten, K. Darwiche, M. Seweryn et al., “DNA methyl-
 ation of PTGER4 in peripheral blood plasma helps to distin-
 guish between lung cancer, benign pulmonary nodules and
 chronic obstructive pulmonary disease patients,” European
 Journal of Cancer, vol. 147, pp. 142–150, 2021.
[30] P. M. Das and R. Singal, “DNA methylation and cancer,” Jour-
 nal of Clinical Oncology, vol. 22, no. 22, pp. 4632–4642, 2004.
[31] A. Koch, S. C. Joosten, Z. Feng et al., “Analysis of DNA meth-
 ylation in cancer: location revisited,” Nature Reviews. Clinical
 Oncology, vol. 15, no. 7, pp. 459–466, 2018.
[32] C. A. Eads, R. V. Lord, S. K. Kurumboor et al., “Fields of aber-
 rant CpG island hypermethylation in Barrett's esophagus and
 associated adenocarcinoma,” Cancer Research, vol. 60, no. 18,
 pp. 5021–5026, 2000.
[33] E. Smith, N. J. de Young, S. J. Pavey et al., “Similarity of aber-
 rant DNA methylation in Barrett's esophagus and esophageal
 adenocarcinoma,” Molecular Cancer, vol. 7, no. 1, p. 75, 2008.
[34] Y. Q. Jin and D. L. Miao, “Multiomic analysis of methylation
 and transcriptome reveals a novel signature in esophageal can-
 cer,” Dose-Response, vol. 18, no. 3, article 1559325820942075,
 2020.
[35] Y. Kawamata, R. Fujii, M. Hosoya et al., “A G protein-coupled
 receptor responsive to bile acids,” The Journal of Biological
 Chemistry, vol. 278, no. 11, pp. 9435–9440, 2003.
[36] A. Carino, L. Graziosi, C. D’Amore et al., “The bile acid recep-
 tor GPBAR1 (TGR5) is expressed in human gastric cancers
 and promotes epithelial-mesenchymal transition in gastric
 cancer cell lines,” Oncotarget, vol. 7, no. 38, pp. 61021–
 61035, 2016.
[37] N. H. Kulkarni, C. A. Karavanich, W. R. Atchley, and R. R.
 Anholt, “Characterization and differential expression of a
 human gene family of olfactomedin-related proteins,” Geneti-
 cal Research, vol. 76, no. 1, pp. 41–50, 2000.
You can also read