African Collaborative for Health Financing Solutions - The Namibian experience of combining aspects of SHA and NASA for health and HIV resource ...
←
→
Page content transcription
If your browser does not render page correctly, please read the page content below

African
         Collaborative
         for Health
         Financing
         Solutions
The Namibian experience of combining
aspects of SHA and NASA for health and
HIV resource tracking
September 2020
Table of Contents
List of Acronyms                                                                      1
Introduction                                                                          3
  Purpose                                                                             3
  Possible approaches to integration                                                  3
  Overview of the Namibian approach                                                   3
Resource tracking parameters                                                          4
  Boundaries                                                                          4
  Alignment and definitions of resource tracking classifications                      7
Planning a resource tracking exercise                                                 7
  Defining the scope and policy questions                                             7
  Data collection tools for primary data collection                                   8
  Mapping of stakeholders                                                            13
  Defining secondary data needs                                                      13
  Set-up and customisation of the HAPT                                               13
  Set-up of the NASA Resource Tracking Tool                                          20
SHA-NASA Data cleaning, mapping, and analysis                                        22
  Importing of questionnaires into analysis tools                                    23
    Importing questionnaires into HAPT                                               23
    Importing completed HIV questionnaires into NASA RTT                             25
Generation of results                                                                27
  Generation of statistical reports and tables                                       27
  Preparation of key indicators and matrices for analysis                            30
Conclusion                                                                           32
Annex 1: Cross-walk of SHA and NASA classifications and codes used in the Namibian
health and HIV resource tracking exercise                                            33
List of Acronyms
AIDS     Acquired Immunodeficiency Syndrome

ART      Antiretroviral Therapy

ARV      Antiretroviral

ASC      AIDS spending category (NASA)

BEN      Beneficiary (SHA)

BP       Beneficiary population (NASA)

DIS      Disease (SHA)

FA       Financing Agent (SHA)

FAP      Funding Agent and Purchaser (NASA)

FE       Financing entity (NASA)

FP       Factors of provision (SHA)

FS       Revenues of health financing schemes (SHA)

FS.RI    Institutional units providing revenues of health financing schemes (SHA)

GAM      Global AIDS monitoring

GDP      Gross domestic product

HA       Health Accounts

HAPT     Health Accounts Production Tool (SHA)

HC       Healthcare function (SHA)

HCR      Healthcare-related (SHA)

HF       Financing scheme (SHA)

HIV      Human Immunodeficiency Virus

HK       Capital formation (SHA)

HP       Healthcare provider (SHA)

HTS      HIV testing services

NASA     National AIDS Spending Assessment

NGO      Non-governmental organization

OECD     Organization for Economic Cooperation and Development

OOP      Out-of-pocket expenditure

PEPFAR   President’s Emergency Plan for AIDS Relief

                                                                                    1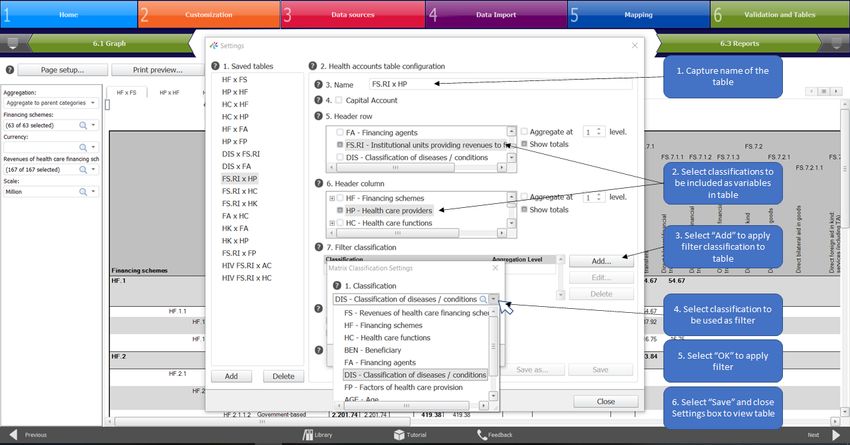
PF       Production factors (NASA)

PLHIV    People living with HIV

PS       Provider of services (NASA)

REV      Revenues of financing sources (NASA)

RT       Resource tracking

RTT      Resource tracking tool (NASA)

SCH      Financing scheme (NASA)

SDM      Service delivery modality (NASA)

SHA      System of Health Accounts

THAE     Total HIV/AIDS expenditure

THE      Total Health Expenditure

UNAIDS   Joint United Nations Program on HIV and AIDS

USAID    United States Agency for International Development

USD      United States Dollar

WHO      World Health Organization

                                                              2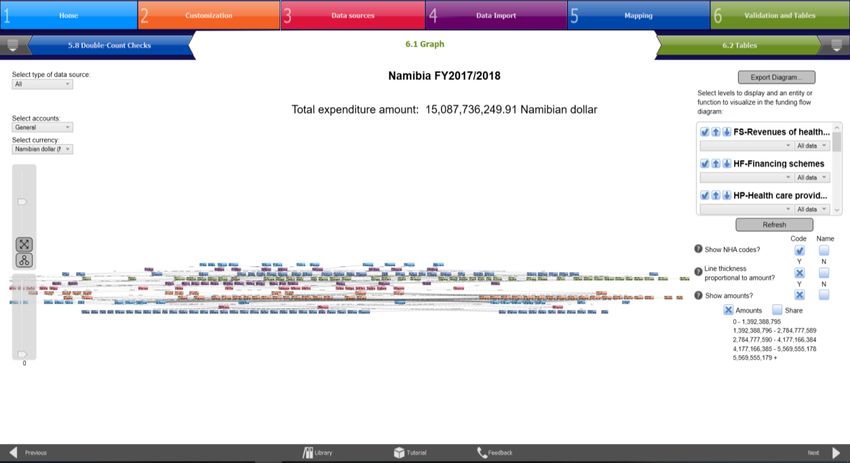
Introduction
Purpose
The purpose of this document is to provide guidance based on the Namibian experience of
combining aspects of the System of Health Accounts (SHA) and the National AIDS Spending
Assessment (NASA) methodologies, which may prove useful to countries wanting to undertake
a joint exercise to comprehensively map the resource flows for health as a whole and specifically
for the HIV/AIDS response with the level of detail required by both of these methodologies. This
manual describes the Namibian process in combining aspects of the SHA and NASA resource
tracking methodologies and provides guidance to health financing practitioners who are aiming
to achieve efficiencies in resource tracking implementation.

Possible approaches to integration
The degree of integration of the two resource tracking methodologies should be informed by the
data needs and challenges that are unique to the country. Therefore, the approach to combining
the methodologies should be informed by, and adapted to, the country-specific context. The
table below lists some, but not all challenges, that may influence the approach taken in terms
of the integration of methodologies.

Table 1: Resource tracking challenges and corresponding approaches to integration
 Challenge                      Approach

 Survey fatigue and cost of     Combine the data collection efforts by using consolidated
 data collection                questionnaires to collect health and HIV expenditure data
                                simultaneously (note additional effort needed for the NASA
                                non-health actors)

 Sources of data differ         Data collection efforts to be done in parallel, while the
 significantly for health and   mapping and analysis efforts are consolidated to ensure
 HIV spending                   consistency in spending estimates

Each country will need to identify the extent to which the SHA and NASA methodologies can be
combined to ensure that the approach is realistic and practical, while meeting the needs of all
relevant stakeholders.

This manual provides guidance on how to combine both the data collection and analysis
components of the resource tracking exercises to achieve maximized efficiencies. However,
the approach outlined can be adapted to suit the country needs by selecting specific
components of the exercise for integration.

Overview of the Namibian approach
The Namibian Ministry of Health and Social Services (MOHSS) found that by combining aspects
of the SHA and NASA frameworks, it was possible to implement resource tracking in an
inclusive, efficient, and routine manner and ensure that the exercise fulfilled the requirements
for both general health and HIV/AIDS expenditure data. A combined approach to resource
tracking avoids duplication of data collection efforts, thus maximizing limited resources to
generate accurate and complete survey responses by preventing survey fatigue. It also allows

                                                                                                    3
for the production of consistent estimates of the spending on the HIV/AIDS response in one
exercise, avoiding discrepancies that may arise as a result of the different methodologies. These
attributes increase the likelihood that health and HIV resource tracking will be institutionalized
going forward.

The SHA is an internationally recognized methodology used to track expenditures in a health
system for a specified period of time. It follows the flow of funding for health from its origins to
end use, answering questions such as: how are health care goods and services financed?
Where does the population consume them? What goods and services are financed? By
breaking down health spending by different classifications, Health Accounts provide insight into
issues such as whether resources are being allocated to national priorities, and whether health
spending is sufficient relative to need; the sustainability of health financing; and the extent to
which households have financial risk protection. Health Accounts provide sound evidence for
decision-making and are a useful tool for informing health financing reforms. The SHA
framework was developed and has been revised by key international stakeholders over the past
two decades. The framework was updated in 2011 (OECD et al. 2011) and is now the
international standard for national-level health accounts estimation.

The NASA methodology, developed by UNAIDS, seeks to ascertain the flows of funds used to
finance national responses to the HIV epidemic. Therefore, it follows the financial transactions
from their origin down to their final destination (i.e. the beneficiaries receiving goods and
services). NASA is not limited to tracking only health-related expenditures for HIV – it also tracks
non-health HIV expenditures such as social mitigation, education, labor, justice, and other
sectors related to the multisectoral HIV response. NASA applies similar categories of
classifications to SHA, in terms of the financing, production and consumption of HIV services,
with different and greater disaggregation of the HIV services (AIDS Spending Categories), as
well as of the HIV service providers, so as to adequately capture the full range of actors (both
health and non-health) in the multisectoral response.

The Namibian approach combines these two methodologies using modified and customised
data collection tools from the SHA methodology as a starting point, to which specific
modifications were made to comprehensively collect HIV/AIDS data in accordance with the
NASA requirements and its various classifications. All SHA 2011 classifications were cross-
walked to the NASA classifications of expenditures, and vice versa, to ensure full alignment
between their classification requirements. Since the mapping of data for the combined SHA and
NASA methodologies requires a detailed analyses on both the overall health and the specific
HIV/AIDS data, the analyses are performed using the tools of both methodologies: Health
Accounts Production Tool (HAPT) and NASA Resource Tracking Tool (RTT).

Resource tracking parameters
Boundaries
The boundaries presented below define the resource tracking estimation and articulate which
expenditures are included and excluded.

Health boundary: The boundary of “health” in the Health Accounts is “functional” in that it refers
to activities whose primary purpose is disease prevention, health promotion, treatment,
rehabilitation, and long-term care. This boundary includes services provided directly to individual
persons, and collective health care services covering traditional tasks of public health. Examples

                                                                                                       4
of personal health care services include facility-based care (curative, rehabilitative, and
preventive treatments involving day-time or overnight visits to health care facilities); ancillary
services to health care such as laboratory tests and imaging services; and medical goods
dispensed to patients. Examples of collective health care services include health promotion and
disease prevention campaigns, as well as government and insurance health administration that
target large populations. National standards of accreditation and licensing delineate the
boundary of health within SHA: providers and services that are not licensed or accredited – for
example, some traditional healers – are not included; nor are services that fall outside of the
functional definition of health.

SHA 2011 separately tracks healthcare-related and capital formation spending. Health care-
related activities are intended to improve the health status of the population, but their primary
purpose lies elsewhere. Health care-related spending is particularly important for the tracking
of HIV/AIDS spending, since many HIV/AIDS interventions do not necessarily have the primary
objective of improving health. Examples of health care-related activities are food, hygiene, and
drinking water control, and the social component of long-term care for older persons. For the
HIV/AIDS program, these activities include income-generating activities and social support to
orphans and vulnerable children. While these expenditures are captured as healthcare-related
expenditures under the SHA 2011 methodology, they are included as part of the current
expenditures using the NASA methodology, and are classified in detail so as to capture the
multi-sectoral response to HIV.

Time boundary: The resource tracking time boundary specifies that each analysis covers a
one-year period1 and includes the value of the goods and services that were consumed during
that period. The resource tracking exercise includes expenditure according to accrual
accounting, by which expenditures are classified within the year they create economic value
rather than when the payment was received.

For the SHA 2011 methodology, capital formation of health care providers covers investment
lasting more than a year, such as infrastructure or machinery investment, as well as education
and training of health personnel, and research and development in health. Capital formation
contrasts with “current health expenditure,” which is completely consumed within the annual
period of analysis. From the NASA perspective, the capital formation is considered as essential
to enable the delivery of the HIV services, and, therefore, is attributed to the specific HIV/AIDS
Spending Category for which the capital goods were purchased, in a particular year. They are
labelled as capital in the Factors of Production classifications. Therefore, recurrent and capital
health-HIV spending is tracked differently for the SHA 2011 and NASA methodologies, and
should be reconciled to ensure consistency between both assessments.

Space boundary: The combined resource tracking methodology used the SHA 2011 boundary
for space, which “focuses on the consumption of health care goods and services of the resident
population irrespective of where this takes place” (OECD et al. 2011). This means that goods
and services consumed by residents (citizens and non-citizens) are included, whether in or

1Each analysis covers a period of one year, but in instances where resource tracking is not done on an annual
basis, a single exercise would usually cover multiple periods to ensure a continuous dataset. The datasets and
analyses are nonetheless produced for the multiple one-year periods, so that expenditure data can be produced for
each individual year.
                                                                                                                    5
outside the country where the exercise is being undertaken, while non-residents who are in the
country are excluded.

Disease boundary: Health Accounts, according to the SHA 2011 methodology, focus on
spending on priority diseases, whose primary purpose is prevention, health promotion,
treatment, rehabilitation, and long-term care. This SHA boundary of disease spending typically
does not include spending on other activities key to the priority disease responses such as care
for orphans and vulnerable children (e.g., education, community support, and institutional care),
enabling-environment programs (e.g., advocacy, human rights programs, and programs
focused on women and gender-based violence), and social protection and social services (e.g.,
monetary benefits, social services, and income-generation projects). However, since this
resource tracking exercise aims to comprehensively include all spending on HIV/AIDS in
compliance with the NASA requirements, spending data on non-health priority disease services
are included in the resource tracking exercise.

Curative care boundary: As per the SHA 2011 methodology, curative care starts with the onset
of disease and encompasses health care during which the “principal intent is to relieve
symptoms of illness or injury, to reduce the severity of an illness or injury, or to protect against
exacerbation and/or complication of an illness and/or injury that could threaten life or normal
function” (OECD et al. 2011). It includes inpatient, outpatient, home-based, and day curative
care. Across each of these types, it also includes general and specialized curative care. For the
NASA classifications, more detailed coding is required of the specific interventions, and the
location of the service is captured under the Service Delivery Modality (SDM) category e.g.
facility-based, community-based, home-based, and so on, as well as under the service provider
category, e.g. hospital, out-patient center, and so on.

Prevention boundary: Applying the SHA 2011 boundary, prevention interventions start with an
individual in a healthy condition. The aim is to “enhance health status and to maintain a condition
of low risk of diseases, disorders or injuries” – for example, to prevent the occurrence of disease
or injury through vaccinations or an injury prevention program. Preventive interventions also
cover individuals at specific risk and those who have either no symptoms or only early ones of
disease, where early case detection will increase the likelihood of a successful intervention and
ultimately reduce potential damage – for example breast and prostate cancer, where age and
sex affect the risk; or lung cancer, where lifestyle choices like smoking increase the risks (OECD
et al. 2011). In the NASA domain, preventative interventions that target key populations (sex
workers and so on) as well as vulnerable populations (adolescent girls and so on) are important
interventions to capture that fall outside of the SHA definition, and usually require extra effort to
collect data from their unique service providers. For the HIV spending being captured according
to the NASA2020 framework, the prevention boundary was broader than for SHA and allowed
for all the non-health prevention interventions to be captured according to the NASA
classifications.

Inpatient versus outpatient care boundary: The SHA 2011 boundaries define that inpatient
care involves a formal admission to a healthcare facility that involves an overnight stay after
admission. Day care involves a formal admission to a health care facility where the patient is
discharged the same day and does not require an overnight stay. Outpatient care is delivered
from the health care providers’ premises but does not involve a formal admission to a health
care facility. For the HIV spending being captured according to the NASA2020 framework, this
boundary of in-patient versus out-patient did not apply.

                                                                                                        6
Alignment and definitions of resource tracking classifications
The Namibian combined resource tracking approach aimed to ensure alignment between the
SHA and NASA methodologies and their classifications. As such, the data requirements,
classification categories and mapping codes of both methodologies were comprehensively
provided for in the combined exercise. Annex 1 contains the crosswalk of the classifications of
the two methodologies, as applied in Namibia. During the analysis of results, it was important
to further ensure that the results are correctly analyzed and presented.

The two resource tracking methodologies require different levels of detail in different areas of
emphasis. Where one methodology requires more detail than the other methodology, those
additional levels of detail need to be inserted in both the mapping classifications and codes as
well as in the questionnaires to ensure that the highest necessary level of detail is captured for
each methodology. Furthermore, additional classifications need to be added to the SHA
classifications, including the NASA AIDS spending categories (ASC) and beneficiary categories
to ensure that the NASA classifications are fully catered for. Where the respondent selects HIV
as the disease focus of their spending in the questionnaire, the tool automatically provides the
NASA ASC and beneficiary categories from which to select. These ASC and beneficiary
categories can then be cross-walked (or mapped) back to the more aggregate SHA health
categories.

The questionnaires were designed to automatically map each transaction against the
standardized cross-walk of classifications and codes to ensure consistency in the SHA and
NASA data. Additional data obtained from secondary sources also needed to be mapped using
the same cross-walked codes. Data checking and cleaning are essential to ensure the correct
SHA and NASA classifications are used in the automated transaction sheets, which are
uploaded into the Health Accounts Production Tool (HAPT) 2 and into the NASA Resource
Tracking Tool (RTT) 3 . Since the mapping of data for the combined SHA and NASA
methodologies requires detailed analyses to be done on both the overall health and the specific
HIV/AIDS data, the Namibian resource tracking team decided to undertake the analyses using
the tools of both methodologies (HAPT and RTT) which enabled the data to be analyzed and
presented according to the SHA and NASA requirements.

Planning a resource tracking exercise
Prior to undertaking their joint SHA-NASA resource tracking exercise, the Namibian MOHSS
and the resource tracking team undertook several preparatory steps.

Defining the scope and policy questions
The first step in the planning stage of the combined resource tracking exercise was to determine
the policy questions to be answered by the results of the exercise. The policy questions need
to be realistic and within the limitations of the information generated through the resource
tracking exercise, acknowledging that the resource tracking data may be combined with other

2 The HAPT guides health accounts teams through the entire process of producing health accounts data from
defining the scope to the analysis of results. The tool can be downloaded from https://www.who.int/health-
accounts/tools/HAPT/en/
3 NASA Resource Tracking Tool facilitates the capturing, consolidation and analysis of HIV expenditure data and

can be downloaded from https://www.unaids.org/en/dataanalysis/datatools/nasapublicationsandtools                  7

data outside of the scope of the exercise for additional analyses, such as for some efficiency
analyses. In determining the policy questions, the following aspects were considered:

   •   Policy questions identified in previous years of expenditure tracking
   •   Current or upcoming policy decisions that need to be informed by financial expenditure
       data
   •   Areas where compliance with existing policies needs to be monitored or reviewed, such
       as mid-term reviews of national strategic HIV plans

The specific policy questions should be clearly defined and included in the resource tracking
proposal for each year that health and HIV resources are to be tracked. The policy questions
should guide the resource tracking process and it needs to be ensured that the data collection
tools and analyses of data generate the necessary information required to respond to the policy
questions. For example, if one of the health policy questions revolves around spending trends
on the various types of non-communicable diseases, it needs to be ensured that all relevant
sub-categories of non-communicable diseases are included in all questionnaires and that data
analyses are conducted at a level of detail that portrays this information. Another example may
be to gain better understanding of health spending by public facility type including a breakdown
by the levels of facilities, then these additional levels need to be added into the classifications
(refer to customisation of the HAPT and RTT below), while the questionnaires will also need to
be customised accordingly.

When undertaking a combined SHA-NASA approach for the detailed HIV/AIDS spending, it is
important to review the SHA-NASA cross-walk of categories, which defines how each of the
SHA 2011 classifications and codes correlate to the NASA 2020 classifications and codes, and
vice versa (refer to Annex 1 for cross-walk used by Namibia), and determine if additions or
changes are required. These then feed into the data collection tools (see next section). For
example, the SHA beneficiary list was expanded to incorporate the NASA’s detailed beneficiary
categories, so as to apply these to the HIV spending.

Data collection tools for primary data collection
Separate questionnaires are required for each type of respondent, including government
institutions, donors, NGOs, medical insurance funds, employers, and universities. The Namibian
questionnaires for each of the respondent types were primarily based on the standardized SHA
questionnaires for each organization type (because Namibia had undertaken several rounds of
Health Accounts and respondents were familiar with their layout) and were customized to
accommodate the NASA data requirements. Table 2 below lists all the sources from which each
tool collects primary data, details the specific information that is requested and defines the use
of the information collected.

                                                                                                      8
Table 2: Data sources and purpose of information
Data source Information required Purpose of information
Government - The Health or HIV/AIDS expenditures broken down by: To understand the level and flow of government
o Source of funding funding for health and HIV/AIDS programs in
Namibia as well the service/intervention delivery
o Provider of services
details
o Disease
o Description of activity
o Type of activity (function)
o AIDS spending category
o Beneficiary (applying the detailed NASA categories)
o Service delivery modality
o Age of beneficiary
- Inputs/type of cost (including capital)
Donors (both bilateral and - Total current and capital expenditure on health and the non- To understand their level and flow of external
multilateral agencies and health HIV/AIDS response funding for health and HIV/AIDS programs in
international foundations) - Expenditures broken down by the program/projects funded by Namibia
donors with for each program/project, capture of information
around:
o Project description
o Source of funding
o Agent managing funds
o Provider of services
o Disease
o Description of activity
o Type of activity (function)
o AIDS spending category
o Beneficiary (applying the detailed NASA categories)
o Service delivery modality
9Data source Information required Purpose of information
o Age of beneficiary
- Inputs/type of cost (factors of production including capital)
NGOs involved in health - Total current and capital expenditure on health and the non- To understand flows of health and HIV/AIDS
and HIV/AIDS response health HIV/AIDS response resources through NGOs that manage and deliver
- Expenditures broken down by the program/projects funded by health and HIV/AIDS programs, capturing how
donors with for each program/project, capture of information funding generated by the NGOs and received from
around: donors (including private companies) is spent
o Project description
o Source of funding
o Agent managing funds
o Provider of services
o Disease
o Description of activity
o Type of activity (function)
o AIDS spending category
o Beneficiary (applying the detailed NASA categories)
o Service delivery modality
o Age of beneficiary
- Inputs/type of cost (factors of production including capital)
Private employers - Number of full-time employees To understand the extent to which employers
- Number of part-time employees provide health and HIV/AIDS services at the
workplace, cover expenditures on health and
- Types of health benefits provided to employees
HIV/AIDS services on behalf of their employees
- Total expenditures on own health facility including detailed
and, where applicable, which employers manage
breakdowns of this expenditure by: their own health facilities or provide workplace
o Type of service (function) prevention
o Input/type of cost (including capital)
o Disease
10Data source Information required Purpose of information
o AIDS spending category
- Total health expenditures on contracts with health providers
including breakdown by type of service (function)
- Total expenditures on reimbursements to employees for health
expenditures
- Total expenditures on wellness programs including breakdown
of expenditure by:
o Type of service
o Disease
- Input/ factors of production
Medical insurance funds - Total number of persons enrolled To understand total expenditures on health by
- Total administrative expenditures by type of cost medical health insurance funds (including
PSEMAS, Social Security Commission
- Total revenue received including breakdown by source of
Employee’s compensation fund, and the Motor
revenue
Vehicle Accident Fund) through health or any other
- Expenditures on providers by type of provider broken down by
type of insurance or risk-pooling mechanism
type of activity (function and AIDS spending category) and age
of beneficiary
Universities - Number of employees To understand the extent to which universities
- Number of students provide health and HIV/AIDS services on campus
(to both employees and students) through their
- Types of health benefits provided
own health facilities or provide prevention
- Total expenditures on own health facility including detailed services, and to what extent health and HIV
breakdowns of this expenditure by:
research is conducted by these institutions
o Type of service (function)
o Input/type of cost (including capital)
o Disease
o AIDS spending category
11Data source Information required Purpose of information
- Total expenditures on wellness programs including breakdown
of expenditures by:
o Type of service
o Disease
o Input
- Expenditures on health or HIV-related research broken down
by:
o Research type
o Source of funding
o Disease
- Input/type of cost (factors of production including capital)
12Each of the Namibian questionnaires includes a “transaction” sheet that automatically maps
each transaction to the SHA classifications and another that maps the HIV transactions to the
NASA classifications. Both transaction sheets are linked to the “mapping codes” sheet that
includes the cross-walk of the SHA and NASA codes. The mapping codes sheet also forms the
basis for the drop-down lists that provide the options for the responses that need to be
completed in the questionnaire. This was done to ensure consistent responses in accordance
with the standardized SHA-NASA classifications. If any changes are made to the mapping
codes or classifications that are used in the resource tracking exercise, these should be
incorporated in the mapping codes sheet to ensure operability of the automatic mapping function
to the transaction sheets, that are then uploaded into the HAPT and RTT. For the latter, all the
NASA vectors, codes and classifications must be used exactly as they are defined in the RTT
– no changes are possible.
The questionnaires can be customized further as the information requirements change or as
additional information needs arise as a result of specific policy questions. Attention needs to be
paid towards ensuring consistency in data collected, completeness in terms of meeting both the
SHA and the NASA data requirements and accurate mapping of data in the transaction sheets
to allow for the automatic generation of the transactions with the correct classifications and
codes to be uploaded to the HAPT and RTT.
Mapping of stakeholders
Mappings of stakeholders, or census lists, are developed to define where primary data will be
collected from. These census lists will include all types of organizations that will be requested
to complete the relevant questionnaire, including donors, NGOs, medical insurance funds,
private employers, universities, and government institutions (noting that for HIV, several
additional (non-health) ministries must be added to the census list).
The census lists are developed through extensive consultations within the resource tracking
team and consultations with other relevant external stakeholders. While the previous year’s
census lists are generally used as starting points to develop the list for the current year, it is
important that extensive efforts are made to ensure that the census lists are as comprehensive
as possible and representative of the stakeholders involved in the provision of health and
HIV/AIDS services in the year of the exercise. In particular, additional efforts should be made to
identify the non-health HIV actors for the NASA purposes.
Defining secondary data needs
In moving towards the institutionalization, it is important to ensure that, to the greatest extent
possible, data are collected from existing data sources to minimize the efforts required to
conduct the resource tracking exercise. Therefore, secondary data needs are defined by
reviewing the information needs that can be covered through existing reports or other data
collected through routine reporting mechanisms. Reviews of existing data sources should be
done on a regular basis, while proactive efforts to implement routine data reporting should also
be pursued for the institutionalization of resource tracking.
Set-up and customisation of the HAPT
Once all of the parameters of the study have been defined, the team can proceed with setting
up the software tools that are used to assist with the consolidation and analysis of results,
13including the Health Accounts Production Tool (HAPT) for the SHA analyses and the Resource
Tracking Tool (RTT) for the NASA analyses.
Various user guides have been developed for the Health Accounts Production Tool SHA 2011,
which provide detailed guidance on how to install and use the HAPT and its various functions.
The following user guides can be used as additional reference:
• https://www.who.int/health-accounts/tools/NHAPT_User_Guide_2.5.12.pdf?ua=1
• https://www.hfgproject.org/health-accounts-production-tool-sha-2011/
To commence the process of setting up the HAPT, a new study will need to be created. The
steps to create a new study are detailed below:
1. Open the HAPT and click “Team Lead” to enable functions of customizing the study
parameters and classifications.
1. Open HAPT
and select “Team
Lead”
2. On the Home Screen, select “Start New HA”
3. Type in the name of the new resource tracking exercise – typically the name includes
the country and the year of the resource tracking exercise. Then click “OK”.
143. Type in name
of RT study, then
click “OK”
2. Select "Start
New HA…
Once a new study has been created, it can now be customized to suit the country-specific
context and the parameters of the study. The steps to customize the study are illustrated
below:
1. Under part “2 Customization” of the HAPT tool select the tab for “2.1 General
information” select the country name from the drop-down list under question 1 as the
country.
2. Under question 2, specify the period of the resource tracking exercise. Typically, the
period follows the government’s financial year.
3. Under question 3, select all classifications that the exercise aims to collect data on, and
report results against. Typically, the classifications included in the resource tracking
exercises from the standardized classifications list include the following:
Table 1: SHA 2011 Classifications
Classification code Classification name
FS Revenues of health financing schemes
FS.RI Institutional units providing revenues of financing schemes
HF Financing scheme
FA Financing Agent
HP Healthcare provider
HC Healthcare function
HCR Healthcare-related function
HK Capital formation
FP Factors of provision
DIS Disease/condition
AGE Age of beneficiary
BEN Beneficiary
154. Under question 4, select the currency for the resource tracking exercise from the drop-
down list. This is typically the domestic currency of the country.
1. Select the country to
be covered by the study
from drop-down list
4. Select the national
2. Insert the start and
currency from drop-
end dates of the study
down list
3. Select classifications
(dimensions) from the list
for inclusion in study
5. Additional reporting currencies are included under question 5 by clicking “Add”.
6. Select the relevant currency from the drop-down list.
7. The exchange rate between the specific currency and the reporting currency should be
specified.
8. Select “OK” to confirm the addition of the currencies and exchange rates.
5. Select “Add” to insert
foreign currencies
6. Select foreign currency
from drop-down list
7. Insert exchange rate
8. Select “OK”
Additional classifications can be added under “Advanced Settings” button as shown in the
illustration below. This will need to be done to add the AIDS Spending Categories and Service
Delivery Modality classifications into the HAPT.
1. On the “Advanced Settings” pop-up, select add.
2. Type in the code abbreviation
163. Type in the name of the classification that is to be added.
4. Select “OK” to finalize.
2. Type in the code
abbreviation
3. Type in the
classification name
4. Select “OK”
1. Select “Add”
The SHA codes will need to be customized in line with the SHA-NASA cross-walk in order to
ensure that all of the relevant NASA codes are incorporated – for example to define the AIDS
Spending Category and Service Delivery Modality classifications, to change the beneficiary
classifications and to add the more detailed classifications under the institutional units providing
revenues of financing schemes and the financing agents categories. The steps to customize
the codes are illustrated below:
1. Click on the “2.2 Define NHA Codes” tab of the HAPT to customize the classifications
and codes that the resource tracking exercise will report against. Use the drop-down list
to identify the classification that is to be customized.
1. Use drop-down list to
identify classification for
customisation
172. Additional categories can be added to this classification by clicking “Add category” – this
will create a main category, i.e. level 1 of reporting.
3. In the pop-up screen type in the name of the category
4. Select OK to create.
2. Select “Add Category” to
add additional categories
under a main category
3. Type in the name of
the category
4. Select “OK”
5. Sub-categories to these main categories or other sub-categories (for additional level of
detail for existing categories) can be added by selecting “Add Sub-Category”.
6. The name of the sub-category should be typed into the screen that appears. The
numbering of the added sub-category is automatically generated sequentially but can
be changed to another number, as necessary.
7. Select “OK” to finalize addition of the new sub-category.
The names of the main categories and sub-categories can also be edited to ensure
alignment with the NASA categories by using the “Edit” button, changing the relevant text
and then clicking “OK”.
5. Select “Add Sub-Category”
to add additional categories
under a main category
6. Type in the name of
the category
7. Select “OK”
18As an alternative to adding all the relevant categories and sub-categories as needed, it is also
possible to import the classifications and categories from a previous study. The steps for
importing the classifications and categories from another study are described below:
1. Select “Import…” in the “2.2. Define NHA Codes” Tab.
2. Select the option from a “Previous HA” to use the classifications and categories from a
previous study. Press “OK”.
1. Select “Import”
2. Select “OK”
3. A list of the previous studies in the user’s database will appear. Select the relevant
resource tracking study file from which the classifications and categories are to be
imported.
4. Select “OK”.
Example RT 2018-19
3. Select RT study from
which the classifications
should be imported
4. Select “OK”
The final step in customizing the set-up on the HAPT file is to capture the census lists to include
all organizations from which data will be collected. Organizations from which data will be
19collected by means other than the standardized questionnaire also need to be captured on these
lists. There are red tabs for each type of organization from which data can be collected and the
census lists will need to be captured according these groupings. The steps to add organizations
to the census lists are illustrated below:
1. Under the tab for each type of organization, select “Add” to capture the organization
name. Select the button for “Secondary” data, since customized questionnaires are
being used that no longer fully conform to the HAPT questionnaire template for primary
data.
2. Type in the name of the organization.
3. Select “OK” to create.
1. Select “Add” 2. Type in name of donor
3. Select “OK”
Repeat the above process for adding organizations as per the census lists for each organization
type to finalize customization of the HAPT.
Set-up of the NASA Resource Tracking Tool
UNAIDS developed the Resource Tracking Tool (RTT)4 for easier capturing of NASA data and
their analysis. The latest version of the NASA (2020) vectors and their classifications can be
imported into the RTT, or an older version can be used, or converted to a later classification
framework. No additions or edits should be made to the vectors, classifications or their codes
by the users of the RTT. UNAIDS also developed a Data Collection Tool (DCT) which is an
Excel® tool structured for uploading into the RTT. Additional guidance resources are available
on the UNAIDS website5. In addition, the detailed RTT manual is available within the RTT
software, describing each step to set-up and use the RTT – please read these before
commencing. 6 The RTT software has three modules: NASA classifications, system
management module and the project processing module. Before commencing with uploading
cleaned (final) questionnaires or any direct data entry in the NASA RTT, the RTT must be
downloaded onto the users’ computer (noting that it is not compatible with MAC laptops), the
4 Available for download at https://www.unaids.org/en/dataanalysis/datatools/nasapublicationsandtools
5 https://www.unaids.org/en/dataanalysis/datatools/nasapublicationsandtools
6 A standalone guidance manual is currently under development.
20users’ profiles set up (with roles assigned to each) and the correct version of the NASA
classifications selected. Then a database is created, which provides the structure in which the
country NASA project will be located. The project can then be set up in the RTT with all the
parameters defined (country name, year, currency, units of measurement), as well as additional
country-specific information (population, GDP, HIV prevalence, numbers of PLHIV, etc.). If sub-
national data have been collected, the names of the provinces/ regions should be added to the
project information, which will then allow for the sub-national analysis7.
Once the project has been set up and opened, and before the questionnaires, which have the
DCT RTT-base sheet, can be uploaded successfully, the names of all the organizations/
institutions in the HIV response and their function (source, agent or provider) must be added to
institutions list in the RTT – refer to the guidance/help function within the RTT software.
7The Namibian SHA-NASA did not collect disaggregated data by sub-national location. However, this option is
available in the questionnaires.
21SHA-NASA Data cleaning, mapping, and
analysis
Data quality reviews should be performed on all questionnaires as they are returned by the
respondents. The Namibian questionnaires have been designed to include automated quality
and data consistency checks that aim to confirm that the totals, sub-totals and activity
expenditure lines agree. Specific cells within the questionnaires are highlighted in red and
warning notifications appear if there are inconsistencies in the sums of the expenditure amounts.
The resource tracking team should review all completed questionnaires to confirm that none of
these cells are highlighted to indicate inconsistencies.
Furthermore, the resource tracking team will need to review questionnaires to confirm that the
provided data are complete and accurate. For example, an employer indicating that a certain
type of service is provided at the beginning of the questionnaire must then also complete the
corresponding section providing the breakdown of these expenditures. The team would also
need to confirm that all breakdowns for all classifications are provided for each
expenditure/transaction. The accuracy checks often require logic reviews to confirm that the
data provided make sense. For example, one would need to confirm that services provided are
aligned to the type of provider and the types of inputs.
For any missing or incorrect data, the resource tracking team will need to follow-up with the
respondents/organizations to provide or correct the data.
Finally, the team will need to confirm the accuracy and completeness of the transaction sheets
to confirm that the correct codes are pulling through to these sheets, and that the correct
amounts for individual expenditure lines and the total amounts pull through correctly.
It is strongly advised that the questionnaires only be uploaded into the HAPT and RTT only
once the data have been checked, cleaned and confirmed as final, especially those that have
had HAPT allocative keys applied to them. The resource tracking team must check that the
HAPT distribution keys have been applied in a logical manner for the HIV spending. For
example, all (100%) of the spending on ARVs provided by the central medical stores must be
labelled as HIV in the disease vector, then 100% as ART in the ASC, and then 100% as clinics
in the service provider vector. ARV spending should not be subject to any HAPT default
distribution keys that first split all medicines between hospitals, health centers, clinics (SHA HP
codes), then between in-patient or out-patient curative care (SHA HC codes), and then between
diseases (SHA DIS codes). Similarly, this applies for other direct HIV spending, such as HIV
test kits, VMMC, and so on.
Any obvious errors or omission should be addressed first in the questionnaires, and then the
final versions to be uploaded into both the HAPT and RTT. This is to ensure the same data are
in both databases. If any additional corrections are made in either database to the HIV data, the
resource tracking team must ensure the same changes are made in the other database – to
eliminate any variances/discrepancies between the SHA HIV and NASA (health-related) HIV
outputs.
Since the mapping of data for the combined SHA and NASA methodologies requires detailed
analyses to be conducted on both the overall health and the specific HIV/AIDS data, the analysis
tools of both methodologies (HAPT and RTT) should be used to assist with the analysis. The
concurrent use of two analysis tools requires close coordination of the data management
22process to ensure consistency between the two data sets. Therefore, it is vital that any changes
to the primary data are fully reflected in the questionnaires, which are then imported into the
HAPT and RTT and that no further changes to the data are made in the tools themselves, unless
they are then also incorporated similarly in both tools. Furthermore, importing of secondary
data (for SHA purposes), such as for the application of distribution keys, needs to be managed
sequentially to ensure that the final data set captured in one tool is the same as is used in
another. Since the HAPT is used for the overall health expenditures, which includes estimations
of the share of the ministry of health’s operational costs attributable to HIV, the data should be
captured in the HAPT first to estimate this portion of HIV spending, plus all the direct HIV
expenditures (ARVs, VMMC, HIV test kits and reagents, etc) to provide the ministry of health’s
total HIV expenditure and then this sub-set is imported into the RTT (but with all the necessary
disaggregated NASA vectors and classifications and not in the aggregated SHA classifications).
However, as far as possible, direct HIV spending should be collected through primary data
collection, and these data be first captured in the NASA transaction sheet (or NASA DCT tool)
and imported to RTT, and then cross-walked to the more aggregated SHA codes for the HAPT
import. Any further changes to the RTT data should also be reflected in the HAPT.
Importing of questionnaires into analysis tools
Once the completed questionnaires have been reviewed in detail and the mapping sheets are
confirmed as correct, the data can be imported into the HAPT and the RTT.
Importing questionnaires into HAPT
For the HAPT, the data is imported on the purple Tab 4 for “Data Import”. There are separate
tabs for each type of organization.
1. Select the type of organization that data is to be imported by selecting the relevant purple
tab and then select the specific organization from the list. If an organization is not
reflected on the list, it was not captured as part of the process of capturing the census
lists and should be added under the red tab for “Data sources” (refer to Step 1.5 above).
2. After selecting the specific organization for which data is to be imported, select “Import
data…”.
1. Select organization for
2. Select “Import data…”
importing
233. Select the questionnaire from the relevant location on the computer where it is saved.
4. Select “Open”.
3. Select questionnaire
from relevant location
where it is saved
4. Select “Open”
5. The HAPT automatically reverts to the first sheet within the Excel file selected for
importing. If the mapped data is included in another sheet, then the relevant sheet for
import can be selected under “2. Data sheet”.
6. Each column that needs to be imported should be tied to the relevant category in the
HAPT. Double-click on the heading in the column
7. Select the relevant description from the drop-down list.
The headings in the Health Accounts mapping sheets of the questionnaires have been
aligned to the descriptions in the HAPT to allow for easy matching and selection. The
navigation buttons at the bottom of the “3. File binding” window allow for easy movement
between the columns.
5. Select correct sheet for
mapping
6. Double -click on
heading to bind specific
column of data
7. Select relevant
matching description for
binding field
24The table “4. Non-binding fields” on the right side of the pop-up screen indicate the HAPT
categories that have not yet been bound, with the essential fields being highlighted in red –
these fields need to be bound for the data to be imported. If the Excel file does not include a
column specifically capturing this information, then it can also be captured directly in the table
“4. Non-binding fields”. The following steps will allow for the non-binding fields to be captured
directly:
8. Double-click on the second column to show the drop-down arrow
9. Select the drop-down arrow to show the list and then select the relevant description from
the drop-down list.
8. Double-click relevant
field to show drop-down
list
9. Select response from
drop-down list
10. Select “Import” once
all fields have been
mapped”
10. Once all field have been mapped, select “Import” to import the data.
A pop-up screen will confirm the amount and number of rows that have been imported. It will
also indicate any errors in the mapping that may prevent data from importing correctly. These
errors should be corrected in the questionnaire itself to allow for data consistency between the
HAPT and RTT datasets, which means that the imported data should be deleted by selecting
the relevant organization from the list on the “Data import” tab and then selecting “Delete
data…”. Once the questionnaire has been corrected, the Excel file should be re-imported.
Importing completed HIV questionnaires into NASA RTT
For the seamless upload of the completed HIV questionnaires into RTT, the NASA mapping
sheet (hidden in the questionnaires) has all the data elements required for the RTT 8 , and
automatically converts the entries of the respondent to the NASA vectors and classifications.
However, it is still necessary for the resource tracking team to ensure that the combined SHA-
NASA questionnaires are correctly cross-walked (or mapped) to the NASA codes, and that the
“RTT_Base” sheet in the questionnaires, is structured exactly as required for upload to the RTT.
8The Namibian questionnaires contained a sheet exactly like the RTT_Base sheet in the DCT tool, to allow them to
be imported in the RTT.
25A few important points for the completed, cleaned and finalised questionnaires to be
successfully uploaded into the RTT. The following conditions must be met:
i. Column headings in “RTT_Base” sheet: All the required data elements (NASA
vectors) are available and have the correct column headings in the “RTT_Base” sheet
in the questionnaire. The column headings and their ordering/structure must not be
changed in the RTT_Base sheet, as these are necessary for upload to RTT. Data should
not be entered in this sheet, but rather it is auto-populated from the “Transaction Entry”
sheet.
ii. Labelling of vectors: The data for each vector must have the correct code and full
name in each cell (e.g. “FAP.02.05 Not-for-profit institutions (other than social
insurance)”. The questionnaires have the mapping to their correct codes and names
automated, so they should be generated correctly in the “NASA mapping” sheet.
However the resource tracking team should check these, as well as ensuring they have
the correct column headings.
iii. Values in “Transaction Entry” sheet: The “Transaction Entry” sheet should have no
links to other sheets or files, nor any filters or formulas. This means that the data, which
are auto-populated in the NASA mapping sheet, must be copied and pasted as values-
only to the “Transaction Entry” sheet. These are then auto-populated in the “RTT_Base”
sheet.
iv. Zero expenditures: The Transaction Entry sheet must have no rows with zero
expenditure (which happens in transactions where all five rows for the production factors
were not used). These rows with zero expenditure must be deleted – filter column AC
for “0” entries and delete those visible rows (take care not to delete the hidden rows
which have expenditure data). Un-filter column AC and remove the filters from the
heading row in the Transaction Entry sheet. The deletions of the zero expenditure
amounts in the Transaction Entry sheet will cause “#REF” cells in the “RTT_Base” sheet.
These rows can also be deleted from the “RTT_Base” sheet by filtering for the #REFs,
and deleting the visible rows (again, taking care not to delete the hidden rows which
have expenditure data).
v. Source of data: The RTT also requires the source of each piece of data for every
transaction and type of data to be indicated. Since these have not been included in the
SHA-NASA questionnaires, they cannot be completed. Therefore, they have been auto-
populated with “Primary source certificate” and “Expense reports”. Unfortunately, the
review of the NASA data quality could not be performed in this Namibian approach to
combining SHA and NASA.
vi. Number of persons reached: There is scope in the RTT to capture the numbers of
persons reached by each service or intervention. Unfortunately, these data were not
collected in the Namibian SHA-NASA questionnaires, and therefore are indicated as
zero in the NASA mapping and RTT_Base sheets, but could be entered manually if
collected from the respondents.
vii. Completeness of data: Before uploading the files, make sure to have captured all the
organisations in the RTT (after the project has been set up in RTT, see section 1.6) –
their names must be exactly as they are labelled in the questionnaires - for all funding
entities (sources of funding), agents and purchasers, and all providers - and their
function/type indicated: FE, FAP and/or PS. Any or all three of these can be selected
and must reflect what was indicated in the questionnaires. For example, if UNAIDS is
26the funding source, but also spends funds itself on certain activities, then it must be
captured as FE, FAP and PS – otherwise the RTT will not accept the file.
viii. Uploading (importing) of excel files: One-by-one upload/import each of the
respondent’s completed questionnaire into the RTT. This is done in the Project
Processing Module, where XLSX import is selected. The questionnaire file name can be
any name and located in any folder on the PC. In the RTT you will browse for the file
and select it for upload. If the data are all correctly captured as described above, the
RTT should quickly indicate if it has been successfully uploaded. If not, then it may take
several minutes attempting to upload and will then give an error message indicating
exactly which cells are problematic. Check all the above criterion have been met and try
again. Refer to the guidance available in the RTT.
Generation of results
Generation of statistical reports and tables
The HAPT and RTT automatically generate flow charts, matrices and tables depicting the flow
of resources through the health and HIV sectors, all of which can be exported in various formats.
For guidance on using the RTT, please refer to the additional resources provided within the RTT
and on the UNAIDS NASA website9. The HAPT graphs can be generated and customised under
tab “6.1 Graph”. On the left side of the screen it is possible to select which sources of data are
to be included in the graph, the currency of the depiction and type of accounts to be reflected
(i.e. current, capital, healthcare-related or healthcare-related capital). The slider bar can be used
to zoom in or out on the graph. On the right side of the screen it is possible to specify the data
to be illustrated according to the classifications and categories. It is important to select “Refresh”
9 https://www.unaids.org/en/dataanalysis/datatools/nasapublicationsandtools
27You can also read