Affirmative Action and Application Strategies: Evidence from Field Experiments in Columbia - Ritwik Banerjee Marcela Ibanez Gerhard Riener Soham ...
←
→
Page content transcription
If your browser does not render page correctly, please read the page content below
NO 362

Affirmative Action and Application Strategies:
Evidence from Field Experiments in Columbia
Ritwik Banerjee
Marcela Ibanez
Gerhard Riener
Soham Sahoo

April 2021
IMPRINT

D IC E D I SCU SSI ON PAP E R

Published by:
Heinrich-Heine-University Düsseldorf,
Düsseldorf Institute for Competition Economics (DICE),
Universitätsstraße 1, 40225 Düsseldorf, Germany
www.dice.hhu.de

Editor:
Prof. Dr. Hans-Theo Normann
Düsseldorf Institute for Competition Economics (DICE)
Tel +49 (0) 211-81-15125, E-Mail normann@dice.hhu.de

All rights reserved. Düsseldorf, Germany 2021.

ISSN 2190-9938 (online) / ISBN 978-3-86304-361-2

The working papers published in the series constitute work in
progress circulated to stimulate discussion and critical comments.
Views expressed represent exclusively the authors’ own opinions
and do not necessarily reflect those of the editor.
Affirmative Action and Application Strategies:
   Evidence from Field Experiments in Colombia

           Ritwik Banerjee                                Marcela Ibanez
     Indian Institute of Management             Georg-August-Universität Göttingen
             Bangalore, India
           Gerhard Riener                                   Soham Sahoo
 Heinrich-Heine-Universität Düsseldorf           Indian Institute of Management
                                                           Bangalore, India

                                        April 2021

Abstract
Affirmative action changes incentives at all stages of the employment process. In this
paper, we study the effects of affirmative action statements in job ads on i) the effort
expended on the application process and ii) the manifestation of emotions, as measured
by the textual analysis of the content of the motivation letter. To this end, we use
data from two field experiments conducted in Colombia. We find that in the Control
condition, women spend less time in the application process relative to men. Besides,
female motivation letters exhibit lower levels of emotion, as measured by valence, arousal,
and dominance. However, those differences vanish in the affirmative action treatment
when we announced to job-seekers that half of the positions were reserved for women.
In the Affirmative Action condition, the time dedicated by women significantly increased
and the motivation letters written by the female candidates showed a significant increase
in the expression of positive emotions. The results indicate that affirmative action policies
can have significant encouraging effects on both effort and appeal of job applications of
women, thereby reducing the gender gap in these outcomes. (JEL: C91, J15, M52)
Keywords: Gender, Labor economics, Field experiment.

1. Introduction

Affirmative action (AA) is often a contested policy in the quest for more
diversity within organizations. Critics argue that such policies could result in
reverse discrimination and loss of efficiency (Coate and Loury, 1993; Welch,
1976), which is undesirable from a deontological and economic perspective.
In this paper, we revisit the question on the impact of AA by analyzing the
consequences of this policy in the provision of effort and self-presentation of job

Acknowledgments: This research has primarily been funded by the Courant Research Center
for Poverty, Equity and Growth, University of Göttingen. We thank Priyama Majumdar for
excellent research assistance. Corresponding author for this paper: Marcela Ibanez
E-mail: ritwikbanerjee@iimb.ac.in (Banerjee); mibanez@gwdg.de (Ibanez); riener@hhu.de
        (Riener); soham.sahoo@iimb.ac.in (Sahoo)
Banerjee et. al. Affirmative Action and Applications 2
seekers in the context of a real job offer. The behaviour at the application stage
itself is relevant as it determines the appeal of the applicant, the probability of
being employed, and influences the quality of a match.
What effect can we expect from affirmative action statements in job
advertisements on our outcome variables? Economic theory provides diverse
predictions on the impacts of affirmative action on ex-ante effort provision
(Fang and Moro, 2011). For example, Coate and Loury (1993) show that
affirmative action can decrease incentives for ex-ante effort if the employers fill
the quotas by assigning the intended beneficiaries to less skilled jobs. Similarly,
Franke (2012) shows that AA can cause inefficient outcomes when there is
considerable heterogeneity in qualifications between beneficiaries and non-
beneficiaries of the policy. However, affirmative action policy can have positive
effects on ex-ante effort provision when both groups have equal opportunity
to win the competition (Fain, 2009) and when affirmative action increases
competition (Balart, 2011).
Moreover, AA can also influence self-presentation. As people build mental
models of decision situations and interpret cues according to long learned
patterns (Hoff and Stiglitz, 2016), AA can influence the language used in a job
application context. As women perceive fair treatment and increased chances
of being employed, these cues can lead to more positive views of the job and
increase a female applicant’s confidence.
We address this question using two large field experiments with 4480 job-
seekers in Colombia. Despite remarkable progress in reducing educational
gender gaps and increasing female labor force participation, women still face
worse employment prospects than men in most of the countries. According to
the 2018 data from the UNESCO Institute for Statistics and ILOSTAT, in
Colombia, women represented a larger share of enrolled students in secondary
and tertiary education (51.2% and and 53.9%, respectively). However, women
are 30 percent less likely to participate in the labor market, receive on average
11 percent lower wages, and have a 2 percentage point higher unemployment
rate than men (Cepeda Emiliani and Barón, 2012).
Similar to Flory et al. (2015), we use an online recruitment strategy that
proceeds in two steps. First, we build a database with over four thousand job-
seekers who are interested in supporting field data collection in Colombia. At
this stage, we obtain the job-seekers’ basic socioeconomic characteristics such
as gender, residence, area of study, and the number of years of experience. In
a second step, we invite all job seekers to apply to the position by completing
a longer application process. We vary the information that we give such that
half of the job-seekers are informed that the employer is an equal opportunity
employer and that at least half of the hired assistants will be women. The rest of
the participants receive this information only after they submit the application
form. This randomized treatment design allows us to examine the effect of
affirmative action, while maintaining the ex-post information content in the
two treatments identical. We compare (i) the language the applicants usedBanerjee et. al. Affirmative Action and Applications 3
to present themselves in their motivation letters using techniques from natural
language processing (NLP) and (ii) the effort they spent during the application
procedure. Both of our outcomes of interest influence hiring decisions and hence,
contribute to the differential allocation of jobs over gender.
To assess the emotional content of an applicant’s language, we apply a
popular natural language processing technique—sentiment analysis—on the
letters of motivation and estimate how AA affects written emotional states,
particularly with respect to valence, arousal, and dominance.1 Using this
method, we can assess how applicants self-presentation is affected by AA. The
second metric we use is how diligently job seekers engage with the application
that we proxy with minutes invested in filling out the form. Besides, we use
alternative measures of effort such as the proportion of questions they answered,
the proportion of pages they visited, and whether the applicant had visited the
last page of the application form or not.
Do AA statements have heterogeneous effects on women and men? We
find that in the absence of affirmative action, women exhibit lower levels
of emotion in the statement of motivation and spend less effort in the job
application process compared to men. While women spent the same time as
men filling the application, they visited a lower proportion of pages, answered
a lower proportion of questions, and were less likely to visit the last page in
the control condition. The AA treatment significantly increases the degree of
emotion and effort that women put into the application process relative to
the baseline, suggesting that it changes job seeker perception of the decision
situation. Affirmative action leads to a significant reduction in the gender gap
in effort and self-presentation of applicants in the application process and has
no adverse effects for male job seekers.
Our paper contributes to various strands of the literature. First, laboratory-
based experiments showed that AA can help to reduce gender gaps in selection
in competitive environments, attracting relatively more skillful candidates and
without discouraging the ones ‘penalized’ by affirmative action (Niederle et al.,
2013; Balafoutas and Sutter, 2012; Beaurain and Masclet, 2016). Moreover,
AA did not reduce effort or cooperativeness irrespective of whether the rule
is exogenous or endogenously selected (Dulleck et al., 2017; Calsamiglia et al.,
2013; Balafoutas and Sutter, 2012; Balafoutas et al., 2016). However, there
is relatively little field evidence on the impact of affirmative action policies
on sorting in the labor market. Leibbrandt and List (2018) found that AA
statements can backfire, reducing applications from the ethnic minority groups
they intend to benefit. However, using field experiments, Ibanez and Riener
(2017) demonstrated that AA (quotas or preferential treatment) is effective at
closing gender gaps in application submissions and that this was not associated
1. The partition of emotions into these three parts goes back to Mehrabian and Russell
(1974) For a review of the literature on sentiment analysis based on texts, see Khan et al.
(2016).Banerjee et. al. Affirmative Action and Applications 4
with sorting out of the most qualified job seekers. We extend this line of research
to consider the effect of AA statements on the effort put into the job application
process.
Second, while recent experiments studied interventions which reduce search
costs for the unemployed (Kircher et al., 2015) or looked at changes in the search
requirements (Arni and Schiprowski, 2019), there is very little research on
gender differences in effort provided during the application process. This gender
gap, distinct from the gender gap in representation arising out of selection,
may have an important effect on the subsequent differences in competitiveness.
Our finding shows that there are significant gender gaps in effort during the
job application process. This is important as it suggests that gender gaps in
representation are observed not only at the extensive but also at the intensive
margin. AA statements not only affect selection attracting more women, the
women who choose to apply, exert more effort. The reduction in the gender
gap, in the presence of affirmative actions, may go a long way in helping us
understand the mechanisms through which such policies help increase greater
representation of women in jobs.
We also contribute to the application of text analysis to economics (see
review articles by Algaba et al., 2020; Gentzkow et al., 2019a; Varian, 2014;
Kumar and Jaiswal, 2020). Text analysis has been used to predict stock markets
(Tetlock, 2007; Das and Chen, 2007; Chen et al., 2014; Jiang et al., 2019;
Siganos et al., 2014), proxy corruption, discrimination and geopolitical risks
(Groseclose and Milyo, 2005; Gentzkow et al., 2019b; Saiz and Simonsohn, 2013;
Campante and Do, 2014; Stephens-Davidowitz, 2014), and predict economic
activity and employment (Baker et al., 2016; Da et al., 2015). However, little
is known about how job advertisement changes the applicants’ use of language
in their motivation letters. Textual features may contribute to success in job
application and evaluation. For example, Brandt and Herzberg (2020) found
critical language, use of prepositions and short text to be positively correlated
with success in job placement, while Abe (2009) shows that positive evaluations
of interns are linked to the use of positive language in their written samples. We
employ sentiment analysis—a technique from the toolkit of NLP—to analyze
the content of motivation letters of job applicants and the effects of AA on the
same.
The remaining paper is organized as follows: Section 2 describes the
literature and lays out the research hypotheses. Section 3 presents the research
design and the main experimental treatment. Section 4 presents the key results
while Section 5 offers concluding remarks.
2. Experimental Design and Procedures
Our data comes from two independent field experiments conducted in
Colombia. In both experiments, we recruited research assistants to work onBanerjee et. al. Affirmative Action and Applications 5
collecting data for research projects of two of the coauthors of this paper. The
experiments were similar in content and structure, but were implemented in two
different years. We refer to them as Assistant 1 and Assistant 2 experiment,
respectively. The recruitment strategy used in the experiments is similar to
Flory et al. (2015) and, as described in detail in Ibanez and Riener (2017),
comprises two main stages.
Stage 1: Recruitment of Job Seekers
To build a pool of job seekers, we announced the positions through newspapers,
university employment boards, social media, and email lists. We provided
general information about the positions to attract a large pool of job seekers
interested in the positions. In particular, we informed that we were recruiting
research assistants who had completed or were close to completing a bachelor’s
degree in any area of study. No previous work experience was requested. Job-
seekers were asked to fill out a statement of interest form. The announcement
elicited great interest and in the experiments 4480 individuals expressed interest
in the position.
Stage 2: Recruitment of Job Applicants
In this stage, we gave all job seekers detailed information on the conditions
of employment, job responsibilities, salary, and duration of the contract. In
addition, the sample of participants who were randomly allocated to the
affirmative action treatment (AA) received the information that the employer
was an equal opportunity employer and that half of the positions were reserved
for women. Job-seekers in the AA treatment saw the following statement
(translated from Spanish):
The University of [. . . ] is an equal opportunity employer. To increase female
participation in areas where women are up to now underrepresented, a minimum
of 50% of the hired assistants will be women.
We stratified treatment assignment based on participants’ gender (male
or female), degree of study (master or not), and area of residence (Bogota
or not). To achieve ex-post equality of information, participants allocated
to the control group received information on equal opportunity policies only
after completing the application process. Variation of the time when job-
seekers received information on the use of affirmative action policies allows
us to causally identify the impact of affirmative action statements without any
difference in the final information available in the two treatments.
In this stage, job-seekers could start filling out a lengthy application
questionnaire. They had access to a personalized page and could complete the
application form over different sessions, saving the information and continuing
the application over several days. However, a strict deadline was set after which
no application was accepted.Banerjee et. al. Affirmative Action and Applications 6
To complete the application, participants needed to obtain supporting
information such as grade certificates or detailed information on previous
employer contact information, write a motivation letter, and perform various
tests of qualification. This demanding and time-consuming stage increased the
cost of the application (time required). We interpret this time spent on the
application as a measure of the effort that participants put in completing the
application (preparing to compete in the selection process).
The top 10 applicants were invited for an interview. In the Assistant 1
experiment, three candidates (all of them women) were employed. In
Assistant 2, we hired 22 applicants, half of whom were women. Field
experiments that go over multiple sessions and that are not conducted at the
same time could suffer from information spillover. We tried to minimize this
by opening the position at the same time and by recording the starting time
of the applications, to control for potential timing effects.
2.1. Outcome variables
The outcome variables can be grouped into two broad categories: (i) the
motivation letter and (ii) measured engagement with the application form.
Motivation letter. Applicants where requested to write a motivation letter
arguing why they could be good candidates for the job. We use Natural
Language Processing (NLP) techniques to analyze the emotional state of the
applicant, as perceived from the contents of the motivation letter. We perform
sentiment analysis by using a standard library to assign scores of valence,
arousal and dominance on each word and phrase found in the text of the
statement of motivation (Warriner et al., 2013). While valence gives a measure
of how pleasant a word or a phrase is, arousal and dominance measure the
intensity of emotion and the degree of control, respectively.
Engagement with application procedure. We have four measures of the
applicant’s engagement with the application process. We recorded the time
for which the applicants had each page of the application questionnaire open.
Time invested in the application process is a good proxy of effort as the unique
format of the questionnaire meant that it was impossible for candidates to
simply copy the contents of their curriculum vitae on to the questionnaire.
Many sections required applicants to search for detailed information and input
it separately. Besides, Calafiore and Damianov (2011) show that time spent on
e-learning web-platform is associated with better test scores. To assess whether
subjects reached the last page of the application questionnaire, we used an
indicator variable equal to one for participants who reached the final page.
This includes participants who visited the page but might have not completed
the full application. This variable also acts as a proxy for effort as participants
might scroll through the pages to better prepare to complete the application.
We also record the proportion of questions completed. The two experiments
used slightly different versions of the application form. To account for thisBanerjee et. al. Affirmative Action and Applications 7
difference, we use as outcome variable the proportion of questions filled. As
participants provided more detailed information, the employers can better
assess the quality of the candidates. Moreover, more experienced candidates
would have additional information to provide. The last indicator we use is
the proportion of pages visited : Participants could complete up to 7 pages
in Assistant 1 and 5 pages in Assistant 2, this measure captures how far
participants progressed in preparing the application.
2.2. Hypothesis
Completing a job application is costly in terms of the time spent in the process,
but can be associated with a higher probability to be employed. Agents will
select the optimal level of effort to maximize the expected utility:
v = π(e)w − c(e)
In the optimum, the marginal return to effort is equal to the marginal
cost of effort: ∂π ∂c
∂e w − ∂e = 0. Since our sample comprises mainly students in
their last year of undergraduate education, it is reasonable to assume that the
marginal cost of effort is similar across genders. However, in a discriminatory
labor market that —on average— favors male candidates, women on average
expect a lower likelihood of being employed πf < πm and lower wages wf < wm
than male job seekers. When a non-discriminatory firm does not signal its type,
we can therefore expect that women would be less likely to invest effort in
completing the application. First, the marginal return to effort is lower ∂π/∂e.
Second, the marginal value of effort is lower wf < wm . We hypothesize:
Hypothesis 1. In the baseline treatment, female applicants provide lower
effort than male applicants.
If indeed women anticipate discrimination in the labor market, they may get
discouraged and consequently, invest lower effort in the job application. Firms
that voluntarily use AA policies signal a non-discriminatory type, increasing
the perceived chances for women of being employed compared to firms that do
not signal the preference for gender equity. This can lead to an increase in the
effort that a female applicant puts in the job application, which leads to our
next hypothesis.
Hypothesis 2. The amount of effort provided by women in the job application
process is higher in the presence of affirmative action.
Given role expectations under standard recruitment procedures (Hoff and
Stiglitz, 2016), we expect that women use less positive language in all three
dimensions in their motivation letter compared to men.Banerjee et. al. Affirmative Action and Applications 8
Hypothesis 3. Women manifest a lower set of positive affective emotions in
the motivation letter than men in a standard recruitment procedure.
Affirmative action changes the social environment as it may signal a
different set of expectations on the appropriate level of positive emotions in
language of the protected group and hence increases the emotional count of
their language. Hence, we formulate the following hypothesis:
Hypothesis 4. Women show a larger set of positive affective emotions within
the motivation letter in the presence of an affirmative action compared to a
standard recruitment procedure.
3. Results
3.1. Summary statistics of the two experiments
In the first stage, following the job announcements, we received the statement of
interest from 4480 people (2217 and 2263 people for Assistant 1 and Assistant 2,
respectively). Half of the applicants for each position were assigned to the
affirmative action treatment condition, with about 55% females in Assistant 1
and 50% females in Assistant 2. In the second stage, 2144 job seekers started
the application process. In Assistant 1, about 55% of the job applicants were
female, while in Assistant 2, 49% were female. Our main interest in this paper
is to analyze the gender differences in the effort for job application at this stage.
Table A.1 in the Appendix gives a detailed account of the statistics related to
the recruitment process at each stage.
Table A.4 in the Appendix presents the treatment-wise demographic
characteristics of the participants in each stage according to whether they
started the application process. We separately test whether the observable
characteristics are different between control and treatment within each stage
and report the p-values in Col (5) and (6). We find no evidence that the
treatment and control are systematically different on the basis of the observable
characteristics in either of the two treatments in stage 1. Moreover, we compare
the observable characteristics of job applicants versus job seekers (Stage 2 vs.
Stage 1) and report the p-values in columns (7) and (8) for the control and
treatment groups, respectively. We find that the p-values are less than 0.05
for a few observables2 , suggesting that there is some evidence of selection. To
address this issue, the regression analysis on the intensive margin effects uses
inverse probability weights following Wooldridge (2007). This method has been
2. Throughout the paper, we report two-sided tests and refer to results as (weakly/highly)
significant if the two-tailed test’s p-value is smaller than 0.05 (0.10 / 0.01).Banerjee et. al. Affirmative Action and Applications 9
widely used in the literature to account for the problem of non-random sample
selection (Elfenbein et al., 2010; Fitzgerald et al., 1998).
3.2. Treatment differences in the main outcomes of interest
In the analysis, we pool data from Assistant 1 and Assistant 2 experiments and
estimate the following linear probability model:
Outcomei = α + β1 AAi + β2 F emalei + β3 AAi × F emalei + β4 Xi + εi
where Outcomei represents the following four metric measuring effort of
the ith individual in our set-up: duration of time spent on the application
(standardized), whether the last page has been visited, the proportion of
questions filled out, and the proportion of pages visited.3 AAi is a dummy
variable indicating whether the participant was in the treatment group and
F emale takes value equal to one for female participants and zero otherwise.
Our main parameters of interest are β1 and β3 , which measure the effect of
Affirmative Action (AA) on male applicants and the gender gap, respectively.
Additional control variables included in the vector X are a dummy variable
indicating whether the observation is from Assistant 1 or 2, applicant’s age,
and whether the applicant holds a master’s degree.4
First, we estimate the model considering the pool of all job seekers, i.e., all
those who expressed interest in the position following the job announcement.
In this case, the outcome variables take the value zero for those who did not
start the application process.5 Thus, the estimation captures the total effect on
the extensive and intensive margin of effort provision. Second, to focus on effort
provision on the intensive margin, we estimate the model only with the pool of
job applicants, i.e., those who participated in stage 2 of the application process
where they would fill out an application questionnaire. Here, to address the
issue of selection, if any, between stage 1 and stage 2, our estimation uses the
inverse probability weighting method. Hence, the observations are weighted
by inverse of the probability of occurrence in stage 2.6 Further, we follow
3. We use the mean and standard deviation of the male applicants in the control group to
standardize the outcome variable (i.e. calculate the z-score) wherever relevant.
4. As a robustness test we estimate the model separately for Assistant 1 and 2 where we
include additional control variables specific to the experiment.
5. We present OLS estimates in the main tables as we are interested in the average marginal
effects of AA treatment by gender, for which linear models are suitable (Angrist and Pischke,
2008). However, in a robustness analysis we also estimate other appropriate nonlinear models
such as tobit, probit, and fractional probit and present the results in the Appendix. The
results are not sensitive to the choice of models.
6. We obtain the probability of selecting into stage 2 by taking the entire sample and
estimating a probit model that includes AA, all the control variables including gender, andBanerjee et. al. Affirmative Action and Applications 10
Young (2018) and use randomization statistical inference to test for overall
experimental significance. The reported p-values in the figures and tables are
corrected using Young’s randcmd command in Stata. In terms of the number
of hypotheses we correct for, we have of four outcomes analyzed in Table B.1,
three in Table C.1 and two additional outcomes in Table D.1. We test three
coefficients (AA, Female, AA×Female) for each and this gives us a total of 27
hypotheses, for which we correct the p-values.
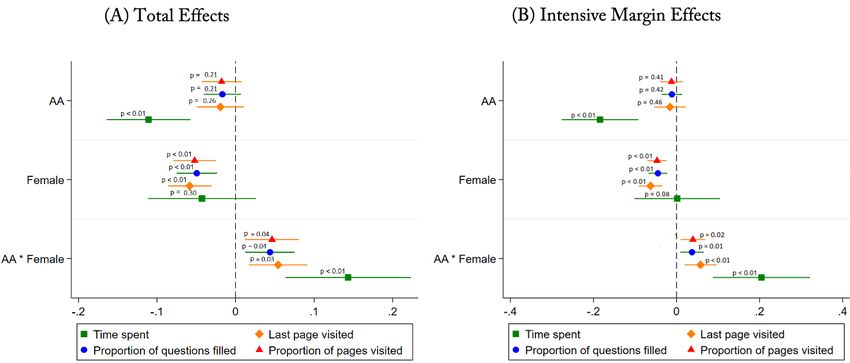
Panel A in Figure 1 presents the estimated coefficients for the total effects
and Panel B presents the estimated coefficients for the intensive margin effects.7
Qualitatively, the results are similar irrespective of whether we focus on the
total effort (Panel A) or effort on the intensive margin (Panel B). The results
suggest that in the absence of AA policy, women are significantly less likely to
visit the last page, fill out a lower proportion of questions, and visit a lower
proportion of pages than males, providing support for Hypothesis 1. When
AA is introduced, females, relative to males, increase the amount of time they
spend in filling out the application by 20.4% of a standard deviation and this is
significant at 1% level (col (2)). Likewise, the likelihood of visiting the last page
increases by 5.8 percentage points for females compared to males due to AA
treatment. Considering the proportion of questions filled out and the proportion
of pages visited by the applicants, we find that gender parity increases by
about 3.7–3.9 percentage points under AA treatment, with the estimates being
significant at the 5% level. This result is in line with Hypothesis 2. While there
is greater gender equality in effort provision, are the corresponding outcomes
of males adversely affected by AA treatment? Other than the amount of time
spent in filling out the application form, we did not find evidence that men
put less effort in the AA treatment. Overall, the results from Table B.1 suggest
that AA closes the gender gap in effort provision during the application process
relative to the baseline.
We present the results separately for Assistant 1 and 2 in the Appendix in
Tables B.2 and B.3. We broadly find similar patterns suggesting that females
spend significantly less effort on job application relative to males in the absence
of AA, especially in the Assistant 1 experiment. The AA treatment changes the
direction of the gender gap in favor of females in both experiments, with the
their interactions. The inverse of the predicted probabilities for each observation is used as
weights while estimating the regressions to capture effort on the intensive margin. We also
get similar results when we don’t use inverse probability weights; these results are available
on request.
7. Panel A in Table B.1 reports the estimation results for the complete sample, while Panel
B present the results for the sample that began the application process. For each outcome
of interest, we present the results with and without the socioeconomic controls.Banerjee et. al. Affirmative Action and Applications 11
effects being more precise for the Assistant 2 experiment. The point estimates
are also very similar to those obtained in Table B.1.8
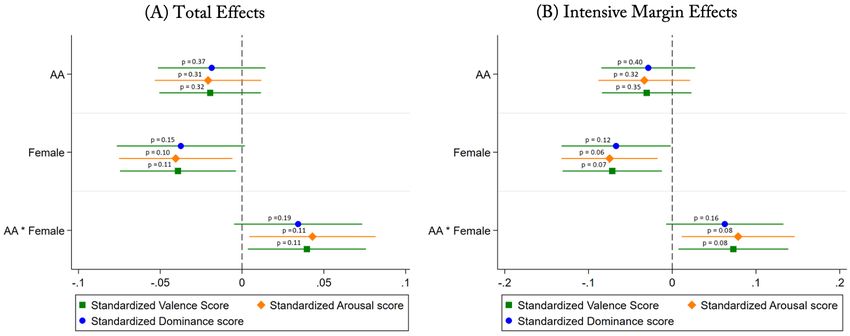
As discussed in Section 2, respondents in Assistant 1 are asked to write a
statement of motivation as a part of their application. We perform sentiment
analysis to assign scores of valence (pleasantness), arousal (the intensity of
emotion provoked), and dominance (the degree of control exerted) to the
application letters. The scores are then demeaned and divided by standard
deviation to make them comparable. We then estimate Equation 3.2 using the
standardized scores as the dependent variable. Figure 2 presents the estimated
coefficients for the total effect (Panel A) and intensive margin (Panel B), with
corrected p-values for multiple hypothesis testing.9 We report the results of
the specification that includes demographic controls and the total number
of words in the motivation letter. The results show that in the absence of
AA, the motivation letters written by females systematically exhibited lower
valence, arousal, and dominance than the ones written by males. This is
consistent with existing literature in psychology, which finds that women adopt
significantly more emotion regulation strategies in communication compared to
men (Nolen-Hoeksema, 2012; Tamres et al., 2002), and supports Hypothesis 3.
The AA treatment decreases the gender gap in the emotional value of the
motivation letter. In particular, valence increased by 7.3%, arousal increased
by 7.9%, and dominance increased by 6.3% of a standard deviation for females
compared to males, as a response to the AA treatment. Correcting for multiple
hypothesis testing, we find that at the intensive margin, the treatment effects
of AA on valence and arousal are significant at the 5% level, while that of
dominance is significant at the 10% level. Hence, the results provide support for
Hypothesis 4 and indicate that the statements of motivation written by females
in the AA treatment exhibited more pleasantness and intensity of emotion.
These attributes are significant predictors of how an applicant is viewed by
an employer and eventually how successful the job applicant is (Abe, 2009;
Brandt and Herzberg, 2020). Overall, women exhibit higher emotions in the
AA treatment and this may be a result of encouragement due to the fact that
an AA policy is in place. AA has no significant effect on male applicants’
sentiments in the motivation letter.
8. The fact that the point estimates are directionally consistent, quantitatively similar
but sometimes statistically insignificant indicates that the tests are possibly under-powered
when conducted separately for Assistant 1.
9. The estimation results are reported in Table C.1. We use three types of specifications:
one that does not include any control variables, including demographic controls, and
including the total number of words present in the statement of motivation.Banerjee et. al. Affirmative Action and Applications 12
Figure 1. Effect of Affirmative Action treatment on application-effort in Assistant-
Pooled
Note: The figure plots the treatment effects of Affirmative Action in the Assistant-Pooled data.
Panel (A) plots the coefficients for the total effects (or ITT) by including those who did not fill
out the application eventually. Panel (B) plots the coefficients for the intensive margin effects by
excluding those who did not apply. The regressions control for age and a dummy for masters’
degree. The p-values are obtained using randomization inference (Young, 2018) and are corrected
for multiple hypotheses testing using Westfall-Young multiple-testing methods.
Figure 2. Effect of Affirmative Action treatment on sentiment in Assistant-1
Note: The figure plots the treatment effects of Affirmative Action on sentiments in the Assistant-1
data. Panel (A) plots the coefficients for the total effects (or ITT) by including those who did not
fill out the application eventually. Panel (B) plots the coefficients for the intensive margin effects
by excluding those who did not apply. The regressions control for age and a dummy for masters’
degree. The p-values are obtained using randomization inference (Young, 2018) and are corrected
for multiple hypotheses testing using Westfall-Young multiple-testing methods.Banerjee et. al. Affirmative Action and Applications 13
4. Discussion and Conclusion
The effort and diligence shown by applicants in the job application process are
often important signals for employers and shape their hiring decisions. However,
the job advertisement itself may influence a job seeker’s motivation to engage
with the job application. We investigate how affirmative action statements
within application procedures influence the effort put into the application
process and the style of the motivation letter.
Our findings show that there is a significant gender gap in applicants’ effort
and motivation in job applications. Without affirmative action, female job
seekers engage less in the application procedure than males. Besides, female job
seekers use language that is less dominant and shows lower levels of valence and
arousal, which can be interpreted as having lower confidence. Hence, differences
in application could partly help to explain the gender gaps in the employment
of otherwise equivalent candidates. Affirmative action compensates for this
difference by encouraging women to put in more effort and boosting confidence
among women. The incentive effects for men are smaller in size and statistically
indistinguishable from zero, indicating that the cost of affirmative action at this
margin is low. This suggests that affirmative action policies positively influence
female engagement in the application process, leading to a more favorable self-
presentation that is likely to result in better chances of being hired.
We identify directions for future research to better understand the behavior
of applicants under affirmative action. A caveat of our study is that while the
first stage of our experiment aimed at recruiting a large pool of applicants,
we cannot rule out that women might have been discouraged in the first stage
itself. If that is the case, our study might underestimate the initial gender gap
in effort and confidence in the application. The context of our study considers
a typical middle income country, where women on average reach a higher
education level than men. In this framework, the effect of AA policies is to
increase competition among participants who otherwise have equal changes to
get employed. As implied by the theoretical models of Fain (2009) and Balart
(2011), our findings confirm that AA increases incentives to provide effort.
Future work should assess the validity of our results in contexts where there is
more heterogeneity between beneficiaries and non-beneficiaries of AA in terms
of the level of education.
One explanation of the gender difference in language use is brought
forward by Hoff and Stiglitz (2016). As subjects may interpret decision
situations according to contextual factors, AA might lead them to perceive
the environment differently and change self-presentation. Whether this is due
to strategic considerations of the applicant or a subconscious reaction to
affirmative action statements, we can not determine and hence should be
subject to further investigation. In job applications, candidates are confronted
with different expectations of role-conforming behavior: While assertiveness
often is considered important to be successful in a job, it is seen as an asset forBanerjee et. al. Affirmative Action and Applications 14 male applicants only (Brescoll and Uhlmann, 2008). This poses a dilemma for female candidates: Although job-relevant, showing increased levels of emotion at presentation may reduce the chances of obtaining a job. This channel deserves exploration in future research, as these double standards can constitute a source of gender imbalance not only in applications, but in the job itself, posing problems for firms in managing diverse teams.
Banerjee et. al.   Affirmative Action and Applications                      15

References

Abe, Jo Ann A. (2009). “Words that predict outstanding performance.” Journal
  of Research in Personality, 43(3), 528–531.
Algaba, Andres, David Ardia, Keven Bluteau, Samuel Borms, and Kris Boudt
  (2020). “Econometrics meets sentiment: An overview of methodology and
  applications.” Journal of Economic Surveys, 34(3), 512–547.
Angrist, Joshua D and Jörn-Steffen Pischke (2008). Mostly harmless
  econometrics: An empiricist’s companion. Princeton university press.
Arni, Patrick and Amelie Schiprowski (2019). “Job search requirements, effort
  provision and labor market outcomes.” Journal of Public Economics, 169,
  65–88.
Baker, Scott R, Nicholas Bloom, and Steven J Davis (2016). “Measuring
  economic policy uncertainty.” The quarterly journal of economics, 131(4),
  1593–1636.
Balafoutas, Loukas, Brent Davis, and Matthias Sutter (2016). “Affirmative
  action or just discrimination? A study on the endogenous emergence of
  quotas.” Journal of Economic Behavior & Organization. Tex.owner: gerhard
  tex.publisher: Elsevier tex.timestamp: 2016.08.16.
Balafoutas, Loukas and Matthias Sutter (2012). “Affirmative Action Policies
  Promote Women and Do Not Harm Efficiency in the Laboratory.” Science,
  335(6068), 579–582. Citation Key Alias: BalafoutasSutter2012.
Balart, Pau (2011). “Equality of opportunity and evaluation accuracy
  in asymmetric rank-order tournaments.” Tech. rep., University of
  the Baleares, URL http://paubalart.com/wp--content/uploads/2012/07/
  Eop--and--EP--in--ROT--working4.pdf.
Beaurain, Guillaume and David Masclet (2016). “Does affirmative action
  reduce gender discrimination and enhance efficiency? New experimental
  evidence.” European Economic Review, 90, 350–362.
Brandt, Pia Magdalena and Philipp Yorck Herzberg (2020). “Is a cover letter
  still needed? Using LIWC to predict application success.” International
  Journal of Selection and Assessment.
Brescoll, Victoria L. and Eric Luis Uhlmann (2008). “Can an Angry Woman
  Get Ahead?: Status Conferral, Gender, and Expression of Emotion in the
  Workplace.” Psychological Science, 19(3), 268–275.
Calafiore, Pablo and Damian S. Damianov (2011). “The Effect of Time Spent
  Online on Student Achievement in Online Economics and Finance Courses.”
  The Journal of Economic Education, 42(3), 209–223.
Calsamiglia, Caterina, Joerg Franke, and Pedro Rey Biel (2013). “The incentive
  effects of affirmative action in a real-effort tournament.” Journal of Public
  Economics, 98, 1531. Tex.owner: gerhard tex.timestamp: 2016.08.16.
Campante, Filipe R and Quoc-Anh Do (2014). “Isolated capital cities,
  accountability, and corruption: Evidence from US states.” American
  Economic Review, 104(8), 2456–81.
Banerjee et. al.   Affirmative Action and Applications                       16

Cepeda Emiliani, Laura and Juan D Barón (2012). “Educational segregation
  and the gender wage gap for recent college graduates in Colombia.” Tech.
  rep., IZA.
Chen, Hailiang, Prabuddha De, Yu Jeffrey Hu, and Byoung-Hyoun Hwang
  (2014). “Wisdom of crowds: The value of stock opinions transmitted through
  social media.” The Review of Financial Studies, 27(5), 1367–1403.
Coate, Stephen and Glenn Loury (1993). “Antidiscrimination enforcement and
  the problem of patronization.” The American Economic Review, p. 9298.
Da, Zhi, Joseph Engelberg, and Pengjie Gao (2015). “The sum of all FEARS
  investor sentiment and asset prices.” The Review of Financial Studies, 28(1),
  1–32.
Das, Sanjiv R and Mike Y Chen (2007). “Yahoo! for Amazon: Sentiment
  extraction from small talk on the web.” Management science, 53(9), 1375–
  1388.
Dulleck, Uwe, Yumei He, Michael P Kidd, and Juliana Silva-Goncalves (2017).
  “The impact of affirmative action: Evidence from a cross-country laboratory
  experiment.” Economics Letters, 155, 67–71.
Elfenbein, Daniel W, Barton H Hamilton, and Todd R Zenger (2010).
  “The small firm effect and the entrepreneurial spawning of scientists and
  engineers.” Management Science, 56(4), 659–681.
Fain, James R (2009). “Affirmative action can increase effort.” Journal of Labor
  Research, 30(2), 168175.
Fang, Hanming and Andrea Moro (2011). “Theories of statistical discrimination
  and affirmative action: A survey.” In Handbook of social economics, vol. 1,
  pp. 133–200. Elsevier.
Fitzgerald, John, Peter Gottschalk, and Robert Moffitt (1998). “An Analysis
  of Sample Attrition in Panel Data: The Michigan Panel Study of Income
  Dynamics.” Journal of Human Resources, pp. 251–299.
Flory, Jeffrey A., Andreas Leibbrandt, and John List (2015). “Do competitive
  work places deter female workers? A large scale natural field experiment on
  gender differences in job entry decisions.” Review of Economic Studies, 82(1),
  122155.
Franke, Jorg (2012). “Affirmative action in contest games.” European Journal
  of Political Economy, 28(1), 105118.
Gentzkow, Matthew, Bryan Kelly, and Matt Taddy (2019a). “Text as data.”
  Journal of Economic Literature, 57(3), 535–74.
Gentzkow, Matthew, Jesse M Shapiro, and Matt Taddy (2019b). “Measuring
  group differences in high-dimensional choices: method and application to
  congressional speech.” Econometrica, 87(4), 1307–1340.
Groseclose, Tim and Jeffrey Milyo (2005). “A measure of media bias.” The
  Quarterly Journal of Economics, 120(4), 1191–1237.
Hoff, Karla and Joseph E. Stiglitz (2016). “Striving for balance in economics:
  Towards a theory of the social determination of behavior.” Journal of
  Economic Behavior & Organization, 126, 25 – 57. Thriving through Balance.
Banerjee et. al.   Affirmative Action and Applications                      17

Ibanez, Marcela and Gerhard Riener (2017). “Sorting through Affirmative
  Action: Three Field Experiments in Colombia.” Journal of Labor Economics,
  36(2), 437–478.
Jiang, Fuwei, Joshua Lee, Xiumin Martin, and Guofu Zhou (2019). “Manager
  sentiment and stock returns.” Journal of Financial Economics, 132(1), 126–
  149.
Khan, Muhammad Taimoor, Mehr Durrani, Armughan Ali, Irum Inayat,
  Shehzad Khalid, and Kamran Habib Khan (2016). “Sentiment analysis and
  the complex natural language.” Complex Adaptive Systems Modeling, 4(1),
  1–19.
Kircher, Philipp, Paul Muller, Michele Belot, et al. (2015). “Does searching
  broader improve job prospects? a field experiment.” In 2015 Meeting Papers,
  530, Society for Economic Dynamics.
Kumar, Akshi and Arunima Jaiswal (2020). “Systematic literature review
  of sentiment analysis on Twitter using soft computing techniques.”
  Concurrency and Computation: Practice and Experience, 32(1), e5107. E5107
  CPE-18-1167.R1.
Leibbrandt, Andreas and John A List (2018). “Do equal employment
  opportunity statements backfire? Evidence from a natural field experiment
  on job-entry decisions.” Tech. rep., National Bureau of Economic Research.
Mehrabian, Albert and James A. Russell (1974). Approach to Environmental
  Psychology. MIT Press, Cambridge, MA, USA.
Niederle, Muriel, Carmit Segal, and Lise Vesterlund (2013). “How costly
  is diversity? Affirmative action in light of gender differences in
  competitiveness.” Management Science, 59(1), 1–16.
Nolen-Hoeksema, Susan (2012). “Emotion Regulation and Psychopathology:
  The Role of Gender.” Annu. Rev. Clin. Psychol., 8(1), 161–187.
Saiz, Albert and Uri Simonsohn (2013). “Proxying for unobservable variables
  with internet document-frequency.” Journal of the European Economic
  Association, 11(1), 137–165.
Siganos, Antonios, Evangelos Vagenas-Nanos, and Patrick Verwijmeren (2014).
  “Facebook’s daily sentiment and international stock markets.” Journal of
  Economic Behavior & Organization, 107, 730–743.
Stephens-Davidowitz, Seth (2014). “The cost of racial animus on a black
  candidate: Evidence using Google search data.” Journal of Public Economics,
  118, 26–40.
Tamres, Lisa K., Denise Janicki, and Vicki S. Helgeson (2002). “Sex Differences
  in Coping Behavior: A Meta-Analytic Review and an Examination of
  Relative Coping.” Pers. Soc. Psychol. Rev., 6(1), 2–30.
Tetlock, Paul C (2007). “Giving content to investor sentiment: The role of
  media in the stock market.” The Journal of finance, 62(3), 1139–1168.
Varian, Hal R (2014). “Big data: New tricks for econometrics.” Journal of
  Economic Perspectives, 28(2), 3–28.
Banerjee et. al.   Affirmative Action and Applications                    18

Warriner, Amy Beth, Victor Kuperman, and Marc Brysbaert (2013). “Norms
  of valence, arousal, and dominance for 13,915 English lemmas.” Behavior
  Research Methods, 45(4), 1191–1207.
Welch, Finis (1976). “Employment quotas for minorities.” Journal of Political
  Economy, 84(4, Part 2), S105–S141.
Wooldridge, Jeffrey M (2007). “Inverse probability weighted estimation for
  general missing data problems.” Journal of Econometrics, 141(2), 1281–1301.
Young, Alwyn (2018). “Channeling Fisher: Randomization Tests and the
  Statistical Insignificance of Seemingly Significant Experimental Results.”
  The Quarterly Journal of Economics, 134(2), 557–598.
Banerjee et. al.   Affirmative Action and Applications   19

Appendix A: Recruitment: Summary Statistics
Banerjee et. al.

!

                                                     Table A.1. Recruitment Process
    Stage                                     Assistant 1 (A1)                                 Assistant 2 (A2)
                                           Observation                % Female              Observation               % Female
                               Control % Female AA Treat % Female               Control % Female AA Treat % Female
    Stage 1 : Job-Seekers       1108    55.05     1109       55.28      55.16     1131   50.13      1132      50.27    50.20
    Stage 2 : Job Applicants    545     54.13      553       55.15      54.64     532    48.50      533       50.28    49.39
                                                                                                                                 Affirmative Action and Applications
                                                                                                                                 20
Table A.2. Summary Statistics of Assistant 1
Banerjee et. al.
Variable Definition Mean Standard
Deviation
Female =1 if female, 0 if male 0.55 0.50
Age Age in years 35.64 6.42
Master =1 if has master’s degree, 0 otherwise 0.10 0.30
Coca Region =1 if recruited for Coca region, 0 if recruited for Tobaco region 0.67 0.47
Bogota =1 if located in Bogota, 0 otherwise 0.36 0.48
Motivation count Number of words in statement of motivation 92.99 102.34
Outcomes
Valence Score | Motivation count >0* Valence score from statement of motivation 89.60 77.77
Valence Score* Valence score from statement of motivation, missing values replaced by 0 36.33 66.23
Arousal Score | Motivation count > 0* Arousal score from statement of motivation 61.64 54.28
Arousal Score* Arousal score from statement of motivation, missing values replaced by 0 24.99 45.94
Dominance Score | Motivation count >0* Dominance score from statement of motivation 90.50 78.29
Dominance Score* Dominance score from statement of motivation, missing values replaced by 0 36.70 66.78
Affirmative Action and Applications
Time Spent* Time spent in completing the questionnaire in stage 2 (in hours) 87.82 129.00
Proportion of pages visited Proportion of the total pages completed in the stage 2 questionnaire 0.82 0.32
Proportion of questions filled Proportion of the total questions answered in the stage 2 questionnaire 0.78 0.33
Last page visited =1 if visited the last page of stage 2 survey, 0 otherwise 0.36 0.48
Sample size - stage 1 2217
Sample size - stage 2 1098
Note: The variables marked with * have been standardized by demeaning and dividing by the standard deviation, before they were used for analysis.
21Table A.3. Summary Statistics of Assistant 2
Banerjee et. al.
Variable Definition Mean Standard
Deviation
Female =1 if female, 0 if male 0.50 0.50
Age Age in years 31.61 7.14
Master =1 if has master’s degree, 0 otherwise 0.09 0.29
Relative Grade Grade relative to maximum marks in the most recent educational program 0.84 0.09
Time Preference Time Preference 3.28 2.04
Risk Preference Risk Preference 5.75 2.30
CRT score Score on Cognitive Reflective Test 1.36 1.16
Extraversion Big 5 Personality Test Score: Extraversion 6.03 1.49
Agreeableness Big 5 Personality Test Score: Agreeableness 4.39 1.29
Conscientiousness Big 5 Personality Test Score:Conscientiousness 9.41 1.01
Neuroticism Big 5 Personality Test Score:Neuroticism 4.29 1.48
Openness Big 5 Personality Test Score:Openness 8.34 1.54
Outcomes
Affirmative Action and Applications
Time Spent* Ttime spent in completing the questionnaire in stage 2 (in hours) 0.53 0.22
Proportion of pages visited Proportion of the total pages completed in the stage 2 questionnaire 0.45 0.50
Proportion of questions filled Proportion of the total questions answered in the stage 2 questionnaire 0.45 0.49
Last page visited =1 if visited the last page of stage 2 survey, 0 otherwise 0.44 0.50
Sample size - stage 1 2263
Sample size - stage 2 1065
Note: The variables marked with * have been standardized by demeaning and dividing by the standard deviation, before they were used for analysis.
22Table A.4. Balance across treatments and stages
Stage 1 Stage 2 Comparisons
Banerjee et. al.
(1) (2) (3) (4) (5) (6) (7) (8)
Control Treatment Control Treatment p-values (1) - (2) p-values (3) - (4) p-values (3) - (3’) p-values (4) - (4’)
Assistant 1
Female 0.55 0.55 0.54 0.55 0.92 0.73 0.54 0.94
Age 35.56 35.72 35.46 35.32 0.54 0.71 0.60 0.04
Master 0.11 0.09 0.11 0.07 0.15 0.02 0.85 0.01
Coca Region 0.67 0.67 0.61 0.65 0.99 0.15 0.00 0.20
Bogota 0.36 0.35 0.40 0.40 0.95 0.96 0.02 0.01
N 1108 1109 545 553
Assistant 2
Female 0.50 0.50 0.48 0.50 0.95 0.56 0.30 0.99
Age 31.69 31.53 31.21 30.77 0.59 0.25 0.04 0.00
Master 0.09 0.10 0.06 0.08 0.52 0.4 0.00 0.03
Relative Grade 0.84 0.85 0.84 0.85 0.31 0.26 0.83 0.29
Risk Preference 5.74 5.77 5.68 5.79 0.82 0.43 0.37 0.76
Affirmative Action and Applications
Time Preference 3.29 3.27 3.28 3.30 0.76 0.86 0.79 0.63
CRT score 1.37 1.35 1.48 1.44 0.56 0.55 0.00 0.01
Extraversion 5.99 6.07 5.98 6.03 0.17 0.55 0.83 0.38
Agreeableness 4.38 4.40 4.33 4.46 0.69 0.1 0.18 0.15
Conscientiousness 9.43 9.39 9.38 9.40 0.40 0.81 0.18 0.80
Neuroticism 4.30 4.29 4.23 4.24 0.92 0.90 0.19 0.33
Openness 8.34 8.33 8.23 8.36 0.81 0.18 0.02 0.55
Sample Size 1131 1132 532 533
Note: Col (7) reports the p-values from comparing the control group in stage 2 with those who were in control group in stage 1 but not in the control group
in stage 2 (denoted by (3’)). Likewise, col (8) reports the p-values from comparing the treatment group in stage 2 with those who were in the treatment
group in stage 1 but not in stage 2 (denoted by (4’)).
23Banerjee et. al. Affirmative Action and Applications 24 Appendix B: Outcomes: Time and effort
Table B.1. Assistant Pooled

                                       Time spent (standardized) Last page visited Proportion of questions filled Proportion of pages visited
 VARIABLES                               (1)              (2)            (3)        (4)        (5)              (6)               (7)             (8)
 A. Total Effect
 AA                                     -0.112          -0.111          -0.020     -0.019     -0.017           -0.017            -0.018          -0.018
 p-value                               (0.000)         (0.000)         (0.217)    (0.208)    (0.166)          (0.161)           (0.172)         (0.167)
 p-value (corrected)                   (0.003)         (0.005)         (0.273)    (0.261)    (0.216)          (0.208)           (0.218)         (0.215)
 Female                                 -0.041          -0.043          -0.058     -0.059     -0.048           -0.049            -0.051          -0.052
                                                                                                                                                                   Banerjee et. al.

 p-value                               (0.249)         (0.220)         (0.000)    (0.000)    (0.000)          (0.000)           (0.000)         (0.000)
 p-value (corrected)                   (0.329)         (0.300)         (0.004)    (0.005)    (0.011)          (0.010)           (0.009)         (0.008)
 AA * Female                             0.146           0.143           0.056      0.054      0.045            0.044            0.048           0.046
 p-value                               (0.000)         (0.000)         (0.006)    (0.005)    (0.007)          (0.007)           (0.010)         (0.009)
 p-value (corrected)                   (0.009 )        (0.010)         (0.036)    (0.034)    (.0110)          (0.039)           (0.052)         (0.042)
 Constant                                0.008           0.248           0.391      0.503      0.403           0.524             0.429            0.555
 p-value                               (0.790)         (0.023)         (0.000)    (0.000)    (0.000)          (0.000)           (0.000)         (0.000)

 Observations                           4,408           4,408           4,408      4,408      4,408            4,408             4,408           4,408
 R-squared                              0.002           0.006           0.009      0.012      0.004            0.009             0.004           0.008
 B. Intensive Margins Effect
 AA                                     -0.184          -0.184          -0.016     -0.016     -0.011           -0.011            -0.012          -0.012
 p-value                               (0.000)         (0.000)         (0.427)    (0.420)    (0.378)          (0.373)           (0.388)         (0.384)
 p-value (corrected)                   (0.008)         (0.008)         (0.467)    (0.457)    (0.422)          (0.418)           (0.414)         (0.415)
 Female                                  0.002          0.002           -0.063     -0.063     -0.045           -0.045            -0.047          -0.047
                                                                                                                                                                   Affirmative Action and Applications

 p-value                               (0.972)         (0.975)         (0.000)    (0.000)    (0.000)          (0.000)           (0.000)         (0.000)
 p-value (corrected)                   (0.970)         (0.981)         (0.001)    (0.001)    (0.001)          (0.001)           (0.001)         (0.002)
 AA * Female                            0.205            0.204           0.057      0.058      0.037            0.037            0.039            0.039
 p-value                               (0.001)         (0.001)         (0.004)    (0.003)    (0.012)          (0.010)           (0.011)         (0.010)
 p-value (corrected)                   (0.007)         (0.007)         (0.009)    (0.008)    (0.017)          (0.014)           (0.023)         (0.021)
 Constant                               -0.006           0.066          0.764       0.714     0.788             0.766            0.839            0.813
 p-value                               (0.850)         (0.559)         (0.000)    (0.000)    (0.000)          (0.000)           (0.000)         (0.000)

 Observations                           2,144           2,144           2,144      2,144      2,144            2,144             2,144           2,144
 R-squared                              0.007           0.007           0.075      0.076      0.056            0.056             0.055           0.055
 Other controls                          No              Yes             No         Yes        No               Yes               No              Yes
                                                                                                                                                                   25

Note: OLS regression results for the pooled data from Assistant 1 and Assistant 2 are reported. All regressions models include a dummy for Assistant
2. Cols (1), (3), (5) and (7) report the results without controls, while cols (2), (4), (6) and (8) report the results with controls. The control variables
include the applicant’s age and whether the applicant holds a master’s degree. The estimates in the second panel (intensive margin) are weighted by inverse
probability weights. Robust standard errors clustered at the applicant’s place/university of origin. ’p-value’ presents the uncorrected p-values, while ’p-value
(corrected)’ presents the p-values corrected for multiple hypothesis testing.
Table B.2. Assistant 1
Time spent (standardized) Last page visited Proportion of questions filled Proportion of pages visited
Variables (1) (2) (3) (4) (5) (6) (7) (8)
A. Total effect
Banerjee et. al.
AA -0.139*** -0.140*** 0.006 0.004 -0.001 -0.002 -0.000 -0.001
(0.039) (0.039) (0.018) (0.018) (0.015) (0.015) (0.015) (0.015)
Female -0.005 -0.012 -0.056** -0.060*** -0.050** -0.056*** -0.048** -0.054**
(0.050) (0.048) (0.022) (0.021) (0.021) (0.020) (0.021) (0.021)
AA * Female 0.153*** 0.153** 0.034+ 0.035+ 0.032+ 0.033+ 0.029 0.030
(0.058) (0.060) (0.023) (0.023) (0.022) (0.021) (0.022) (0.022)
Constant 0.000 0.037 0.384*** 0.349*** 0.400*** 0.399*** 0.423*** 0.419***
(0.040) (0.136) (0.020) (0.045) (0.019) (0.045) (0.020) (0.045)
Observations 2,217 2,217 2,217 2,217 2,217 2,217 2,217 2,217
R-squared 0.004 0.009 0.003 0.017 0.002 0.018 0.002 0.019
B. Intensive margin effect
AA -0.228*** -0.227*** 0.013 0.011 -0.001 -0.001 0.002 0.002
(0.065) (0.064) (0.031) (0.031) (0.023) (0.023) (0.022) (0.022)
Female 0.004 0.002 -0.093*** -0.093*** -0.079*** -0.079*** -0.072*** -0.072***
(0.075) (0.074) (0.034) (0.032) (0.027) (0.026) (0.026) (0.025)
Affirmative Action and Applications
AA * Female 0.240*** 0.237** 0.048 0.050 0.044+ 0.044+ 0.035 0.035
(0.090) (0.092) (0.037) (0.037) (0.029) (0.029) (0.026) (0.026)
Constant 0.002 0.021 0.766*** 0.589*** 0.797*** 0.694*** 0.845*** 0.726***
(0.053) (0.183) (0.020) (0.051) (0.014) (0.038) (0.015) (0.033)
Observations 1,098 1,098 1,098 1,098 1,098 1,098 1,098 1,098
R-squared 0.010 0.011 0.009 0.018 0.009 0.016 0.009 0.019
Other controls No Yes No Yes No Yes No Yes
Note: OLS regression results for Assistant 1. Cols (1), (3), (5) and (7) report the results without controls, while cols (2), (4), (6) and (8) report the results
with controls. The control variables include age, a dummy for master’s degree, a dummy for Bogota and a dummy for Coca region. The estimates in the
second panel (intensive margin) are weighted by inverse probability weights. Robust standard errors clustered at the applicant’s place/university of origin
26
are reported in parentheses. *** pYou can also read


