Addressing Future Capacity Needs in the U.S. Aviation System - November 2013
←
→
Page content transcription
If your browser does not render page correctly, please read the page content below
Addressing Future
          Capacity Needs in the
            U.S. Aviation System

November 2013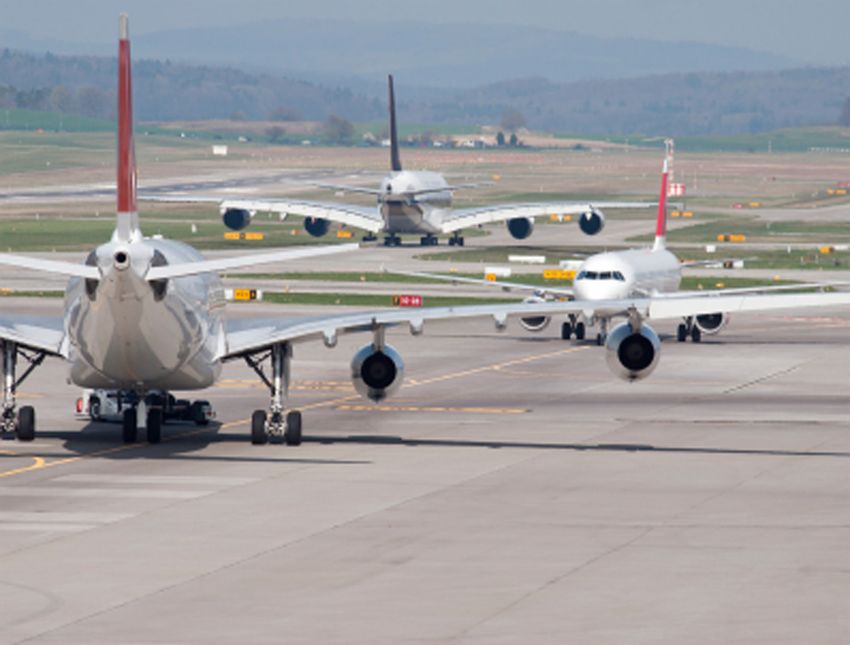
Addressing Future Capacity Needs in
     the U.S. Aviation System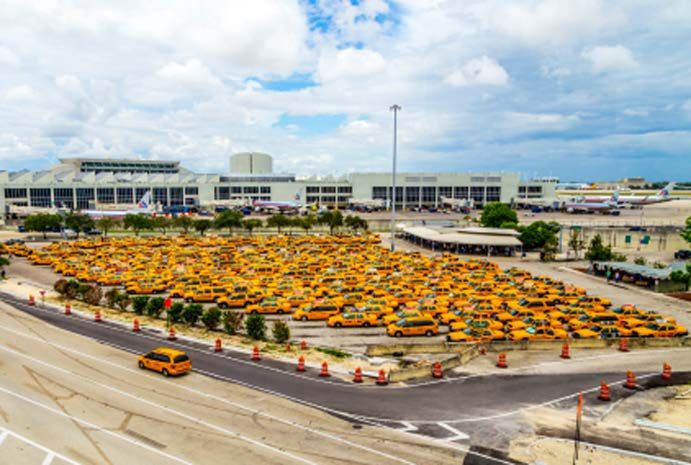
ACKNOWLEDGEMENTS
This policy paper is a culmination of a yearlong study by the Eno Center for Transportation and was funded in part
by the U.S. Travel Association. U.S. Travel brought the issue of aviation system capacity to the attention of Eno
and presented us with the task to develop an independent analysis of the system and propose ways to improve the
network in ways that benefit the nation as a whole. We would like to offer a special thanks to Erik Hansen of U.S.
Travel and Kendall Bentz of the High Lantern Group who were instrumental in the completion of this research.

We would also like to thank the expert reviewers that gave meaningful feedback on the analysis, including David
Plavin, Rob Britton, Amedeo Odoni, Mark Adams, and Jeremy Button. Their comments were invaluable to refining
our recommendations and improving the final product. Thank you.

                                                                                                      Joshua Schank
                                                                                             Eno President and CEO

ABOUT ENO
The Eno Center for Transportation (Eno) is a neutral, non-partisan think-tank that promotes policy innovation
and leads professional development in the transportation industry. As part of its mission, Eno seeks continuous
improvement in transportation and its public and private leadership in order to increase the system’s mobility, safety
and sustainability.

As the leader in its field for nearly a century, Eno provides government and industry leaders with timely research
and a neutral voice on policy issues. Eno’s Center for Transportation Policy (CTP) publishes rigorous, objective
analyses of the problems facing transportation and provides ideas for and a clear path towards possible solutions.
CTP’s policy forums bring together industry leaders to discuss pressing issues and hear from top researchers in the
field.

Eno’s Center for Transportation Leadership (CTL) is a premier training resource for the transportation industry,
offering courses and seminars to develop leaders across the career span – from emerging professionals to mid-
managers, senior leaders, CEO’s and boards of directors. CTL connects people and ideas to enhance cross-industry
knowledge and build stronger public- and private-sector organizations in the transport sector. Since its inception
CTL has instructed over 3,000 transportation professionals.

While this research was funded in part by the U.S. Travel Association, our analysis is independent and solely the
work of Eno staff.

                                                           i
TABLE OF CONTENTS
Executive Summary										1

Introduction												                                                            3

Research Approach 										                                                        3

Aviation’s Impact on the Economy and Growth in Air Travel 				                      4

Passenger Growth in Air Travel									5

Capacity Constraints in the National Aviation System					7

Capacity Constraints at the Largest International Gateway Airports			9
    John F. Kennedy Airport (JFK) – New York, New York					                  12
    Newark Liberty International Airport (EWR) – Newark, New Jersey				      15
    Los Angeles International Airport (LAX) – Los Angeles, California				    17
    San Francisco International Airport (SFO) – San Francisco, California			 19
    Research Summary										                                               21

Potential Capacity Solutions									22

Conclusions and Policy Recommendations							29

Appendix – Airport Information									33
     John F. Kennedy Airport (JFK) – New York, New York					               35
     Newark Liberty International Airport (EWR) – Newark, New Jersey				   38
     Miami International Airport (MIA) – Miami, Florida						              40
     Los Angeles International Airport (LAX) – Los Angeles, California				 42
     Chicago O’Hare International Airport – Chicago, Illinois					         44
     Hartsfield-Jackson Altanta International Airport (ATL) – Atlanta, Georgia			   46
     San Francisco International Airport (SFO) – San Francisco, California			       47
     George Bush Intercontinental Airport (IAH) – Houston, Texas				                49
     Washingotn Dulles International Airport (IAD) – Washington, DC				             50
     Dallas-Fort Worth International Airport (DFW) – Dallas, Texas				              52
     Philadelphia International Airport (PHL) – Philadelphia, Pennsylvania			       53
     Boston Logan International Airport (BOS) – Boston, Massachusetts				           54

End Notes												55

                                                 ii
EXECUTIVE SUMMARY
The United States’ aviation system plays an integral role in our economy, providing a
means to transport people and goods over long distances. Passenger travel within the
system is growing but the system’s ability to accommodate increasing travelers may be
limited. If the system is unable to offer the necessary capacity to meet passenger de-
mand, would-be passengers may choose not to travel or choose destinations other than
the United States, which could have adverse effects our economy. This paper explores
the issue of system capacity in the airspace and at select hub airports, and finds that the
U.S. aviation network in its current state is unlikely to provide adequate capacity to ac-
commodate projected growth in passengers over the next 20 years.
The aviation system is responsible for    hub airports. Recent mergers in the       lems at some of our largest hub air-
approximately 4.9 to 5.2 percent of       airline industry have resulted in a few   ports will be challenging. JFK, EWR,
the United States’ Gross Domestic         large airlines controlling the largest    and SFO all face substantial barriers
Product (GDP).1 Domestically, the         shares of the market. With fewer air-     to airside and airspace capacity ex-
aviation industry generates between       lines operating fewer hubs, many air-     pansion. The capacity constraints at
$1.2 and $1.3 trillion in annual eco-     ports have experienced a reduction        JFK and EWR are the most immedi-
nomic activity and provides between       in flights and congestion. Delays at      ate, as those airports are already near-
9.7 and 10.5 million jobs.2 Interna-      hub airports can create ripple effects    ing their maximum capacity. We esti-
tional travelers contribute over $116     and cause delays at smaller, generally    mate that the U.S. economy will lose
billion annually in direct spending to    uncongested airports. Not all airports    out on over $6 billion of lost travel
the U.S. economy. Further, in 2011        within the system are experiencing        spending in 2016 due to unmet de-
international visitors contributed $1     capacity constraints, but due to the      mand at the JFK and EWR, primar-
billion to the economy in indirect ex-    interconnectivity of the system those     ily from would-be overseas travelers.
penditures.3 Passenger numbers are        with constraints create congestion        This is estimated to balloon to nearly
growing, and are projected to con-        nationwide.                               $48 billion annually by 2034. SFO has
tinue to increase. The Federal Avia-                                                sufficient capacity to handle increas-
tion Administration (FAA) estimates       In order to better develop an un-         es in traffic during fair weather, but
in 2016 the U.S. aviation system will     derstanding of the capacity issues at     when poor visibility occurs, as it does
provide service to 800 annual passen-     our nation’s airports, we analyzed the    often in the Bay Area, the capacity is
gers, potentially swelling to 1 billion   busiest international airports in the     severely restricted. Weather delays at
annual passengers by 2027.4 In order      U.S. and selected case studies that are   SFO will grow worse as passengers
to capture the economic value asso-       among the busiest airports for do-        increase. And while LAX has suffi-
ciated with this passenger travel, the    mestic and international travel. The      cient runway capacity, it has landside
aviation system will have to adjust to    four airports selected for detailed       capacity and airport access issues that
accommodate the demanded capac-           review — John F. Kennedy Interna-         will constrain future demand.
ity.                                      tional (JFK), Newark Liberty Inter-
                                          national (EWR), Los Angeles Inter-        Funding, physical space, and other
Capacity constraints within the avia-     national (LAX), and San Francisco         political challenges have left these
tion system stem from airport in-         International (SFO) — were chosen         airports with few plans to develop
frastructure, airport access, and the     due to their status as major hubs         needed capacity and improvements,
existing regulations and rules. Since     and international gateways, their         and it is unclear which investments
deregulation, airlines are increasingly   projected growth, and their capacity      will have the greatest benefits to the
employing the hub-and-spoke sys-          constraints. The case studies demon-      national system. However, if we take
tem, concentrating activity at their      strate that addressing capacity prob-     an appropriate perspective in focus-
                                                             1
ing on national benefits from tar-         investment to the greatest na-        • Relax the current federal restric-
geted investments solutions exist that     tional interest: Current AIP funds    tions on the airport PFC to allow
can relieve congestion at these air-       are distributed via formula, with non-airports to raise revenues from us-
ports and in the larger aviation sys-      primary airports receiving 35 percent ers: While from a policy perspective
tem. These solutions include:              of all funding and the remaining      it is understandable that the federal
                                           spread amongst the remaining pri-     government might want to regulate
• Operational Changes: Capacity
                                           mary airports. Reforming the AIP to   how much airports can charge pas-
improvements do not always require
                                           target funding to where it provides   sengers, this is an argument for main-
expensive and politically challenging
                                           the greatest national benefit would   taining a cap on PFC charges, not
infrastructure expansions, especially
                                           go a long way towards making ad-      for maintaining it at the current rate
if they are targeted towards the ar-
                                           equate funding available to support   of $4.50. At a minimum, the FAA
eas of greatest need. One potentially
                                           necessary upgrades in our aviation    should be given discretion to increase
cost-effective way to improve our
                                           infrastructure.                       the PFC cap if and when an airport
transportation network is to use what
                                                                                 can demonstrate the need for more
we already have more effectively, ei-      • Create a new federal discretion-
                                                                                 investments in order to accommo-
ther through a regulatory framework        ary grant program to address im-
                                                                                 date demand in the national aviation
or through market-based pricing of         provements and innovation in
                                                                                 system.
valuable peak capacity.                    airport operations: The new discre-
                                           tionary program would be targeted
• Air Traffic Control Improve-                                                   We recognize that there are substan-
                                           more towards the political obstacles
ments: NextGen, a nationwide state-                                              tial barriers to implementing these
                                           than the funding obstacles, and more
of-the-art modernization program                                                 policy recommendations, including
                                           towards operations than infrastruc-
for air traffic control, promises to re-                                         from existing stakeholders. Given the
                                           ture. Airports and other entities
place the existing radar-based system                                            stakeholder limitations and the very
                                           wishing to relieve congestion in the
used by the aviation industry with a                                             real national need to address capacity
                                           national aviation system could apply
system that uses satellite based GPS.                                            constraints in the U.S. aviation system,
                                           for grants from the FAA. By creating
Since GPS can provide more precise                                               a large effort by non-stakeholders
                                           competition with ideas around the
location information, NextGen can                                                will likely be necessary to address this
                                           country for relieving congestion and
allow for substantial benefits in terms                                          problem from a national perspective.
                                           creating national economic benefits,
of fuel costs and capacity improve-                                              Change will likely occur only when
                                           this program could foster innovative
ments.                                                                           the larger business community comes
                                           ideas such as peak runway pricing or
                                                                                 together to call for substantive policy
• Airport Infrastructure Improve-          other operational changes.
                                                                                 changes addressing how we operate
ments: At some major airports, even
                                           • Explore the idea of separating and fund our aviation infrastructure.
with operational improvements and
                                           the air traffic control and safety
NextGen implementation, there will
                                           functions of the FAA to acceler- The aviation system plays a funda-
not be sufficient capacity to accom-
                                           ate the delivery of NextGen: The mental role within our economy and
modate demand. The four case stud-
                                           simplest way to separate these func- within our transportation system,
ies in this report represent only a
                                           tions is to create two separate gov- both domestically and worldwide.
sampling of the U.S. airports that will
                                           ernment agencies, but another alter- As demand grows, the aviation sys-
need direct investment in landside or
                                           native would be to corporatize the tem must adjust and grow with it
airside capacity in order to accommo-
                                           new entity into a nonprofit. Either or risk the potential loss of revenue
date future growth and reduce delays.
                                           way might allow the new organiza- and negative affects on our economy.
                                           tion to behave more like a business Solutions exist, and while they are
Taking into account these potential
                                           with respect to investment decisions, politically challenging, they have the
solutions, we provide four policy rec-
                                           particularly related to NextGen, and potential to be moved forward. If we
ommendations:
                                           provide operators with more certain- are successful, the United States will
• Restructure the federal Airport          ty about technological advances.      have the ability to remain as a global
Improvement Program to target                                                    competitor in aviation travel.

                                                             2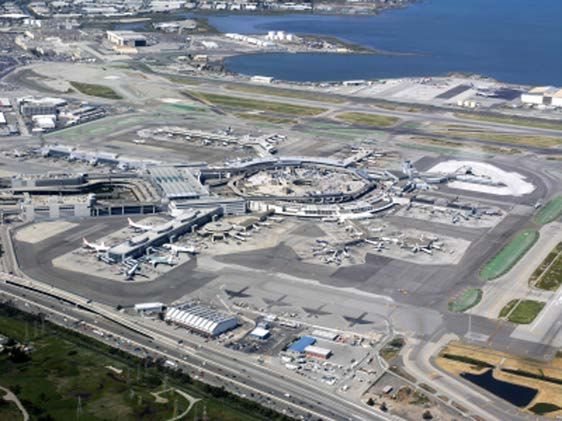
INTRODUCTION
The aviation system in the United States is an essential component of the U.S. economy,
providing a means for efficient, long haul travel. The FAA, an operating administration
of the U.S. Department of Transportation (USDOT), currently predicts an annual pas-
senger growth rate of 2.2 percent, adding an additional 400 million annual passengers to
the system by 2033.5 Yet our nation’s aviation infrastructure may not be capable of ac-
commodating the predicted growth in demand. A few of the United States’ largest hub
and international airports are already congested and demand is projected to increase.6
This congestion creates systematic delays, increases costs, adversely affects passenger
experience, and ultimately hinders would-be travelers from planning trips to the U.S.

This paper examines the following national economic benefits that could              overcoming those constraints, and
aspects of the national aviation sys- result from improvements to our                their current and projected impacts
tem:                                  aviation system. Substantial legal and         on travel. Finally, the analysis exam-
                                      political barriers must be overcome            ines stakeholders and policies, evalu-
• Aviation’s impact on the econo-
                                      in order to implement these solutions          ating how they are working to address
    my and growth in air travel
                                      and ensure that future demand for              this problem. The paper concludes
• Capacity constraints in the na-
                                      travel within and to the United States,        by presenting a number of policy
    tional aviation system
                                      and the economic benefits associated           recommendations to overcome those
• Capacity constraints at the largest
                                      with it, can be captured. But our anal-        barriers by better orienting federal
    international gateway airports
                                      ysis indicates that this is a challenge        policy towards the national benefits
• Potential capacity solutions
                                      that is worth the effort.                      of reducing congestion in our avia-
                                                                                     tion network.
The exploration of these issues dem-
                                           Research Approach
onstrates that the present aviation
                                           Our analysis examines projected
system, and its planned expansions, is
                                           growth in aviation for both domes-
unlikely to provide adequate capacity
                                           tic and international passengers. It
to accommodate projected growth
                                           examines where capacity constraints
in passengers over the next twenty
                                           exist both within the broader avia-
years. The problem is most acute at a
                                           tion network and at four large inter-
few large airports that significant bar-
                                           national airports used as case studies:
riers to increasing their capacity. Not
addressing these problems would
                                           •   New York John F. Kennedy
result in net economic losses and a
                                               International Airport (JFK)
diminished travel experience within
                                           •   Newark Liberty International
the United States. The U.S. has the
potential to be a global competitor in         Airport (EWR)
                                           •   Los Angeles International
terms of travel, but failing to imple-
                                               Airport (LAX)
ment system-wide innovations to
                                           •   San Francisco International
provide for the projected increase in
passenger demand will result in our            Airport (SFO)
nation falling behind. Solutions exist,
but current federal policy in aviation     For each case study we identify spe-
is not oriented towards maximizing         cific capacity constraints, barriers to
                                                             3
AVIATION’S IMPACT ON THE ECONOMY
The value of the nation’s aviation system is partially rooted in its ability to continually
contribute to the United States’ economy. Aviation bolsters the U.S. economy and well-
being by facilitating the flow of information, goods, investment, and human capital,
providing a means for international and domestic travelers to invest in U.S. products and
services, and fostering global connectivity for business and personal benefit.
Commercial aviation’s role in the
United States’ economy establishes                             U.S. International Travel Receipts
an incentive to maintain and grow                                          ($ billions)
                                                              $120
the nation’s system, strengthening
our fiscal resiliency. This section pro-                      $100

vides insight into this economic role,                         $80
reinforcing this pivotal relationship.                         $60

                                                               $40
The aviation system provides a po-
                                                                     2000
                                                                            2001
                                                                                   2002
                                                                                          2003
                                                                                                 2004
                                                                                                        2005
                                                                                                               2006
                                                                                                                      2007
                                                                                                                             2008
                                                                                                                                    2009
                                                                                                                                           2010
                                                                                                                                                  2011
tential vehicle for increased eco-
nomic benefits if the U.S. is able to
accommodate and stimulate growth                            Figure 1: U.S. International Travel Receipts13
in passenger and freight traffic. An
August 2011 FAA report7 found that
commercial aviation was responsible         also result from exchanges that occur                              ternational cities whose populations
for 4.9 to 5.2 percent of U.S. gross        during international visitors’ stay on                             exceeds 10 million, with more than
domestic product (GDP), a value             U.S. soil. Spending from international                             900,000 international flights per year
echoed in a May 2012 report by the          travelers in the U.S. hovered between                              to 279 airports in 108 countries. As a
International Air Transport Associa-        $400-500 billion annually from 1995-                               result, the U.S. is one of the world’s
tion (IATA)8 that estimated $669.5          2003, and in the past decade has been                              best-connected economies relative to
billion in GDP (4.9 percent). Of that       increasing, reaching over $1 billion in                            its economic size.15 More than 53 bil-
share, IATA found that $206.4 billion       2011, demonstrated in Figure 1. In                                 lion revenue ton-miles of scheduled
(30.7 percent) was contributed di-          2009, U.S. air carriers transported 793                            freight passed through U.S. airports
rectly by airlines, airports, and related   million passengers over $1039 billion                              in 2009, and around $562 billion of
ground services.9 According to the          revenue passenger miles. These pas-                                freight was transported domestically
FAA, the U.S. domestic aviation in-         sengers spent a collective amount                                  to other countries.16 Table 1 sum-
dustry generates $1.2-$1.3 trillion in      of $249 billion on aviation goods                                  marizes the economic impact of the
overall annual economic activity and        and services, not to mention other                                 commercial aviation industry as re-
between 9.7 and 10.5 million jobs.10        spending on travel related goods or                                ported by the FAA, highlighting the
                                            business activity.14 U.S. airports pro-                            importance of the industry to the
International visitors alone contrib-       vide 361 direct connections to in-                                 economy.
ute over $116 billion in direct spend-
ing to the U.S. economy.11 The av-           Economic Impact of Commerical Aviation on the U.S. Economy (2006-2009)
erage overseas traveler spends more
                                             Economic Activity/Output (annual)                                                  $1.2 - $1.3 trillion
than $3,200 on a visit to the United
States, while the average traveler           Personal Earnings (annual) 		                                                      $370 - 405 billion
from China, a rapidly growing mar-           Share of GDP 				                                                                  4.9 - 5.2%
ket segment, spends over $7,000 per          Job Impact 				                                                                    9.7 - 10.5 million jobs
visit.12 Further economic benefits
                                             Table 1: Economic Impact17
                                                              4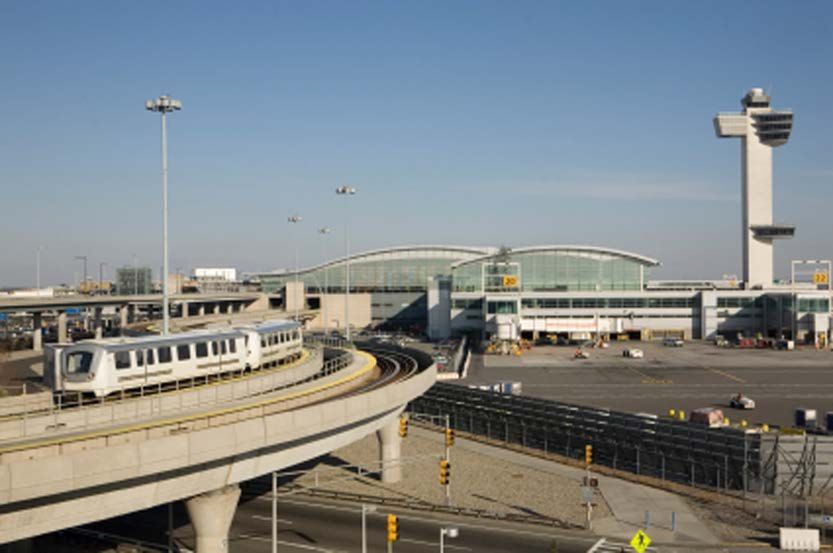
PASSENGER GROWTH IN AIR TRAVEL
Aviation is an economic driver that is currently undergoing substantial growth both do-
mestically and internationally. The most recent passenger projections were released in
the FAA’s annual Aerospace Forecast Fiscal Years 2013-2033 (Figure 2), estimating that
in 2016, the U.S. will handle 800 million total annual passengers, growing to 1 billion by
2027, and potentially reaching 1.2 billion by 2033.18 While the total number of domestic
passengers is growing faster than international passengers, the rate of growth for inter-
national traffic is higher, with most new traffic expected to originate from Latin America
and Asia. International passengers are expected to grow to account for 16 percent of
total passengers in 2033, up from 11 percent in 2012.

Under the assumption of “stable                          International Vistiors                    ally, with Department of Commerce
worldwide economic growth,” the                          Though international travelers only       projections estimating 76.6 million
FAA projects international passenger                     account for 11 percent of the total       visitors in 2016, and 106.6 million by
enplanements, or boardings, to to-                       traffic in the U.S., the international    2034.23
tal 185.7 million in 2033, illustrated                   market is a key driver of growth. In-
in Figure 2. For domestic travel, the                    ternational passengers contribute dis-    While Canada and Mexico continue
FAA estimates a stable growth rate                       proportionately to the economy and        to be the largest source of inter-
of passenger traffic at 2.1 percent                      constitute a large portion of travel-     national passengers, growth from
through 2033, leading to a projection                    ers at the largest hub airports. Since    overseas Latin American and Asian
of 1.15 billion enplaned passengers                      2003, the number of international ar-     markets is leading projected demand.
by 2033.19 Passenger trip length is                      rivals to the U.S. has grown relatively   Table 2 shows the top ten inbound
forecasted to continue to increase                       continuously, hitting a record high 67    markets to the U.S., with Brazil and
through 2033, reflecting an increase                     million in 2012.22 The U.S. is project-   China doubling traffic from 2008 to
in longer domestic and international                     ed to remain the single largest market    2011.
trips.21                                                 for international passengers glob-

                    Historical and Projected Passenger Traffic, U.S. Aviation Network (FAA)
                                 1400
   Annual Passengers, millions

                                 1200
                                 1000
                                                                                                                    Domestic
                                  800
                                                                                                                    International
                                  600
                                                                                                                    System
                                  400
                                                                                                                    Current Year
                                  200
                                    0
                                   2000   2005   2010        2015       2020      2025        2030       2035    Year

                     Figure 2: Projected Growth in the U.S. Aviation Market, Annual Passengers (millions)19

                                                                            5
According to the U.S. Department of            Origin Countries of Foreign Arrivals into the U.S.
Commerce, international air traffic to
and from the U.S. totaled 89.7 million                                          2008       2009       2010       2011
passengers from June 2012 to June              Canada                     18,915,000 17,977,000 19,964,000 21,337,000
2013. Of that, 40 million were U.S.                                       13,686,000 13,229,000 13,469,000 14,391,000
                                               Mexico
citizens, and the remaining 49.7 mil-
lion were non-U.S. citizens. Of the            United Kingdom              4,564,895 3,899,167 3,850,864 3,835,300
total number of international air traf-        Japan                       3,249,578 2,918,268 3,386,076 3,249,569
fic, U.S. operated airlines carried 48.3       Germany                     1,782,299 1,686,825 1,726,193 1,823,797
million passengers and foreign air-                                          769,232    892,611 1,197,866 1,508.279
                                               Brazil
lines carried 41.4 million passengers
out of American airports.25 Foreign            France                      1,243,942 1,204,490 1,342,207 1,504,182
carriers play a major role in transport-       South Korea                   759,394    743,846 1,107,518 1,145,216
ing international passengers, yet they         China                         492,958    524,817    801,738 1,089,405
often rely on U.S. carriers to shuttle                                       689,927    723,576    904,247 1,037,852
                                               Australia
passengers to their final destinations
beyond the gateway airports.                   Table 2: Arrivals from the Top 10 Inbound Countries to the U.S.24

Recent trends are expected to con-
tinue, with air travel projected to
continue to increase on a global scale
over the next 20 years. IATA proj-                           World International Tourism Arrivals
ects global air traffic to reach ap-                                      (millions)
proximately 3.6 billion passengers in
                                                    1,100
2016, suggesting a 5.3 percent annual               1,000
passenger growth rate from 2016 to                    900
2011.26 Figure 3 illustrates the con-                 800
                                                      700
tinuous growth of world internation-                  600
al tourist arrivals since 1995, hover-                500
ing around 1 billion in 2011.                         400
                                                            2000

                                                                   2001

                                                                          2002

                                                                                 2003

                                                                                        2004

                                                                                               2005

                                                                                                      2006

                                                                                                             2007

                                                                                                                    2008

                                                                                                                           2009

                                                                                                                                  2010

                                                                                                                                         2011
Although inbound international trav-
el to the U.S. is increasing, the U.S. has         Figure 3: World International Tourism Arrivals22
lost significant market share globally
over the past decade. In part due in-
creased economic activity in other re-
gions of the world and in part due to        to reform security and visa proce-   national passengers and recapturing
security and visa restrictions imposed       dures. However, if U.S. hub and in-  lost global market share could have
after September 11, 2001, the U.S.           ternational airports lack capacity toconsiderable benefits for the U.S.
market has declined from 17 percent          move these would-be passengers,      economy. In order to reclaim any
of the global market in 2000 to 12.4         such efforts will not be as effective as
                                                                                  previous loss in the global market,
percent today.                               they could be.                       however, substantial and innovative
                                                                                  policy changes and infrastructure in-
In efforts to raise this market share,       Providing capacity for the projected vestments will likely be required.
the groups are encouraging Congress          growth in both domestic and inter-

                                                                    6
CAPACITY CONSTRAINTS IN THE NATIONAL AVIATION SYSTEM
The U.S. aviation network’s ability to accommodate growing passenger demand is pivotal
for the industry and the economy. This section examines the national aviation network
in terms of capacity, demonstrating the interconnectedness of the system and establish-
ing the necessity for a system-wide approach to capacity constraints.
According to the 2011-2015 National Capacity Projections largest airports and an increased in-
Plan of Integrated Airport Systems In the United States, the FAA is the tensity of use of the hub-and-spoke
(NPIAS) released by the FAA, there principal authority for traffic projec- air traffic model by the largest do-
are currently over 19,700 airports tions for the nation’s aviation system. mestic airlines.
operating in the United States to- The most recent FAA capacity analy-
day. About 5,000 of those airports sis report, “Capacity Needs in the In the 2007 report, the FAA identified
are open to the general public, and a National Airspace System 2007-2027 four airports that needed immediate
little over 500 of those airports offer (FACT 2)” was released in 2007.32 It capacity expansion: Newark (EWR),
commercial service.29 Of those, 382 contains capacity analyses of exist- Fort Lauderdale (FLL), O’Hare
airports are considered “primary,” ing U.S. airport infrastructure and (ORD), and LaGuardia (LGA). By
defined as airports with more than projects airport capacity for the 291 2015, the report predicts that 18 air-
10,000 annual passenger boardings. largest commercial service airports in ports will need capacity beyond cur-
Primary airports are responsible the country for the years 2007, 2015, rent infrastructure and in 2025 that
for 99.75 percent of all commercial and 2025. FACT 2 identifies airports number will grow to 27. The report
air passenger traffic in the United with capacity or delay constraints and was produced and published with
States.30 The largest primary airports makes recommendations for the ex- data and projections made prior to
handle an outsized proportion of pansion of these airports based on the recession in 2008 but air traffic
that traffic: the 20 busiest airports in FAA air passenger traffic projections. has since rebounded to pre-recession
the U.S. handle more than 57 percent levels and demand is expected to
of all air passengers.31 Commanding FACT 2 indicates that the number continue to grow.
the bulk of aviation passengers, con- of smaller and medium hub airports
gestion and capacity issues at the larg- needing additional capacity has de- Many of the issues that were facing
est airports have a greater effect on creased, while the number of large the U.S. aviation network in 2007 are
the aviation system as a whole. This hubs needing capacity has increased.33 still relevant today. Aside from pas-
analysis focuses on primary airports, This has been the result of a greater senger volumes, other changes in the
specifically the largest hubs, and their concentration of airport traffic at the aviation network since 2007 have had
capacity to accommodate aircraft and
passengers.
There are three principal types of Airline Merged Into Year
aviation capacity discussed in this
America West U.S. Airways 2005
analysis:
Northwest Delta 2009
• Airside Capacity: Runways and Midwest Frontier 2010
taxiways at airports Continental United 2010
• Landside Capacity: Terminals AirTran Southwest 2011
and gates to process passengers,
U.S. Airways American 2013 (proposed)
and ground access and, parking
• Airspace Capacity: Regulations
Table 3: Major U.S. Airline Mergers, 2004-2013
and rules on minimum separa-
tions between aircraft in flight
7substantial effects on the capacity of acquisition of Trans World Airlines amount of delayed aircraft or pas-
the network. (TWA) in 2001, St. Louis ceased to sengers in a hub-and-spoke system
be an American hub and following because initial delays radiate through-
Delays resulting from restricted ca- the Delta–Northwest merger, ser- out the system.
pacity and increased demand do not vice at Delta’s hub in Cincinnati and
affect all airports evenly. Airline con- Northwest’s hub in Memphis has Since deregulation in 1978, the airline
solidation has resulted in fewer hub been greatly reduced.”25 industry has relied increasingly on
airports, and remaining airlines have the hub-and-spoke network to orga-
concentrated their presence and air Table 4 shows how some medium nize air traffic. This system results in
routes at those airports. The aviation hub airports such as Cincinnati, the necessity for most travelers, both
industry once had dozens of airlines Cleveland, and Memphis have experi- domestic and international, to make
serving many domestic and interna- enced dramatic declines in passenger a connecting flight to reach their final
tional markets, but in the past decade traffic since 2006, due in part to the destination. The interconnectivity of
several airline mergers have occurred, number of mergers that have already the aviation network results in delay
shown in Table 3. Assuming the U.S. occurred. Some of the decline can be increases having strong ripple effects
Airways and American merger is attributed to the economic recession, across other large airports across the
completed, the five largest airlines but since 2006 overall air traffic in the entire country.
(American Airlines, Delta, United, U.S. is up almost 5 percent.
JetBlue, and Southwest) will control Moreover, with fewer airlines oper-
over 73 percent of all domestic air The airports that have experienced ating larger networks, the number
traffic.34 traffic reductions have not necessarily of medium-sized hubs is falling and
experienced a corresponding reduc- the passenger volumes at the large
In June 2013, Gerald Dillingham, tion in delayed flights. At each of the hubs are increasing.39 The consolida-
Director of Physical Infrastructure five airports listed in Table 4, all ex- tion of more traffic to fewer airports
Issues at the Government Account- perienced only a moderate increase in constrains capacity at the larger hub
ability Office (GAO), testified be- on time performance.37 The average airports, even if overall traffic is not
fore the U.S. Senate on how mergers delay per delayed aircraft increased at growing. This can be made worse
could lead to reductions in redundant the airports except for St. Louis and when an airline, in an effort to cre-
hubs, specifically in the case of the Pittsburgh, which only saw a modest ate convenient schedules for pas-
proposed American Airlines and U.S. decline in delay time, shown in Figure sengers, schedules more flights than
Airways merger. He reminded the au- 4. A reduction in traffic at a specific the airport can realistically handle.
dience that, “Following the American airport does not always reduce the In many cases delays at hubs are not
Hub Airport Hub Airline Departing Departing Change
Passengers Passengers
(2006) (2012)
Cincinnati Delta 7,506,000 2,813,000 -62.5%
Cleveland Continental 5,298,000 4,194,000 -20.8%
Memphis Northwest 5,288,000 3,320,000 -37.2%
Pittsburgh US Airways 4,841,000 3,808,000 -21.3%
St. Louis American 6,877,000 6,103,000 -11.3%
Table 4: Passengers in Mid-sized Hub Airports36
8directly caused by limited capacity at ternational travel for the economic jor hubs and international gateways,
those hubs, but by tight scheduling vitality of the United States. In re- their projected growth, and their
of flights by airlines to accommodate sponse to these projections for in- capacity constraints. These airports
their hub-and-spoke network. creased domestic demand and a heavy are not the only airports with capac-
influx of international visitors to the ity constraints, but they highlight ar-
FAA’s FACT 2 report states that “not U.S., the state of the nation’s aviation eas that are experiencing the greatest
only is the volume of aircraft at most system needs to be examined. problems. The Appendix presents
large hubs expected to increase over the selection process for these four
the next 20 years, the mix of aircraft Capacity Constraints at the detailed case studies. Tables 5 and 6
operating at most large hubs is also Largest International summarize the findings and conclu-
expected to become increasingly Gateway Airports sions of the Appendix.
complex over the forecast period.”40 In order to develop a better under-
Although overall activity at control standing of the capacity issues at our Our analysis found that congestion
towers fell in 2011, activity at the nation’s airports, we analyzed the problems were mostly limited to a
largest airports increased and delays busiest airports in the U.S. to select few airports. Other large hub air-
remained at historically high levels. case studies that 1) are among the ports, such as Miami, Atlanta, Chica-
In the last five years, large airports busiest airports for domestic and in- go-O’Hare and Denver, have expe-
have experienced a higher rate of ternational travel; and 2) demonstrate rienced increased volumes but have
increase in total enplanements than significant capacity and delay prob- made investments in infrastructure
smaller airports, and it is likely that lems. The four airports selected for to enable them to handle projected
this increased demand will continue detailed review — John F. Kennedy demand for many years. The follow-
to cause congestion and delays. International, Newark Liberty Inter- ing section describes the case studies,
national, Los Angeles International, examining their existing and future
The magnitude of these global pas- and San Francisco International — landside, airside, and airspace capac-
senger growth trends demonstrates were chosen due to their status as ma- ity.
the importance of domestic and in-
70
Average Delay per Delayed Aircraft,
60
50
2008
40
minutes
2009
30
2010
20 2011
10 2012
0
Cincinnati Cleveland Memphis Pittsburgh St. Louis
(CVG) (CLE) (MEM) (PIT) (STL)
Airport 2008-2012
Figure 4: Average Delay at Mid-Sized Hub Airports38
9Airport Code Total Int’l Percent Int’l Share of Passenger Largest Airline
Passengers Passengers (2012) Domestic Growth Rate Carriers (2012)45
(2012) 41
(2012)42
Connecting (2003-2013)44
Passengers
(2009)43
JFK 49,034,266 24,774,644 51% 29% 68.7% JetBlue (38.6%)
Delta (22.6%)
American (16.7%)
EWR 33,952,143 11,145,313 33% 29% 17.4% United (50.1%)
MIA 37,033,951 18,516,559 50% 49% 33.9% American (71.4%)
Delta (11.2%)
ATL 91,466,491 9,576,889 10% 69% 21.4% Delta (66.4%)
AirTran (13.7%)
LAX 62,604,533 16,541,798 26% 28% 20.3% United (18.7%)
American (18.7%)
Southwest (15.9%)
ORD 64,222,204 10,187,557 16% 54% 5.0% United (27.5%)
American (22.5%)
SFO 42,616,804 9,144,975 21% 27% 32.4% United (37.9%)
SkyWest (11.4%)
IAH 38,020,084 8,477,922 22% 60% 20.6% United (57.7%)
ExpressJet (20.9%)
IAD 21,610,571 6,461,788 30% 45% 55.9% United (42.0%)
ExpressJet (13.6%)
DFW 56,033,767 5,805,920 10% 61% 15.1% American (85.1%)
PHL 29,179,750 3,735,700 13% 41% 32.6% US Airways (40.6%)
Southwest (8.7%)
BOS 28,620,708 4,064,918 14% - 33.2% JetBlue (28.0%)
United (13.4%)
US Airways (13.0%)
Table 5: Airport Information Related to Passengers, Summary of Analysis in the Appendix
10Expected Landside,
Investment in Airside and/or
Airport Number of Runway FAA Slot Terminals48 Gates49 Airspace Capacity
Airport Code
Footprint in Capacity Control
Runways47 Problem?
Acres46 Over Past
Decade?
JFK 5,200 acres 4 Yes Yes 8 117 Short Term
EWR 2,027 acres 3 No Yes 3 61 Short Term
MIA 3,300 acres 4 Yes - 3 119 Long Term
ATL 4,700 acres 5 Yes - 2 239 Medium Term
LAX 3,500 acres 4 Yes - 9 153 Short Term
ORD 7,627 acres 8 Yes - 4 172 Long Term
SFO 5,207 acres 4 No - 4 87 Short Term
IAH 10,000 acres 5 No - 5 181 Long Term
IAD 13,000 acres 4 Yes - 1 144 Long Term
DFW 17,207 acres 7 No - 5 195 Long Term
PHL 2,302 acres 4 No - 6 129 Long Term
BOS 2,384 acres 6 No - 5 103 Medium Term
Table 6: Airport Information Related to Capacity, Summary of Analysis in Appendix A
In the last five years, large airports have experienced a higher rate of increase in total enplane-
ments than smaller airports, and it is likely that increased demand will continue to cause conges-
tion and delays.
11JOHN F. KENNEDY INTERNATIONAL AIRPORT (JFK)
NEW YORK, NEW YORK
Located 20 miles to the southeast of Manhattan, in Queens, New York, John F. Kennedy
International Airport (JFK) is the nation’s largest international aviation gateway. In 2012
JFK moved 49 million total passengers and 25 million international passengers.50
It is one of the nation’s most con- movement growth has resulted from in the United States, and many pas-
gested airports, and despite the reces- scheduled passenger traffic, while sengers traveling through the airport
sion, international passenger growth cargo, commuter, and other small air- originate from, or make their final
has steadily increased since 2003, craft usage has declined dramatically. destination, the NYC area. However,
overtaking the amount of domestic Traffic peaked at the airport in 2007 JFK also serves as a hub for connect-
traffic in 2012, shown in Figure 5. Six at more than 440,000 movements per ing flights for domestic and interna-
out of the ten most heavily traveled year and has since declined slightly to tional travelers. In a 2012 passenger
routes in the country go through JFK about 409,000 movements per year in survey, 18.4 percent of all departing
airport, and according to the FAA, a 2011.54 The maintained traffic levels passengers at JFK connected through
third of the nation’s air traffic passes after 2007 reflect increased load fac- the airport, with 8.4 percent connect-
through the New York City region’s tors on aircraft. ing from a domestic flight, and 10.1
airspace, which includes nearby New- percent connecting from an interna-
ark Liberty International (EWR) and JFK is a major hub for three domes- tional flight.57 These values are much
LaGuardia International (LGA) air- tic airlines: JetBlue (38.5 percent of lower than other large hub airports,
ports.51 JFK’s flights in 2012), Delta (28.8 such as Atlanta that is dominated by a
percent), and American (16.5 per- single airline and where nearly 70 per-
JFK has also experienced an increase cent).55 Sixty-five international car- cent of passengers are connecting to
in the number of overall aircraft riers additionally serve JFK.56 New another flight, but the value suggests
movements since 1998.53 Aircraft York City is the largest urban area that around nine million annual pas-
John F. Kennedy International Airport
12sengers flying through JFK continue Airside capacity constraints are main- that additional runway capacity at
on to other destinations, making de- ly due to the airport’s intersecting JFK will be required to meet demand
lays at JFK ripple across the aviation four-runway design. JFK can operate through 2015 and beyond.65
network. a maximum of 81 flights/hour per
FAA slot-control regulations, mak- In addition to airside capacity con-
Current Capacity ing it one of the FAA’s few slot-con- straints, airspace capacity issues also
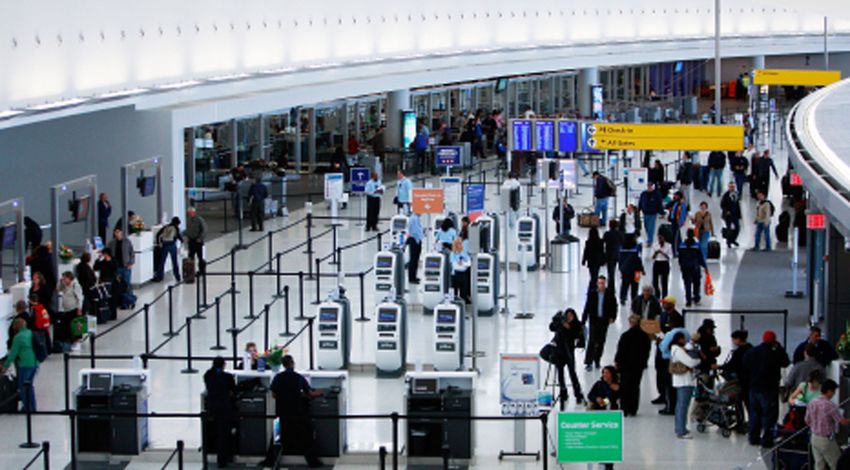
JFK has eight terminals and 117 trolled airports in the United States. create delays. Because JFK operates
gates to serve its passengers. Since Departure “slots” are allocated for closely with two other large airports
2012, the airport has added a new in- JFK by the FAA for specific days of (EWR and LGA) within a very small
ternational terminal, JetBlue’s Termi- the week and must be used at least 80 geographic area, overlapping airspace
nal 5, and improved Delta’s Terminal percent of the time for that day dur- creates a “tremendous air traffic man-
4. As a result, landside capacity has ing a scheduling season.61 Though agement challenge.”66 As a result of
improved.58 JFK still has a dated, and FAA slot-control regulations allow the overlapping airspace, in certain
relatively inefficient, terminal and ac- JFK 81 flights/hour, demand fre- wind conditions JFK must stagger
cess design, but the airport is mak- quently reaches 90-100 flights/hour and restrict operations to separate
ing some investments to improve the during several peak hours through- arrivals and departures from EWR
condition. JetBlue’s domestic airline out the day, shown in Figure 6.62 By and LGA, giving less flexibility to an
operations are based out of JFK 2030, demand is expected exceed ca- already-constrained network.
and the air carrier recently opened a pacity for most of the day.
new terminal that includes additional Many of the challenges of over-
gates and new international arrival By 2030, demand for the three largest lapping airspace can be addressed
facilities.59 Delta has also made in- New York region airports is expected through the use of technologies that
vestments into their presence at JFK, to increase by 50 million passengers. will modernize the air traffic control
completing a $1.4 billion Terminal 4, A report by the RPA predicts “seri- system and “disentangle the airspace
adding nine new gates, and streamlin- ous capacity deficiencies [at JFK] conflicts among the [NYC] region’s
ing passenger areas.60 Along with im- will become even more apparent in airports.”67 In the U.S., these tech-
proving the condition of the termi- the next 10 years,” with demand pre- nologies are embodied in NextGen,
nals, the airlines that are investing will dicted to rise to 110-130 flights/hour the program overseen by FAA that
likely want to increase their traffic to throughout the day.64 Based on cur- promises to “transform air traffic
make the investment worthwhile. rent delays at JFK, the FAA predicts control from current ground-based
Passengers at John F. Kennedy International Airport (JFK)
60,000,000
50,000,000
40,000,000
30,000,000 Domestic
20,000,000 International
10,000,000 Total
0
1998 1999 2000 2001 2002 2003 2004 2005 2006 2007 2008 2009 2010 2011 2012
Year
Figure 5: Passengers at John F. Kennedy International Airport (JFK)52
13John F. Kennedy International Airport: Flights Per Hour
140
120
100
80 Current Demand
60 2030
40 Current Limit
20
0
0 2 4 6 8 10 12 14 16 18 20 22 24
Figure 6: John F. Kennedy International Airport - Flights Per Hour63
technologies such as radar to satellite-require filling in a large section of be international travelers, meaning
based technologies such as GPS and Jamaica Bay or obtaining additional that the U.S. economy will lose out
digital communications.” 68 NextGen land outside the current airport land on over $3.7 billion in annual spend-
technologies would modernize U.S. to build and extend existing runways. ing by overseas travelers by 2016, in-
Air Traffic Control (ATC) and en- The fourth option proposes to re- creasing to over $13 billion by 2024
able aircraft to fly closer within the configure runways, but would affect and over $25 billion by 2034. Unmet
airspace, likely expanding capacity air traffic and noise over parts of domestic travel demand has a less
and realigning departure and arrival Queens. In line with the RPA’s rec- significant spending impact, but this
airspace routes. NextGen is many ommendations, the Port Authority still accounts for over $2.5 billion in
years away from implementation, and has also cited the expansion of op- annual spending by 2024. Forecasted
is not expected to solve all of the re- erational capacity as “the best long- out to 2034, when unmet demand
gion’s capacity problems alone. term approach to congestion man- for domestic and international travel
agement“ at JFK.70 Land acquisition reaches over 20 million annual pas-
Future Capacity from the Bay or the neighborhoods sengers at JFK, the lost economic
Congestion problems at JFK are not will be very challenging, and the re- opportunity is approximately $30 bil-
new and are expected to worsen over port does not cite a recommendation lion annually to the U.S. economy, ac-
the coming decades. To address the for funding the expansion. Even if counting for over 160,000 jobs.72
aircraft and passenger demand pre- the runways are expanded, the air-
dictions, the New York-New Jersey space conflicts with the other airports The potential expansion of JFK has
Port Authority and the RPA have might still pose problems to capacity, received strong criticism from envi-
examined several alternatives to ex- especially in inclement weather. ronmental groups, New York law-
panding both JFK’s passenger and makers, local citizens, and will likely
runway capacity. Though the Port Failure to address capacity issues has require comprehensive study and
Authority recently improved one of direct consequences because the air- public support to proceed.73 To date,
JFK’s busiest runways with a $376.3 ports cannot handle traffic beyond none of the runway construction
million widening and taxiway up- current levels. These consequences projects have moved forward, with
grade, the airport will need additional include a loss of 3.1 million annual the largest barriers being environ-
capacity to handle demand.69 passengers by 2016 and over 10 mil- mental and political.74 Meanwhile the
lion annual passengers by 2024 cal- need for additional capacity to meet
The 2011 RPA proposed four op- culated using projections provided demand at JFK is immediate, press-
tions to increase runway capacity at by the Port Authority and the RPA.71 ing, and has national implications.
JFK airport. Three of these options Of these over 50 percent are would-
14CASE STUDY 2: NEWARK LIBERTY INTERNATIONAL AIRPORT (EWR)
NEWARK, NEW JERSEY
As the oldest airport in the New York metropolitan area, Newark Liberty International
Airport (EWR) is located 16 miles southwest of Manhattan, and moved close to 34 mil-
lion passengers in 2012, shown in Figure 7.75
As an international hub, EWR sends increased presence of United Air- experience for passengers.80 Other
a significant amount of passengers to lines’ hub flying an increased number airlines that operate out of EWR in-
the rest of the country: in 2012 nearly of regional jets for its longer distance clude Delta (6.1 percent of flights),
half of all departing passengers were service. JetBlue (5.6 percent), and US Airways
connecting from a domestic or inter- (5.4 percent).81
national flight.76 Much like
JFK, EWR has experienced Current Capacity
consistent congestion-relat- EWR operates three termi-
ed problems as it increases nals and 61 gates to handle
its load as a major hub and a passengers and aircraft. Cur-
large international gateway rent plans to expand United’s
airport. terminal are underway. How-
ever like at JFK, the majority
The number of aircraft of the problems facing EWR
movements at EWR has are airside. EWR currently
been slowly declining for operates three runways – two
the last decade from a parallel and a third intersect-
peak of 455,000 in 1998 to Airplanes taking off at Newark Liberty International Airport ing. Using these three run-
410,000 in 2011, tracking ways, EWR is able to provide
closely with the passenger United Airlines commands the larg- for 81 operations/hour per
levels seen in Figure 7. Unlike at est portion of EWR’s flight opera-
78
FAA slot-control regulations. Similar
JFK, where growth in aircraft move- tions (64.8 percent of EWR flights in to JFK, EWR slots are allocated for
ments is due to scheduled passenger 2012). United will likely remain one specific days and time periods, and
service, EWR has lost scheduled pas- of the largest air carriers at EWR in airlines allocated slots must use these
senger service flights, while commut- years to come, suggested by plans slots at least 80 percent of the time.83
er flights have been steadily increas- to invest $150 million into their ter- A 2011 study by the RPA shows that
ing.79 This is likely the result of the minal to create a more streamlined demand at EWR is at or exceeding
Passengers at Newark Liberty International Airport (EWR)
40,000,000
35,000,000
30,000,000
25,000,000 Domestic
20,000,000
International
15,000,000
10,000,000
Total
5,000,000
0
1998 1999 2000 2001 2002 2003 2004 2005 2006 2007 2008 2009 2010 2011 2012
Figure 7: Passengers at Newark Liberty International Airport83
15the capacity for a significant portion but also to travelers that connect to Also like JFK, EWR is at its capacity
of the day, shown in Figure 8. Like and from EWR as a hub.85 The RPA limit, and failure to address capacity
JFK, by 2030 the demand will be sig- predicts that delays will continue to constraints will result in lost passen-
nificantly greater than the current ca- deteriorate unless capacity improve- gers for the New York region and
pacity for most of the day. ments are made, as the demand for the rest of the country due to unmet
travel at EWR is predicted to grow demand. For EWR this means losing
EWR has faced significant challenges substantially over the next 20 years. out on 1 million additional annual
operating flights in the constricted passengers by 2016 and over 5 mil-
NYC airspace. EWR has the stron- Future Capacity lion annual passengers by 2024, using
gest airspace conflicts with Teterboro Natural and manmade barriers to projections provided by the Port Au-
Airport (TEB, a busy airport for cor- EWR, including the New Jersey thority and the RPA.87
porate and private aircraft) and LGA. Turnpike, have challenged the future
NextGen is expected to help with the growth of both airside and landside The economic case for expanding
conflicts, improve safety, and increase capacity at EWR. The RPA addressed EWR is as compelling as it is for JFK,
capacity, but will not be enough to specific strategies for capacity expan- with $1 billion, $4 billion, and over
completely resolve the demand con- sion at EWR in a 2011 report, recom- $8 billion in lost economic spending
straints facing EWR. mending the construction of a third for 2016, 2024, and 2034 respectively,
parallel, longer runway at EWR.86 primarily from would-be internation-
Delays at EWR have been cited as the However, this would require the de- al passengers coming to the U.S. This
worst in the country, resulting in the molition of Terminal B and parts of translates to over 9,000 jobs in 2016
“least-loved” (according to CNN) Terminals A and C. Though the pos- and over 58,000 jobs in 2034 just by
airport award and the worst on-time sibility of constructing a new, major unmet demand at EWR.88
departure rate of any of the top 29 airport outside of the NYC region to
U.S. airports tracked by USDOT.84 handle the region’s air travel demand Though multiple proposals have
In 2012, almost 30 percent of flights has been considered, RPA concludes been put forward for additional ca-
at EWR had delays of 15 minutes or that no new construction within 40 pacity at EWR to address demand
more, and only 69 percent of flights miles would be as economically effi- and congestion issues, no expansion
arrived on schedule, resulting in de- cient as expanding the region’s three plans are being considered and fund-
lays not only to travelers using EWR, existing airports incrementally. ing sources have not been identified.
140
Newark Liberty International Airport: Flights Per Hour
120
Flights per Hour (Demand)
100
80 Current Demand
60 2030
40 Current Limit
20
0
0 2 4 6 8 10 12 14 16 18 20 22 24
Hour of Day
Figure 8: Newark Liberty International Airport - Flights per Hour82
16CASE STUDY 3: LOS ANGELES INTERNATIONAL AIRPORT (LAX)
LOS ANGELES, CALIFORNIA
Los Angeles International Airport (LAX) is the largest hub for passengers on the west
coast of the United States. The airport is located 16 miles to the west of downtown Los
Angeles, and it handled 62.6 million passengers in 2012, including more than 16 million
international passengers.89
LAX has experienced relatively stable As a large hub, LAX serves a sig- that LAX is becoming increasingly
passenger levels through the reces- nificant proportion of connecting focused on longer distance flights, a
sion in 2008, shown in Figure 9, and passengers. In 2011, 38 percent of trend that coincides with a national
has experienced growth in domestic LAX passengers were connecting.93 trend among large airports towards
and international pas- longer distance flights.
senger levels each year LAX is not dominated
since then Although by a single primary air
the number of over- carrier like many other
all passengers at LAX large commercial service
has been increasing hub airports in the Unit-
for the past four years, ed States. The largest
the number of aircraft carriers of aircraft oper-
movements at LAX ations at LAX are Unit-
has declined for the ed Airlines (18.7 percent
past decade.91 Traffic of passengers in 2012),
peaked at the airport in American Airlines (18.5
2000, with over 780,000 percent), Southwest Air-
aircraft movements that lines (15.9 percent), and
year.92 After declin- Los Angeles International Airport
SkyWest (9.8 percent).95
ing to under 550,000 in Though the share of air
2009, aircraft traffic has carriers at LAX has re-
rebounded significantly, with over Twenty-two percent of connecting mained relatively equal, changes ap-
605,000 movements in 2012. Pas- passengers who began their trip in pear to be on the horizon.
senger volumes remain high due to California in 2006 were destined to
increased plane sizes and load factors other California cities, down from In March 2013, Delta announced
on aircraft. 36 percent in 2001.94 This suggests plans to expand their presence and
Passengers at Los Angeles International Airport (LAX)
70,000,000
60,000,000
50,000,000
Domestic
40,000,000
30,000,000 International
20,000,000 Total
10,000,000
0
2002 2003 2004 2005 2006 2007 2008 2009 2010 2011 2012
Figure 9: Passengers at Los Angeles International Airport (LAX)90
17offer new routes at LAX, followed by to terminal condition and airport ac- been targeting funds towards im-
American’s similar announcement to cess. While some terminals are con- proving the traffic congestion prob-
expand at LAX in April.96 In addi- nected via walkway or airside shuttle, lems.103 Under current growth rates,
tion to existing competition over air- to transfer between some terminals a LAWA expects the airport to reach
line presence at the airport, the fate passenger must exit the terminal, ride its maximum capacity around 2022.104
of the American/US Airways merger a shuttle bus, and re-clear security. The gate cap will likely expire by that
could also affect American’s share at Getting to rental car facilities, which time, but the airport will need to im-
LAX. are off-airport, is slow and unpredict- plement its current plans to improve
able. Access to the airport is primari- the ground access problems. Accord-
Current Capacity ly achieved by using I-405, one of the ing to LAWA projections, passenger
LAX is not under slot-controlled reg- most congested stretches of highway demand beyond the capacity thresh-
ulations by the FAA and instead em- in the nation.99 old will continue to grow at more
ploys a traditional “first-come, first than two million passengers per year.
serve” procedure for individual air- Transit access to LAX terminals is After 2022, the airport and the region
craft and airlines to access gates and limited to regional and local bus ser- could be losing millions on potential
terminals. From an airside capacity vices and shuttle buses (on congested passengers annually, which would
standpoint the airport works well as airport access roads) to the “Avia- have a direct impact on the economy
a hub, allowing flexibility for airline tion” light rail station 2.5 miles away. in the region and the national econ-
carriers who wish to schedule flights This results in transit access to the omy.
in clusters during the day as opposed airport accounting for only 1 percent
to evenly scheduling them through- of air passengers.100 In general pas- Future Capacity
out the day and week. Four parallel sengers traveling through LAX are In response to projected demand,
runways serve aircraft at LAX, with often confronted with undesirable LAWA is in the midst of a $4.8 bil-
two located on either side of the conditions, leading LAX to consis- lion capital improvement program
main terminals in a modern, efficient tently be rated as one of the worst to improve capacity and efficiency at
layout. LAX’s current runway has the airports in the country.101 LAX. The majority of the program’s
potential to move up to 160 aircraft funding is dedicated to terminal im-
operations/hour.97 The FAA FACT Ground access to the airport at LAX provements, including the recently-
two identified LAX needing of addi- is the most significant chokehold in completed reconstruction of the
tional airport capacity by 2025, sug- the airport’s system, and according to Tom Bradley International Terminal,
gesting a runway capacity problem in Los Angeles World Airports (LAWA) but other initiatives are focusing on
the future but not immediately. airport access infrastructure was pro- improving ground access infrastruc-
jected to hit complete gridlock at ture to the airport to improve the air-
The primary capacity constraints at 78.9 million annual passengers with- port’s overall capacity.105
LAX have to do with landside capaci- out improvements to the system.102
ty and airport access. The present ter- While 78.9 million annual passengers The program also includes airside
minal and ground access infrastruc- is a precise number, it is accurate improvements, including the reloca-
ture at LAX was constructed in 1961, enough to mean that adding about 15 tion of the northern-most runway
with three additional terminals added million annual passengers above the and the construction of an additional
to the complex in the 1980s, bringing 62.6 million in 2012 will be too much lane for larger jet aircraft. However,
the total to nine.98 LAX has updated for the access and gate infrastructure not all terminals are addressed in this
some of its terminals, including the to handle. improvement program, and the fun-
Tom Bradley International Termi- damental problems that plague LAX,
nal, and is adding capacity to handle In an attempt to mitigate the traffic including inefficient design, ground
the largest aircraft in service at oth- issues, LAX is legally restricted to transportation access, and terminal
er terminals. Though investment in 153 gates to ensure that the airport crowding will likely continue to pose
updating some of the terminals has does not surpass its 78.9 million an- challenges to the airport in the future
helped the passenger experience, the nual passenger threshold. Since the without greater overall investment.
airport is problematic when it comes implementation of the law, LAX has
18You can also read