Acoustic discrimination in the grey bamboo shark Chiloscyllium griseum - Nature
←
→
Page content transcription
If your browser does not render page correctly, please read the page content below

www.nature.com/scientificreports
OPEN Acoustic discrimination in the grey
bamboo shark Chiloscyllium
griseum
Tamar Poppelier1, Jana Bonsberger1, Boris Woody Berkhout2, Reneé Pollmanns1 &
Vera Schluessel1*
Cognitive abilities of sharks are well developed and comparable to teleosts and other vertebrates.
Most studies exploring elasmobranch cognitive abilities have used visual stimuli, assessing a wide
range of discrimination tasks, memory retention and spatial learning abilities. Some studies using
acoustic stimuli in a cognitive context have been conducted, but a basic understanding of sound
induced behavioural changes and the underlying mechanisms involved are still lacking. This study
explored the acoustic discrimination abilities of seven juvenile grey bamboo sharks (Chiloscyllium
griseum) using a Go/No-Go method, which so far had never been tested in sharks before. After this, the
smallest frequency difference leading to a change in behaviour in the sharks was studied using a series
of transfer tests. Our results show that grey bamboo sharks can learn a Go/No-Go task using both
visual and acoustic stimuli. Transfer tests elucidated that, when both stimulus types were presented,
both were used. Within the tested range of 90–210 Hz, a frequency difference of 20–30 Hz is sufficient
to discriminate the two sounds, which is comparable to results previously collected for sharks and
teleosts. Currently, there is still a substantial lack of knowledge concerning the acoustic abilities and
sound induced behaviours of sharks while anthropogenic noise is constantly on the rise. New insights
into shark sound recognition, detection and use are therefore of the utmost importance and will aid in
management and conservation efforts of sharks.
Sharks have a wide range of cognitive abilities, which are comparable to teleosts and other v ertebrates1. Exam-
ples of cognitive abilities are recognition, discrimination and social learning functions. These abilities likely aid
sharks in predator avoidance, social interactions, foraging and/or habitat selection2. Learning is most simply
defined as a change in behaviour as a result of e xperience3. It is an important mechanism of adaptation to envi-
ronmental unpredictability3 and can increase an individual’s chances of maximizing its fi tness4. One of the first
studies looking at the ability of sharks to learn involved an operant conditioning r egime5. In this study, sharks
were successfully trained to acquire food by pressing a submerged bell, clearly showing that sharks are able to
perform a simple cognitive task. Since then, a range of different studies have followed, mostly focusing on visual
discrimination abilities (for reviews see1,2,6). For example, grey bamboo sharks Chiloscyllium griseum can visu-
ally discriminate a wide range of stationary and moving two-dimensional objects, recognize symmetry, perceive
subjective and illusory contours and even form mental c ategories7–13. Furthermore, memory retention and spa-
tial learning abilities were found in both grey bamboo sharks, freshwater stingrays Potamotrygon motoro, Port
Jackson sharks Heterodontus portusjacksoni and coral cat sharks Atelomycterus marmoratus12,14–18. Small spotted
catsharks Scyliorhinus canicula can perform a foraging task using electroreceptive stimuli19, indicating that not
only visual stimuli can be used researching cognitive abilities. Several studies showed that sharks are able to be
conditioned to an acoustic stimulus. However, cognitive abilities of sharks using acoustic stimuli have barely
been researched in depth20,21, and consequently, a basic understanding of sound induced behavioural changes
and the underlying mechanisms involved in this process is still lacking.
Underwater sound can be a highly informative cue. It travels further than light and faster than olfactory cues.
It is also highly directional, further increasing the information contained in the cue22,23. It can be categorized
into two different components: sound pressure and particle motion. Sound pressure is described as a deviation
of the ambient pressure caused by a sound wave, and particle motion results from the oscillatory displacement
of particles within a propagating sound wave24. The source of underwater sound in marine environments (from
1
Department of Comparative Sensory Biology and Neurobiology, Institute of Zoology, University of Bonn,
Meckenheimer Allee 169, 53115 Bonn, Germany. 2FNWI, University of Amsterdam, Science Park 904, 1098
XH Amsterdam, The Netherlands. *email: v.schluessel@uni-bonn.de
Scientific Reports | (2022) 12:6520 | https://doi.org/10.1038/s41598-022-10257-1 1
Vol.:(0123456789)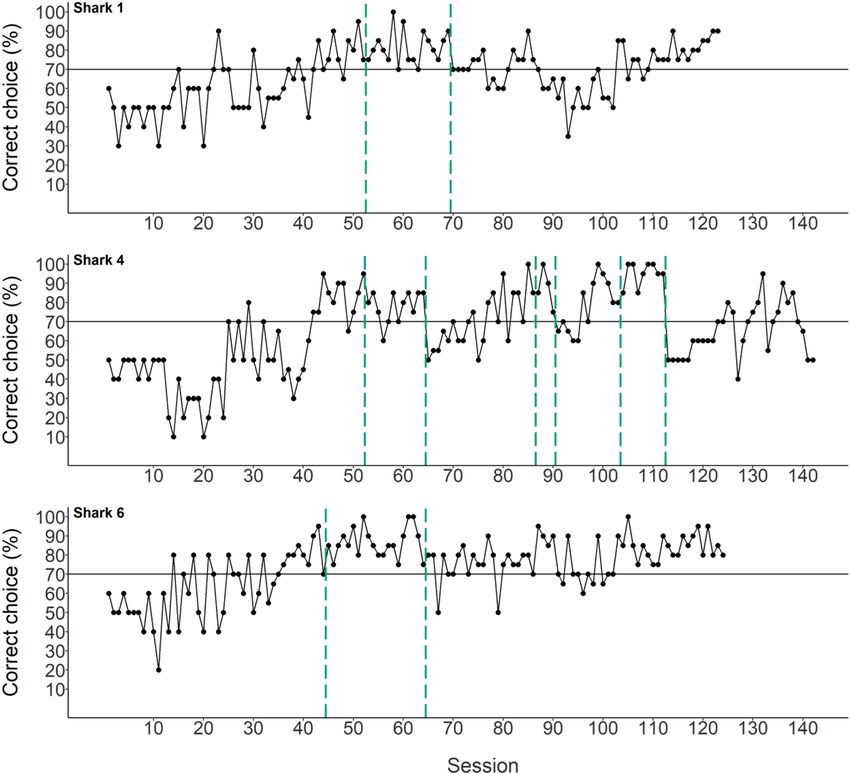
www.nature.com/scientificreports/
here on ‘sound’) can either be natural or anthropogenic. Abiotic natural sound is mostly generated by wind,
waves, and tectonic processes. Biotic natural sound is generated by a variety of marine organisms, such as snap-
ping shrimp, sperm whales communicating through echolocation or a male red grouper courting a f emale25–27.
Anthropogenic sound is any sound produced by human activity, such as container shipping, drilling or military
sonar, and is often classified as either acute (high intensity, short duration, and often pulsed) or chronic (long
term and low intensity)28. Anthropogenic sound often differs from natural sound in acoustic characteristics
such as sound pressure level, impulsiveness and repetition r ate28. Regardless of its nature, sound influences the
life and behaviour of marine organisms and its effects likely vary with acoustic characteristics of sound (source,
duration, level, spectrum, etc.) and acoustic sensitivity of the receiving animals.
In bony fishes, sound plays and important r ole29–31. For many species, sound is implicated in social interac-
tions such as reproductive or territorial behaviour and has even been suggested to aid in social aggregation (e.g.
shoaling)32–34. Moreover, natural sound is used for n avigation29,31 and locating predators or prey35,36. To be able
to determine the type (e.g., predator or prey) or location of a sound source, a fish must successfully discriminate
and identify different sounds. This ability has been shown for example in goldfish Carassius auratus37,38, larval reef
fish29,39 and sound producing electric fish Pollimyrus adspersus40. Bony fishes can typically detect low frequencies
up to 3 kHz, but many species are most responsive to sounds below 1 kHz41. Sharks are most sensitive to low
frequency sounds between 20 Hz and 1 kHz42. They do not seem to produce sound, but like most bony fishes,
sharks can detect the (directional) particle motion component of s ound36,42. A small opening on each side of the
head directly leads into the inner ear, where particle motion induces bending of the cilia of sensory hair cells in
the ear. This in turn generates a physiological response resulting in the detection of sound42,43. A second system
contributing to the detection of sound is the lateral line system. The lateral line in elasmobranchs can detect low
frequency sounds between 1 and 200 Hz and has the greatest sensitivity between 20 and 30 Hz44,45. This system is
also stimulated by back-and-forth movement of cilia, and is considered a short-distance sensory system (one to
two body lengths)43,46,47. Sharks are generally considered not to be able to detect the sound pressure component
due to their lack of a pressure-to-displacement transducer like a swim bladder or other air-filled c avity36. How-
ever, two studies showed that species without an apparent pressure-to-displacement transducer (triplefin larvae
(family: Tripterygiidae) and grey bamboo sharks) can detect both particle motion and sound pressure29,48. This
suggests that an additional sensory mechanism might be involved in detecting sound pressure in some species.
A potential candidate for the detection of sound pressure in sharks is the lateral line system, but such a function
has yet to be experimentally demonstrated.
Although a proper understanding of the use of sound in sharks is lacking, published accounts of sharks
detecting and being attracted to sound are available20,36,48–53. Additionally, previous research on acoustic cogni-
tive abilities showed that lemon sharks Negaprion brevirostris successfully discriminated between frequencies
(160 vs. 40 Hz, 80 vs. 40 Hz and 70 vs. 40 Hz) in an approach-avoiding experiment, with the smallest detectable
difference in this experiment being 20 Hz (60 vs. 40 Hz)20. In addition, a recent paper showed that Port Jackson
sharks H. portusjacksoni were able to learn an association task using an acoustic s timulus21. However, a substantial
knowledge gap on the acoustic abilities of sharks and their ability to discriminate frequencies remains.
Go/No-Go testing (e.g. an animal touching a lever when a circle is presented, but not touching the lever when
a square is presented) is often used as a component of behavioural examination in order to assess inhibitory
control54. Previously, Go/No-Go tasks have been successfully used as a measure of learning in bony fishes55,56
and of judgement bias, impulsiveness and behavioural inhibition in m ammals57–61.
In the present study it was tested whether grey bamboo sharks can perform a Go/No-Go task based on sound
and whether they can discriminate between two frequencies. This was accomplished by training sharks to associ-
ate one tone with action A and another tone with action B. After successful training it was tested whether sharks
associated frequencies between 90 and 210 Hz with behaviour A or B.
Method
Subjects. Sixteen naïve juvenile grey bamboo sharks (C. griseum, eight females and eight males ranging
between 63–75 cm (Group 1; experiments in 2018–2019) and 39–45 cm [Group 2; experiments in 2020–2021)
total length (TL)] were obtained from Haus des Meeres (Vienna) where they were bred in captivity. The sharks
were housed in separate aquarium systems (L × W × H: tank 1 and 2: 1.6 × 0.5 × 0.5 m; tank 3: 1.8 × 0.5 × 0.5 m;
tank 4: 1.8 × 0.9 × 0.6 m; tank 5 and 6: 1 × 1.75 × 0.5 m) with either two or three sharks per tank. All aquaria were
filled with filtered saltwater [conductance: about 50mS (ca. 10,217 kg/dm3)] at ± 25 °C. The systems were aerated
with air stones and the animals were kept on a 12 h day:12 h night cycle. Regular water testing was done to ensure
constant environmental conditions (salinity, temperature, NO2, KH and pH). Environmental conditions were
close to identical throughout the different aquarium systems. The experimental tank was connected to the main
aquarium system to ensure stable environmental conditions. Individuals were identified by phenotypic charac-
teristics (e.g., colour, sex and size). Sharks were fed exclusively during experimental sessions. Food consisted of
shrimps, mussels, fish and squid. Once a week, vitamin supplements (JBL Atvitol) were added to the feed.
Experimental set‑up. Experiments were carried out in an octagonal tank of 2.1 × 2.1 × 0.35 m (Fig. 1)
which was connected to the main aquarium system. A white tarp was placed around the area of the experimen-
tal tank to minimise visual distractions during the experiments. In the beginning of each experimental session,
the shark was placed in a black, circular starting compartment (SC) until training commenced (Fig. 1). The SC
was opened and closed by a light grey guillotine door which was operated by a manual pulley system. The open-
ing was located on the floor since bamboo sharks are a benthic species. The loudspeaker was placed opposite of
the SC guillotine door. An underwater loudspeaker was not available. Therefore, a loudspeaker (Visaton TIW
200XS) was raised above the water surface by a handmade waterproof white casing and connected to a Harman
Scientific Reports | (2022) 12:6520 | https://doi.org/10.1038/s41598-022-10257-1 2
Vol:.(1234567890)
www.nature.com/scientificreports/

                                 Figure 1.  Schematic overview of experimental set-up for ‘Go/No-Go’ experiments (not to scale). (A) ’No-Go’-
                                 trial (visual stimulus absent). (B) ‘Go’-trial (visual stimuli present for Group 2). (C) Side view of experimental
                                 setting. Note that the water pump was taken out for this picture. (D) Loudspeaker built into waterproof casing
                                 with a black circle on the outside.

                                 Kardon HK 6200 amplifier. The bottom of the waterproof casing rested on a blue filtration mat to minimise
                                 acoustic vibrations being transferred to the tank floor. A black circle (ø 18 cm) was stuck on the front of the
                                 waterproof casing which was submerged (Fig. 1). The experimental sounds (Group 1: 140 and 200 Hz; Group 2:
                                 90 and 210 Hz) were selected based on previous research and experiments in this lab. To minimise the chances
                                 of giving unintentional cues, a webcam (Logitech HD Pro Webcam C920) was installed above the experimental
                                 tank to observe the shark during the experiment without looking at it directly. All sessions were recorded with
                                 this webcam.

                                 Acoustic measurements. Ambient sound (day to day sounds originating from water in- and outflow,
                                 aeration pumps, protein skimmers, etc.) and sound pressure levels (SPL) of the used experimental frequencies
                                 (90 and 210 Hz) in the experimental tank were measured using an omnidirectional hydrophone (Aquarian
                                 Audio H2a with inbuilt preamplifier, manufacturer-calibrated sensitivity − 180 dB re 1 V/mPa; frequency range
                                 0.01–100 kHz) and the software program Audacity (v.2.4.2;62). Calibration of the hydrophone was achieved
                                 following the freely available online calibration protocol from Aquarian Hydrophones. A function generator
                                 (Voltcraft FG-506) and an oscilloscope (Yokogawa DL1300A) were used as signal generator and output measur-
                                 ing device, respectively. Sound pressure level of each sound (ambient sound, 90 Hz and 210 Hz) was measured
                                 three times for 5 s on 151 unique locations in the experimental tank (along a 15 cm grid). Heatmaps of each
                                 sound were made using the average of each sound per location (Fig. 2). For the heatmap of ambient sound, SPL
                                 represents the loudest frequency present (40 Hz). Spectrograms of ambient sound, 90 Hz and 210 Hz tones can
                                 be found in the Supplementary Information (SI 2). All other tones used during transfer tests (100–200 Hz) were
                                 measured at one location in the experimental tank.

                                 Experimental procedure. The commonly used method for testing discriminatory abilities in sharks is a
                                 two-alternative forced choice test. However, to test acoustic discrimination abilities, the experimental design of a
                                 two-alternative forced choice task would have required two loudspeakers playing a sound at the same time. Due
                                 to the small size of the experimental tank, emitted sound waves would have reflected and interfered with correct
                                 sound localization. Secondly, sharks often exhibit side preferences (pers. comm. Vera Schluessel). Therefore,

Scientific Reports |   (2022) 12:6520 |               https://doi.org/10.1038/s41598-022-10257-1                                                      3

                                                                                                                                              Vol.:(0123456789)
www.nature.com/scientificreports/

                                           Figure 2.  Sound pressure levels (SPL; dB re 1 µPa) in the experimental tank. Measurements were made along
                                           a 15 cm grid, with distance from tank walls being 13 cm. Grey tiles indicate that no measurement was made
                                           at that grid point due to the loudspeaker (h12, i11 and i12) and SC (g1, j1 and j2) blocking that position. Grid
                                           point ‘i7’ is marked with an ‘x’.

                                           a Go/No-Go task, a method never before tested in sharks, was preferred over a two-alternative forced choice
                                           experiment.

                                           Acclimatization and pre‑training. Before (pre-)training commenced, sharks were familiarized with the experi-
                                           mental tank. In the first step, individual sharks were transferred to the experimental tank for roughly 10 min and
                                           allowed to rest or swim freely during this time. It also permitted sharks getting used to being handled and getting
                                           fed with black, plastic forceps. This period ended after four days when sharks moved and fed without hesitation.
                                           In a second step, the starting compartment, guillotine door and loudspeaker were added to the experimental
                                           tank to get the sharks used to the experimental setup. Sharks that did not swim or eat in the experimental tank
                                           did not progress to pre-training.

                                           Training. The two groups of individuals (total of N = 16) were each trained in a different procedure and by a
                                           different trainer in two separate years. Group 1 consisted of seven animals out of which four individuals success-
                                           fully learned. Group 2 consisted of nine animals out of which three individuals successfully learned.

                                           Group 1. After acclimatizing the sharks, individuals were pre-trained to touch the loudspeaker in case of a
                                           200 Hz tone (‘Go’ trial). There were 10 consecutive trials per day, which formed a session. Sessions were run daily
                                           for six days per week. An animal was considered to have learned the task in this step when reaching learning cri-
                                           terion (LC). LC for this step was established at a minimum of 90% correct choice for three consecutive sessions.
                                               In a second step, individuals were then taught not to touch the loudspeaker when no tone was played (‘No-
                                           Go’), but still touch it when a 200 Hz tone was played. In this step, so called super sessions (SS) were performed,
                                           which consisted of 45–120 trials. The trial number was open towards the end, i.e. the animal continued to par-
                                           ticipate in the session until it was completed. Individuals were required to make consecutive correct choice(s)
                                           during sets of played frequencies. Super sessions were performed at a maximum of three days apart, and no
                                           experimental sessions were performed on the days in between. Once completed successfully, sharks progressed
                                           to a third experimental step.
                                               In this third step, the Go/No-Go discrimination task was tested using the same 200 Hz tone to indicate a
                                           ‘Go’-trial and a 140 Hz tone (instead of no tone) for a ‘No-Go’-trial. Again, so called super sessions (SS) were
                                           performed, which consisted of 40–80 trials with trial number open towards the end. Individuals were required to
                                           make consecutive correct choice(s) during sets of played frequencies (see Figs. 3 and 4 for the structure of these
                                           tests). Again, super sessions were performed at a maximum of three days apart, and no experimental sessions
                                           were performed on the days in between.
                                               In all three experimental steps, each trial started by playing a tone, opening the guillotine door, and starting
                                           the timer at the same time. For a ‘Go’-trial (200 Hz), a choice was considered to be correct when an individual
                                           touched the black circle on the loudspeaker with its snout within 10 s of leaving the SC (action A). When a cor-
                                           rect choice was made, food was provided at the black circle. A choice was considered to be incorrect when an
                                           individual did not touch the black circle within 10 s of leaving the SC. For a ‘No-Go’-trial (no tone or 140 Hz),
                                           a choice was considered to be correct when an individual swam out but did not touch the loudspeaker within
                                           15 s (action B). In step 2, ‘No-Go’-trials were unrewarded regardless of the action performed. In step 3, ‘No-Go’-
                                           trials were rewarded. In case of a correct choice, food was provided at the respective location of the shark at that
                                           time. A choice was considered to be incorrect when an individual touched the black circle on the loudspeaker.
                                               Amplitude, i.e. sound pressure level, was varied randomly throughout trials to prevent sharks from using this
                                           as the deciding cue, instead of frequency.

          Scientific Reports |   (2022) 12:6520 |               https://doi.org/10.1038/s41598-022-10257-1                                                    4

Vol:.(1234567890)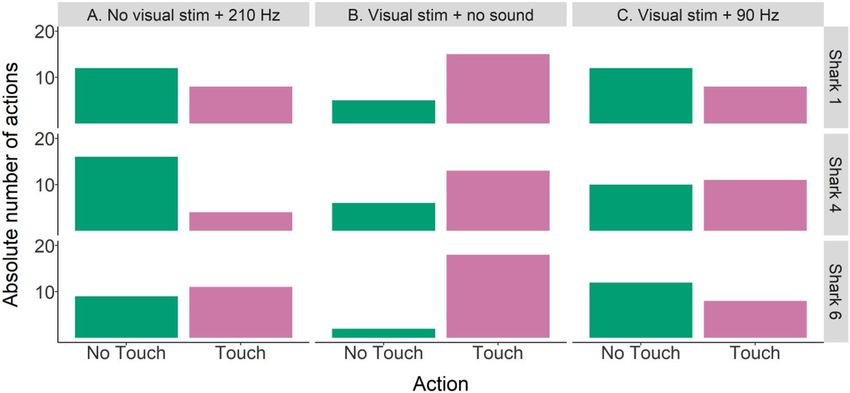
www.nature.com/scientificreports/

                                 Figure 3.  Individual supersession data for shark B. Touching the loudspeaker indicated by the time it took to
                                 touch (LST time). Not touching the loudspeaker is indicated by the shapes (at 15 s, indicating a capped trial i.e.,
                                 the loudspeaker was not touched) above the horizontal solid black line (indicating the maximum trial time for a
                                 ‘Go’-trial). Background colour indicates each separate phase (‘Go’ phase: blue, ‘No-Go’ phase: ‘orange, transfer:
                                 grey).

                                 Figure 4.  Individual supersession data for shark D. Touching the loudspeaker indicated by the time it took to
                                 touch (LST time). Not touching the loudspeaker is indicated by the shapes (at 15 s, indicating a capped trial i.e.,
                                 the loudspeaker was not touched) above the horizontal solid black line (indicating the maximum trial time for a
                                 ‘Go’-trial). Background colour indicates each separate phase (‘Go’ phase: blue, ‘No-Go’ phase: ‘orange, transfer:
                                 grey).

                                 Transfer tests. Following the successful learning of the Go/No-Go task, unfamiliar frequencies were introduced
                                 during a super session to determine the smallest difference between the used experimental frequencies that
                                 grey bamboo sharks could still discriminate between (from here on: ‘difference threshold’). For this purpose,
                                 a super session was carried out in the same manner as described above, but presenting unfamiliar frequencies
                                 (150–200 Hz, increments of 10 Hz) during the last six trials.

Scientific Reports |   (2022) 12:6520 |               https://doi.org/10.1038/s41598-022-10257-1                                                   5

                                                                                                                                              Vol.:(0123456789)
www.nature.com/scientificreports/

                                            Transfer test trial type    Visual stimulus   Acoustic stimulus
                                            A                           No                210 Hz
                                            B                           Yes               No sound
                                            C                           Yes               90 Hz

                                           Table 1.  Transfer 1 trials—utilized stimuli.

                                           Group 2. For the second group, a different approach was used to teach the discrimination task. Two types of
                                           stimuli were used to increase the likelihood of the sharks learning the Go/No-Go discrimination task: a visual
                                           and an acoustic stimulus (Part A). The visual stimulus was added early on in the experiments as sharks seemed
                                           to have difficulty understanding the task when only acoustic stimuli were presented. After acclimatization, the
                                           sharks were pre-trained for the Go/No-Go task by luring them to the correct goal location when the respective
                                           stimulus/stimuli was/were presented. After this, sessions were run once daily for six days a week.
                                               For this procedure, sessions consisted of 20 trials with equal numbers of ‘Go’ and ‘No-Go’ trials. Each trial
                                           started by playing the tone, opening the guillotine door, and starting the timer at the same time. In case of a
                                           ‘Go’-trial, a 210 Hz tone was played and a visual stimulus (two upside-down terracotta pots (ø 17 cm) placed on
                                           either side of the loudspeaker) was present. A choice was considered to be correct when an individual touched
                                           the black circle on the loudspeaker with its snout within 10 s of leaving the SC (action A). When a correct choice
                                           was made, food was provided at the black circle. A choice was considered to be incorrect when an individual did
                                           not touch the black circle within 10 s of leaving the SC. During a ‘No-Go’-trial, a 90 Hz tone was played, there
                                           was no visual stimulus. A choice was considered to be correct when an individual swam out but did not touch
                                           the loudspeaker within 10 s (action B). In case of a correct choice, food was provided at the respective location
                                           of the shark at that time. A choice was considered to be incorrect when an individual touched the black circle on
                                           the loudspeaker. At the start of the experiment the maximum trial time was longer (up to 50 s). As the success
                                           rate of the sharks improved, the maximum trial time was gradually reduced (by steps of 10 or 20 s) towards the
                                           maximum of 10 s. An animal was considered to have learned the task when reaching learning criterion (LC).
                                           LC was established at a minimum of 70% correct choice for five consecutive sessions. Amplitude, i.e. sound
                                           pressure level, was varied randomly throughout trials to prevent sharks from using this as the deciding cue,
                                           instead of frequency.
                                               After sharks learnt and completed the first set of transfer tests (Transfer 1; see below), the visual stimulus was
                                           taken out and normal training sessions resumed to determine again, whether sharks could do the Go/No-Go
                                           task with only an acoustic stimulus present (Part B). Rules for correct and incorrect choices, learning criterion
                                           and set-up (except for the visual stimulus) remained the same.

                                           Transfer tests. Transfer 1. Utilized stimuli. The first set of transfer test trials was meant to elucidate which
                                           stimulus (acoustic and/or visual) the sharks used to identify the type of trial (‘Go’ or ‘No-Go’). As choice during a
                                           transfer test trial was neither correct nor incorrect, transfer test trials were unrewarded. After sharks reached the
                                           learning criterion with both acoustic and visual stimuli present, a 90% rewarding scheme was introduced prior
                                           to running transfer tests. For the entire transfer test period, food was only provided in a maximum of 18 (out of
                                           20) correct trials, regardless of choice. Which two trials would be unrewarded was randomly determined prior
                                           to each session. The 90% rewarding scheme served to prepare the sharks for the subsequent introduction of the
                                           unrewarded transfer test trials. This way sharks learnt that a correct choice was not always associated with food
                                           and meant to keep sharks from assuming that the unrewarded transfer test trials were ‘incorrect’ and therefore
                                           not worth participating in. Transfer trials (Table 1; n = 20 per type and individual) started if performance during
                                           the 90% rewarding scheme remained at LC (minimum of 70% correct choice) for three days. Two transfer test
                                           trials were then randomly interspersed with the 20 regular trials in a session. The rewarding scheme was changed
                                           to 80% (i.e., only a maximum of 16 out of 20 regular trials was rewarded) and number of transfer test trials per
                                           session increased to four when performance in regular trials remained unchanged for seven days.

                                           Transfer 2. Difference threshold. A second set of transfer tests aimed to determine what the difference thresh-
                                           old for this group was. A preference for either touching or not touching the loudspeaker (depending on the
                                           individual) was detected during training after the visual stimulus was taken out, which could have introduced
                                           a bias to the transfer test results, had the same method been used as in Transfer 1. Therefore, using this transfer
                                           test method was deemed inefficient and a super session method (similar to the method used for group 2) was
                                           used instead.
                                               Again, sharks that reached learning criterion with only the acoustic stimulus present were introduced to an
                                           80% reward scheme (see description above for Transfer 1). If performance remained unchanged, a super session
                                           (SS) was initiated. To increase motivation, no session was conducted the day before the SS. Super sessions con-
                                           sisted of 60–80 trials, and individuals were required to make consecutive correct choice(s) during sets of played
                                           frequencies (see Fig. 9 for the structure of these tests). In case of an incorrect choice, the set was restarted until
                                           the animal reached the required amount of consecutive correct choices. In the final phase, unfamiliar frequencies
                                           (100–200 Hz, in increments of 10 Hz) were presented in a random order. Normal trials were unrewarded 80%
                                           of the time. Transfer trials with unfamiliar frequencies were also unrewarded.

          Scientific Reports |   (2022) 12:6520 |                      https://doi.org/10.1038/s41598-022-10257-1                                              6

Vol:.(1234567890)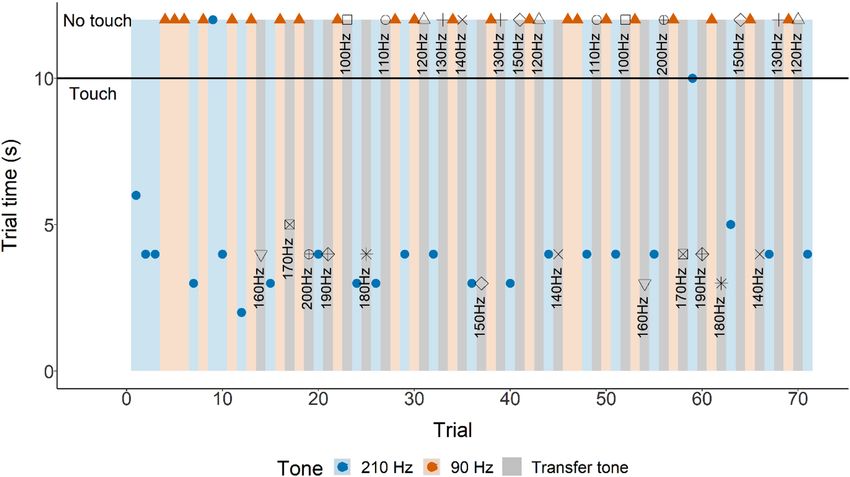
www.nature.com/scientificreports/

                                  Tone (Hz)   100      110      120      130      140      150      160      170      180      190      200
                                  Mean SPL    106.7    112.0    115.0    117.0    111.0    104.0    109.0    100.0    109.2    111.3    107.2
                                  SE SPL        0.17     0.03     0.03     0.03     0.03     0.09     0.03     0.00     0.00     0.00     0.09

                                 Table 2.  SPL (in dB re 1 µPa) of Transfer 2 tones at grid point ’i7’ in the experimental tank.

                                 Data analysis. For training sessions, total trial time, loudspeaker touch time (LST), and whether the choice
                                 was correct or incorrect was noted after each trial. Total trial time here is defined as the time from when the
                                 trial started by opening the SC until 10 s after leaving the SC. LST is defined as the time from when the shark’s
                                 head passed the opening of the starting compartment until the time the shark touched the black circle on the
                                 loudspeaker with its nose. As the trial time was capped at 10 s, if the black circle was not touched within this
                                 period, LST was noted as 15 s (Group 1) or 12 s (Group 2) (in order to clearly distinguish a touch at 10 s from not
                                 touching). To prove statistical significance of learning success, the probability of achieving the learning criteria
                                 by chance was determined as less than 5% (χ2 test, p < 0.05).
                                     For transfer tests, total trial time and action (i.e., touching or not touching the loudspeaker) were recorded
                                 for each trial. Transfer data from Group 1 was visualized, but due to the small amount of data no statistical tests
                                 were run. For Group 2, Transfer 1 data was analysed by using Generalized Linear Mixed Models (GLMM) to
                                 model action per trial type. Transfer test type was included as a fixed effect and individual as a random effect to
                                 account for individual variation. A GLMM was also used to determine whether transfer test LST times differed
                                 from regular LST times with type of session as fixed effect and individual as random effect. Transfer 2 data was
                                 visualized, but no statistical tests were run.
                                     Best fitted models were selected based on the dispersion plots and Akaike’s Information Criterion (AIC) value
                                 (SI 1). For all models, Wald Chi-square tests were performed to determine statistical significance of each effect.
                                 For all tests p < 0.05 was considered significant and p < 0.001 highly significant. All analyses and plots were run
                                 using the programming language R (v.4.0.3;63) in the software R Studio (v. 1.3.1073;64). Plots were produced using
                                 ‘ggplot2’65. Packages ‘lme4’66, ‘multcomp’67, ‘DHARMa’68 and ‘car’69 were used for statistical analyses.

                                 Ethics statement.        The research reported here was performed under the guidelines established by the cur-
                                 rent German animal protection law. The experimental protocol for behavioural trials on fish was approved by the
                                 ethics committee of the LANUV (State Office for Nature, Environment and Consumer Protection North Rhine-
                                 Westphalia, Germany; AZ 81-02.04.2020.A432). All applicable international, national, and/or institutional
                                 guidelines for the care and use of animals were followed. The authors complied with the ARRIVE guidelines.

                                 Results
                                 Acoustic measurements. Sound pressure levels (SPL) for ambient sound, a 90 Hz and a 210 Hz tone were
                                 measured in the experimental tank along a 15 cm grid (Fig. 2). SPL varied throughout the tank, with ambient
                                 sound being lowest on average (range 97–101 dB re 1 µPa), 90 Hz being loudest in the upper left corner (range
                                 97–128 dB re 1 µPa) and 210 Hz being loudest around the loudspeaker (range 93–135 dB re 1 µPa). SPL between
                                 the loudspeaker and SC (which is where the sharks swam most of the time) are comparable. SPL for all interme-
                                 diate frequencies were only measured at grid point ‘i7’ (Table 2).

                                 Group 1. Group 1 consisted of six females and one male, ranging in size from 63 to 75 cm and were referred
                                 to as shark A–G. All animals were successful in learning the first two steps (step 1: touching the loudspeaker
                                 when 200 Hz is played; step 2: not touching the loudspeaker when no tone is played and touching when 200 Hz
                                 is played). In the actual discrimination task, where 140 Hz was used to indicate a ‘No-Go’ trial and 200 Hz to
                                 indicate a ‘Go’ trial, all four participating individuals were successful. Due to sharks being trained in a superses-
                                 sion method, no learning curve is provided.

                                 Transfer tests. After successfully learning the ‘Go/No-Go’, two animals participated in supersessions where
                                 unfamiliar frequencies were introduced to determine the difference threshold. Due to time constraints, shark
                                 B performed two transfer supersessions, and shark D only one. Both shark B and D started touching the loud-
                                 speaker (action A) at 170 Hz (Figs. 3, 4, 5), meaning the difference threshold for these sharks was 30 Hz.

                                 Group 2. Due to time constraints, super sessions for group 1 were only performed three times. Since results
                                 were promising, a second experimental group was formed. Nine sharks started the experimental training proce-
                                 dure in Group 2. Acclimatization of the sharks was completed after four days, since eight out of the nine sharks
                                 swam uninhibited, ate from the forceps and were accustomed to the starting compartment and loudspeaker.
                                 Pre-training stopped when sharks swam out of the starting compartment voluntarily at least five times in a ses-
                                 sion. The following section will only summarize the results for those sharks that were successful in learning the
                                 task. Individual data of three sharks is presented, since participation of six sharks was stopped (one shark did
                                 not pass pre-training and did not progress to the training phase, and experimental participation of five sharks
                                 was stopped due to their lack of improvement or active participation in the experiment). The learning criterion
                                 in Part A (combination of visual and acoustic stimuli present) was reached by three sharks after 39 (shark 6)
                                 and 46 (sharks 1 and 4) sessions, respectively (Table 3). The learning criterion in Part B (only acoustic stimulus
                                 present) was reached by the same three sharks after the fifth (shark 1), eighth (shark 6) and 26th (shark 4) ses-

Scientific Reports |   (2022) 12:6520 |                 https://doi.org/10.1038/s41598-022-10257-1                                                    7

                                                                                                                                                 Vol.:(0123456789)
www.nature.com/scientificreports/
Figure 5. Grouped supersession data absolute number of action (not touching or touching the loudspeaker)
per unfamiliar frequency (150–190 Hz).
Stimulus presented Subject Sessions to reach LC
Shark 1 46
A. Acoustic + visual stimuli Shark 4 46
Shark 6 39
Shark 1 5
B. Acoustic stimulus Shark 4 26
Shark 6 8
Table 3. Result of acoustic discrimination tests for part A (acoustic and visual stimulus present) and part
B (acoustic stimulus present) in juvenile bamboo sharks. Number of sessions needed to reach the learning
criterion (LC: 70% correct choices in five consecutive sessions) and average loudspeaker touch (LST) times [s].
Note that the average times are the same for part A and B.
sion (Table 3). Average LST time (per shark) during all sessions ranged from 5.9 to 6.3 s (average of all sharks:
6.0 ± 0.5 s). Learning curves, LST time and statistical analyses are discussed per individual (Fig. 6).
Transfer tests. Transfer 1. Utilized stimuli. No significant effect of individual on action (i.e., touching or not
touching the loudspeaker) was found. However, due to the small number of individuals (N = 3) and observed
variation between individuals, both grouped and individual data are shown (Figs. 7 and 8). There was a signifi-
cant effect of type of transfer test on which action was performed (GLMbinomial; χ2 = 20.0, df = 2, p < 0.001). In
transfer type B (visual stimulus + no sound; Fig. 7) the loudspeaker was touched significantly more often than
not (Tukey: z = 4.2, p < 0.001), indicating that sharks can use the visual stimulus alone as a cue for trial type. Dur-
ing type A trials (no visual stimulus, 210 Hz; Fig. 7) and type C (visual stimulus, 90 Hz; Fig. 7) one action was not
performed significantly more often than the other, indicating that the conflicting information caused the sharks
to not be able to choose and therefore act according to chance. However, looking at the performance of shark 4
in transfer type A (Fig. 8) there seems to be a notable difference in action: out of 20 transfer trials, he chose to
not touch the loudspeaker 16 times versus touching the loudspeaker four times. No significant effect of type of
session (regular or transfer test session) on LST time was seen.
Transfer 2. Difference threshold. After reaching LC in part B (only acoustic stimulus present), supersessions
were conducted with all three individuals. Transfer tones were interspersed without a specific order. An example
of the structure of these supersessions is presented in Fig. 9. Grouped data is shown in Fig. 10.
Discussion
This study explored cognitive abilities of the grey bamboo shark C. griseum by conducting acoustic discrimination
experiments on 16 juvenile sharks with a Go/No-Go method, never before used on sharks. The results showed
that grey bamboo sharks can perform a Go/No-Go task and seven sharks were able to perform this task based
on acoustic stimuli. Transfer tests further elucidated that when both visual and acoustic stimuli were presented
together, both types of cues were used. This indicates that both visual and acoustic cues were acquired during
training. The smallest difference between frequencies that sharks successfully discriminated between was 30 Hz.
Acoustic discrimination. Seven sharks successfully learnt the Go/No-Go task, showing that bamboo
sharks can perform multiple types of cognitive tasks such as two-alternative forced choice1 and Go/No-Go tasks.
Scientific Reports | (2022) 12:6520 | https://doi.org/10.1038/s41598-022-10257-1 8
Vol:.(1234567890)
www.nature.com/scientificreports/
Figure 6. Individual data on percentage of correct choices (learning curve). The solid horizontal line indicates
the 70% LC threshold. Vertical dashed green lines indicate sessions including transfer test trials for utilized
stimuli. After completing the first set of transfer tests, the visual stimulus was taken out.
Figure 7. Grouped data (N = 3) for absolute number of action (not touching or touching the loudspeaker) and
transfer type (A, B or C).
In Group 1, four sharks reached LC. In Group 2, sharks were fully accustomed to the experimental set-up by the
time the experiment commenced, and three sharks reached learning criterion after 39 and 46 sessions. Reaching
LC required more sessions than learning other visual tasks in previous experiments with this species (between
10–30 sessions)7,13,70.
Grey bamboo sharks have been highly successful in learning visual discrimination tasks in previous stud-
ies. Vision seems to be a primary sensory system for fish, including sharks, living in tropical clear water
environments71,72. Based on this and other studies73 sharks were expected to prefer a visual stimulus over
Scientific Reports | (2022) 12:6520 | https://doi.org/10.1038/s41598-022-10257-1 9
Vol.:(0123456789)
www.nature.com/scientificreports/
Figure 8. Individual data for absolute number of action (not touching or touching the loudspeaker) per transfer
type (A, B or C).
Figure 9. Supersession 10 (shark 1). Touching the loudspeaker indicated by the time it took to touch
(LST time). Not touching the loudspeaker indicated by the shapes (at 12 s, indicating a capped trial i.e., the
loudspeaker was not touched) above the horizontal solid black line (indicating the maximum trial time).
Background colour indicates each separate phase (‘Go’ phase: blue, ‘No-Go’ phase: ‘orange, transfer: grey).
an acoustic one when both were presented simultaneously. However, this was not the case. While the visual
stimulus may have been essential for learning to occur, it was not preferred as the deciding cue in Transfer A
and C, i.e., sharks did not touch the loudspeaker significantly more often than not. This shows that both the
acoustic and visual stimulus had been learnt during training and that the conflicting information in the transfer
test situation caused the sharks to choose according to chance.
For Transfer 1 from Group 2, both grouped and individual data was shown even though according to statisti-
cal analysis there was no effect of individuals on the model. When looking at the actual data, a notable difference
in action in type A was seen in shark 4. After Transfer 1, the use of the visual stimulus was stopped, and only
acoustic stimuli were presented. Two of the sharks (shark 1 and 6) were quick to catch on and reached learning
criterion within the first week, indicating that the acoustic cues had already been associated with the respective
actions. In contrast, shark 4 took over four weeks (26 sessions) to reach learning criterion again. The difference in
action in transfer type A for shark 4 and the long time it took shark 4 to re-learn the acoustic task indicate that it
was more focused on the visual stimulus (and therefore confused by the lack of it after having been removed) than
the others. Another option is, that differences in the sharks’ personalities accounted for the different behaviors74,
highlighting the importance of taking individual variation into account.
Scientific Reports | (2022) 12:6520 | https://doi.org/10.1038/s41598-022-10257-1 10
Vol:.(1234567890)www.nature.com/scientificreports/
Figure 10. Grouped supersession data absolute number of action (not touching or touching the loudspeaker)
per unfamiliar frequency (100–200 Hz).
Difference threshold. In the lower frequency range (90–110 Hz) that was tested in Group 2, it seems
that a difference of 30 Hz between the target frequency (90 Hz) and an unfamiliar frequency was sufficient to
differentiate between them. This means that a clear difference in behavioural response was seen when playing
90 Hz or, for example, 120 Hz. In contrast, it seems that a similar difference of 30 Hz in the higher frequency
range (160–210 Hz) did not elicit a change in action performed. However, results from Group 1 showed that
200 Hz can still be successfully differentiated from 170 Hz. Thus, a difference of 30 Hz was also recognized in
the higher frequency range (160–210 Hz). In a previous study, sharks were taught to perform a two-alternative
forced choice experiment using 30 vs. 80 Hz and later 140 vs. 200 Hz73. Transfer testing showed there was a
greater difficulty in assigning new frequencies in the lower frequencies (around 30 Hz) and higher frequencies
ranges (around 200 Hz) than the tested mid-range frequencies (80–140 Hz)73. These findings support the results
of Group 2 from this study. Our results indicate that sharks’ ability to discriminate new frequencies in the range
of 90–110 Hz is higher than in the range of 160–210 Hz. Training session methods differed within this study,
but the experimental procedure for determining the difference threshold was similar and we assume results are
therefore comparable. These result are also in line with previous research on Port Jackson sharks H. portusjack‑
soni, which showed that sharks could learn an association task using an acoustic s timulus21, and lemon sharks
N. brevirostris, which showed that sharks could correctly perform a discrimination task using 60 vs. 40 Hz (i.e.
a difference of 20 Hz)20. Results of studies specifically looking at just noticeable differences (JND; a measure fre-
quently used for studying discrimination thresholds) in teleosts found comparable results. JND for goldfish C.
auratus was 9.4 Hz and for electric fish (Pollimyrus) 8.7 Hz37,40. Further testing is needed to determine whether
the action performed in the higher frequency range is consistent when repeated multiple times, and what ani-
mals choose when frequencies outside of the 90–210 Hz range are presented.
Implications of the study. Anthropogenic noise is considered a global source of environmental pollution75
and ranges anywhere from 0 to over 10,000 Hz, with median noise levels occurring between ca. 50–500 Hz76–78.
With the exception of high-frequency sonar, most anthropogenic noise thus overlaps considerably with the
hearing ranges of sharks and other marine organisms and can cause severe problems both behaviourally as
well as physiologically. Although potential effects are presently unknown, new or unnatural sounds are likely to
interfere with shark behaviour. Recent studies have shown that in areas where either an artificial sound or play-
back of an orca-call was played, fewer reef and coastal sharks appeared compared to silent control t rials49. Sound
was also shown to deter Port Jackson sharks H. portusjacksoni and epaulette sharks Hemiscyllium ocellatum
from responding to a positive stimulus such as food52. These findings agree with findings in southern stingrays
Hypanus americanus, who altered their swimming behaviour in response to tones ranging from 50–500 H z79.
The specific impact of noise depends on the nature of the sound and whether the receiving organism is respon-
oth80, with most bony fishes being able to detect both. Research
sive to either particle motion, sound pressure or b
studying the effects of anthropogenic noise on bony fishes has shown that it can impact fishes both on an indi-
vidual as well as a population level. Anthropogenic noise is harmful to marine organisms by impacting natural
behaviour and can cause physical damage23 and potentially even death, either directly or indirectly81,82. Anthropo-
genic noise affects individual fish by causing hearing l oss83,84, inducing s tress83,85–87, impacting i mmunity88 and/or
changing reproductive, social or other behaviour such as o rientation83,89–95. Moreover, a recent study on reef fish
showed that sound pollution interferes with learning to recognize a novel predator96. This is especially concern-
ing considering that the capacity of learning allows an organisms to adjust their behaviour based on previous
experiences and environmental variation1,4. On a population level, anthropogenic noise can disrupt the collective
dynamics of fish s hoaling97 and affects population growth by impairing survival and reproduction82,83,86,89,94,98.
With anthropogenic noise levels predicted to increase, a better understanding of the use of sound by sharks
and the potentially interfering effects of sound pollution on sharks and their learning abilities is imperative for
proper management and protection.
Scientific Reports | (2022) 12:6520 | https://doi.org/10.1038/s41598-022-10257-1 11
Vol.:(0123456789)www.nature.com/scientificreports/
Conclusion
The data presented in this study reveals the ability of grey bamboo sharks to perform a Go/No-Go task using
both visual and acoustic stimuli. No clear preference for the type of the presented sensory cues was detected,
although individual variation was seen. The frequency difference threshold of 30 Hz found in this study is com-
parable to results of previous experiments. Due to the small sample size, results of the statistical analysis should
be considered with caution and individual results should be concentrated on. Many cognitive studies on sharks
so far have used visual stimuli. Considering the poor knowledge of the use of sound by sharks and anthropogenic
noise expected to rise, new insights into sound recognition, detection and use are crucial to the management of
healthy populations of sharks.
Received: 3 October 2021; Accepted: 5 April 2022
References
1. Schluessel, V. Who would have thought that ‘Jaws’ also has brains? Cognitive functions in elasmobranchs. Anim. Cogn. 18, 19–37
(2015).
2. Guttridge, T. L., Myrberg, A. A., Porcher, I. F., Sims, D. W. & Krause, J. The role of learning in shark behaviour. Fish Fish. 10,
450–469 (2009).
3. Dill, L. M. Adaptive flexibility in the foraging behavior of fishes. Can. J. Fish. Aquat. Sci. 40, 398–408 (1983).
4. Philippi, T. & Seger, J. Hedging one’s evolutionary bets, revisited. Trends Ecol. Evol. 4, 41–44 (1989).
5. Clark, E. Instrumental conditioning of lemon sharks. Science 130, 217–218 (1959).
6. Guttridge, T. L., Yopak, K. E. & Schluessel, V. 16. Sharks—Elasmobranch cognition. in Field and Laboratory Methods in Animal
Cognition: A Comparative Guide 354 (2018).
7. Fuss, T., Bleckmann, H. & Schluessel, V. Visual discrimination abilities in the gray bamboo shark (Chiloscyllium griseum). Zoology
117, 104–111 (2014).
8. Fuss, T., Bleckmann, H. & Schluessel, V. The brain creates illusions not just for us: Sharks (Chiloscyllium griseum) can ‘see the
magic’ as well. Front. Neural Circuits 8, 1–17 (2014).
9. Fuss, T., John, L. & Schluessel, V. Same or different? Abstract relational concept use in juvenile bamboo sharks and Malawi cichlids.
Curr. Zool. 67, 279–292 (2018).
10. Schluessel, V. & Duengen, D. Irrespective of size, scales, color or body shape, all fish are just fish: object categorization in the gray
bamboo shark Chiloscyllium griseum. Anim. Cogn. 18, 497–507 (2015).
11. Fuss, T. & Schluessel, V. The Ebbinghaus illusion in the gray bamboo shark (Chiloscyllium griseum) in comparison to the teleost
damselfish (Chromis chromis). Zoology 123, 16–29 (2017).
12. Fuss, T. & Schluessel, V. Something worth remembering: Visual discrimination in sharks. Anim. Cogn. 18, 463–471 (2014).
13. Schluessel, V., Beil, O., Weber, T. & Bleckmann, H. Symmetry perception in bamboo sharks (Chiloscyllium griseum) and Malawi
cichlids (Pseudotropheus sp.). Anim. Cogn. 17, 1187–1205 (2014).
14. Fuss, T., Bleckmann, H. & Schluessel, V. Place learning prior to and after telencephalon ablation in bamboo and coral cat sharks
(Chiloscyllium griseum and Atelomycterus marmoratus). J. Comp. Physiol. A Neuroethol. Sens. Neural Behav. Physiol. 200, 37–52
(2014).
15. Fuss, T., Bleckmann, H. & Schluessel, V. The shark Chiloscyllium griseum can orient using turn responses before and after partial
telencephalon ablation. J. Comp. Physiol. A Neuroethol. Sens. Neural Behav. Physiol. 200, 19–35 (2014).
16. Guttridge, T. L. & Brown, C. Learning and memory in the Port Jackson shark, Heterodontus portusjacksoni. Anim. Cogn. 17, 415–425
(2014).
17. Schluessel, V. & Bleckmann, H. Spatial memory and orientation strategies in the elasmobranch Potamotrygon motoro. J. Comp.
Physiol. A Neuroethol. Sens. Neural Behav. Physiol. 191, 695–706 (2005).
18. Schluessel, V. & Bleckmann, H. Spatial learning and memory retention in the grey bamboo shark (Chiloscyllium griseum). Zoology
115, 346–353 (2012).
19. Kimber, J. A., Sims, D. W., Bellamy, P. H. & Gill, A. B. Elasmobranch cognitive ability: Using electroreceptive foraging behaviour
to demonstrate learning, habituation and memory in a benthic shark. Anim. Cogn. 17, 55–65 (2014).
20. Nelson, D. R. Hearing thresholds, frequency discrimination, and acoustic orientation in the lemon shark, Negaprion brevirostris
(Poey). Bull. Mar. Sci. 17, 741–768 (1967).
21. Vila Pouca, C. & Brown, C. Food approach conditioning and discrimination learning using sound cues in benthic sharks. Anim.
Cogn. 21, 481–492 (2018).
22. Rogers, P. H. & Cox, M. Underwater sound as a biological stimulus. In Sensory Biology of Aquatic Animals (eds Altema, J. et al.)
131–149 (Springer, 1988).
23. Slabbekoorn, H. et al. A noisy spring: The impact of globally rising underwater sound levels on fish. Trends Ecol. Evol. 25, 419–427
(2010).
24. Lurton, X. An Introduction to Underwater Acoustics: Principles and Applications (Springer Science & Business Media, 2002).
25. Knowlton, R. E. & Moulton, J. M. Sound production in the snapping shrimps Alpheus (Crangon) and Synalpheus. Biol. Bull. 125,
311–331 (1963).
26. Madsen, P. T. et al. Sperm whale sound production studied with ultrasound time/depth-recording tags. J. Exp. Biol. 205, 1899–1906
(2002).
27. Nelson, M. D., Koenig, C. C., Coleman, F. C. & Mann, D. A. Sound production of red grouper Epinephelus morio on the west
Florida shelf. Aquat. Biol. 12, 97–108 (2011).
28. Hildebrand, J. A. Anthropogenic and natural sources of ambient noise in the ocean. Mar. Ecol. Prog. Ser. 395, 5–20 (2009).
29. Montgomery, J. C., Jeffs, A., Simpson, S. D., Meekan, M. & Tindle, C. Sound as an orientation cue for the pelagic larvae of reef
fishes and decapod crustaceans. Adv. Mar. Biol. 51, 143–196 (2006).
30. Radford, C. A., Jeffs, A. G., Tindle, C. T. & Montgomery, J. C. Temporal patterns in ambient noise of biological origin from a shal-
low water temperate reef. Oecologia 156, 921–929 (2008).
31. Tolimieri, N., Jeffs, A. & Montgomery, J. Ambient sound as a cue for navigation by the pelagic larvae of reef fishes. Mar. Ecol. Prog.
Ser. 207, 219–224 (2000).
32. Ladich, F. & Myrberg, A. A. Agonistic behaviour and acoustic communication. Commun. Fish 1, 121–148 (2006).
33. Moulton, J. M. Swimming sounds and the schooling of fishes. Biol. Bull. 119, 210–223 (1960).
34. Myrberg, A. A. & Lugli, M. Reproductive behaviour and acoustical interactions. Commun. Fish. 1, 149–176 (2006).
35. Doksæter, L. et al. Behavioral responses of herring (Clupea harengus) to 1–2 and 6–7 kHz sonar signals and killer whale feeding
sounds. J. Acoust. Soc. Am. 125, 554–564 (2009).
36. Myrberg, A. A. The acoustical biology of elasmobranchs. Environ. Biol. Fish. 60, 31–45 (2001).
Scientific Reports | (2022) 12:6520 | https://doi.org/10.1038/s41598-022-10257-1 12
Vol:.(1234567890)www.nature.com/scientificreports/
37. Jacobs, D. W. & Tavolga, W. N. Acoustic frequency discrimination in the goldfish. Anim. Behav. 16, 67–71 (1968).
38. Fay, R. R. Perception of spectrally and temporally complex sounds by the goldfish (Carassius auratus). Hear. Res. 89, 146–154
(1995).
39. Leis, J. M., Carson-Ewart, B. M. & Cato, D. H. Sound detection in situ by the larvae of a coral-reef damselfish (Pomacentridae).
Mar. Ecol. Prog. Ser. 232, 259–268 (2002).
40. Marvit, P. & Crawford, J. D. Auditory discrimination in a sound-producing electric fish (Pollimyrus): Tone frequency and click-rate
difference detection. J. Acoust. Soc. Am. 108, 1819–1825 (2000).
41. Hawkins, A. D. Underwater sound and fish behaviour. In The Behaviour of Teleost Fishes (ed. Pitcher, T. J.) 114–151 (Springer,
1986).
42. Casper, B. M. The hearing abilities of elasmobranch fishes (2006).
43. Kalmijn, A. J. Hydrodynamic and acoustic field detection. in Sensory Biology of Aquatic Animals 83–130 (Springer, 1988).
44. Maruska, K. P. & Tricas, T. C. Test of the mechanotactile hypothesis: Neuromast morphology and response dynamics of mecha-
nosensory lateral line primary afferents in the stingray. J. Exp. Biol. 207, 3463–3476 (2004).
45. Dijkgraaf, S. The functioning and significance of the lateral-line organs. Biol. Rev. Camb. Philos. Soc. 38, 51–105 (1963).
46. Gardiner, J. M. Multisensory Integration in Shark Feeding Behavior (University of South Florida, 2012).
47. Hart, N. S. & Collin, S. P. Sharks senses and shark repellents. Integr. Zool. 10, 38–64 (2015).
48. van den Berg, A. V. & Schuijf, A. Discrimination of sounds based on the phase difference between particle motion and acoustic
pressure in the shark Chiloscyllium griseum. Proc. R. Soc. Lond. Biol. Sci. 218, 127–134 (1983).
49. Chapuis, L. et al. The effect of underwater sounds on shark behaviour. Sci. Rep. 9, 1–11 (2019).
50. Meyer, C. G., Dale, J. J., Papastamatiou, Y. P., Whitney, N. M. & Holland, K. N. Seasonal cycles and long-term trends in abundance
and species composition of sharks associated with cage diving ecotourism activities in Hawaii. Environ. Conserv. 36, 104–111
(2009).
51. Myrberg, A. A., Ha, S., Walewski, S. & Banbury, J. Effectiveness of acoustic signals in attracting epipelagic sharks to an underwater
sound source. Bull. Mar. Sci. 22, 926–949 (1972).
52. Ryan, L. A. et al. Effects of auditory and visual stimuli on shark feeding behaviour: The disco effect. Mar. Biol. 165, 11 (2018).
53. Wisby, W. J. & Nelson, D. R. Airplane observations of acoustic orientation in sharks. in American Fish Society Conference, Session
on fish behavior and sensory biology (1964).
54. Iverson, G. Go/No-Go testing. In Encyclopedia of Clinical Neuropsychology (eds Kreutzer, J. et al.) (Springer, 2011).
55. Eisenreich, B. R. & Szalda-Petree, A. Behavioral effects of fluoxetine on aggression and associative learning in Siamese fighting
fish (Betta splendens). Behav. Process. 121, 37–42 (2015).
56. Raddue, J. Schwellenwertmessung zur Diskriminierung verschiedener Frequenzen bei Aulonocara jacobfreibergi (Universität Bonn,
2020).
57. Anker, J., Zlebnik, N., Gliddon, L. & Carroll, M. Performance under a Go/No-go task in rats selected for high and low impulsivity
with a delay-discounting procedure. Behav. Pharmacol. 5, 406–414 (2009).
58. Hintze, S. et al. A cross-species judgement bias task: Integrating active trial initiation into a spatial Go/No-go task. Sci. Rep. 8, 1–13
(2018).
59. Means, L. W., Harrington, J. H. & Miller, G. T. The effect of medial thalamic lesions on acquisition of a go, no-go, tone-light dis-
crimination task. Bull. Psychon. Soc. 5, 495–497 (1975).
60. Oakley, D. A. Instrumental reversal learning and subsequent fixed ratio performance on simple and go/no-go schedules in neo-
decorticate rabbits. Physiol. Physiol. 7, 29–42 (1979).
61. Watanebe, M. Prefrontal unit activity during delayed conditional Go/No-go discrimination in the monkey. I. Relation to the
stimulus. Brain Res. 382, 1–14 (1986).
62. Audacity Team. Audacity(R): Free audio editor and recorder (2021).
63. R Core Team. R: A Language and Environment for Statistica (2020).
64. R Studio Team. RStudio: Integrated Development Environment for R (2020).
65. Wickham, H. ggplot2: Elegant Graphics for Data Analysis (Springer, 2016).
66. Bates, D., Maechler, M., Bolker, B. & Walker, S. Fitting linear mixed-effects models using lme4. J. Stat. Softw. 67, 1–48 (2015).
67. Hothorn, T., Bretz, F. & Westfall, P. Simultaneous inference in general parametric models. Biom. J. 50, 346–363 (2008).
68. Hartig, F. DHARMa: Residual Diagnostics for Hierarchical (Multi-Level/Mixed) Regression Models. R package version 0.4.1
(2021).
69. Fox, J. & Weisberg, S. An R Companion to Applied Regression 3rd edn. (Sage, 2019).
70. Schluessel, V., Rick, I. P. & Plischke, K. No rainbow for grey bamboo sharks: evidence for the absence of colour vision in sharks
from behavioural discrimination experiments. J. Comp. Physiol. A Neuroethol. Sens. Neural Behav. Physiol. 200, 939–947 (2014).
71. Brown, C., Laland, K. & Krause, J. Fish Cognition and Behavior Vol. 21 (Wiley, 2011).
72. Guthrie, D. M. Role of vision in fish behaviour. in The Behaviour of Teleost Fishes 77–113 (1986).
73. Halbe, E. Diskriminierung niederfrequenter Töne in einem Zweiwahl—Verfahren beim grauen Bambushai (Chiloscyllium griseum)
(Universität Bonn, 2018).
74. Dhellemmes, F. et al. Personality-driven life history trade-offs differ in two subpopulations of free-ranging predators. J. Anim. Ecol.
90, 260–272 (2021).
75. Kunc, H. & Schmidt, R. The effects of anthropogenic noise on fish: A behavioral ecology. Biol. Lett. 15, 20190649 (2019).
76. Dahl, P. H., Miller, J. H., Cato, D. H. & Andrew, R. K. Underwater ambient noise. Acoust. Today 3, 23–33 (2007).
77. Boyd, I. et al. The Effects of Anthropogenic Sound—A Draft Research Strategy (European Science Foundation and Marine Board,
2008).
78. Merchant, N. D. et al. Underwater noise levels in UK waters. Sci. Rep. 6, 1–10 (2016).
79. Mickle, M. F., Pieniazek, R. H. & Higgs, D. M. Field assessment of behavioural responses of southern stingrays (Hypanus ameri‑
canus) to acoustic stimuli. R. Soc. Open Sci. 7, 191544 (2020).
80. Slabbekoorn, H. Aiming for progress in understanding underwater noise impact on fish: Complementary need for indoor and
outdoor studies. in The Effects of Noise on Aquatic Life II 1057–1065 (Springer, 2016).
81. Rodkin, R. B. & Reyff, J. A. Underwater sound pressures from marine pile driving. J. Acoust. Soc. Am. 116, 2648 (2004).
82. Simpson, S. D. et al. Anthropogenic noise increases fish mortality by predation. Nat. Commun. 7, 10544 (2016).
83. de Jong, K. et al. Predicting the effects of anthropogenic noise on fish reproduction. Rev. Fish Biol. Fish. 30, 245–268 (2020).
84. McCauley, R. D., Fewtrell, J. & Popper, A. N. High intensity anthropogenic sound damages fish ears. J. Acoust. Soc. Am. 113,
638–642 (2003).
85. Cartolano, M. C. et al. Impacts of a local music festival on fish stress hormone levels and the adjacent underwater soundscape.
Environ. Pollut. 265, 114925 (2020).
86. Cox, K., Brennan, L. P., Gerwing, T. G., Dudas, S. E. & Juanes, F. Sound the alarm: A meta-analysis on the effect of aquatic noise
on fish behavior and physiology. Glob. Change Biol. 24, 3105–3116 (2018).
87. Kusku, H. Acoustic sound–induced stress response of Nile tilapia (Oreochromis niloticus) to long-term underwater sound trans-
missions of urban and shipping noises. Environ. Sci. Pollut. Res. 27, 36857–36864 (2020).
88. Masud, N., Hayes, L., Crivelli, D., Grigg, S. & Cable, J. Noise pollution: Acute noise exposure increases susceptibility to disease
and chronic exposure reduces host survival. R. Soc. Open Sci. 7, 200172 (2020).
Scientific Reports | (2022) 12:6520 | https://doi.org/10.1038/s41598-022-10257-1 13
Vol.:(0123456789)You can also read