Accurate surface ultraviolet radiation forecasting for clinical applications with deep neural network
←
→
Page content transcription
If your browser does not render page correctly, please read the page content below
www.nature.com/scientificreports
OPEN Accurate surface ultraviolet
radiation forecasting for clinical
applications with deep neural
network
R. Raksasat1,2, P. Sri‑iesaranusorn1,3, J. Pemcharoen4, P. Laiwarin5, S. Buntoung5, S. Janjai5,
E. Boontaveeyuwat4, P. Asawanonda4, S. Sriswasdi2,6* & E. Chuangsuwanich1,2*
Exposure to appropriate doses of UV radiation provides enormously health and medical treatment
benefits including psoriasis. Typical hospital-based phototherapy cabinets contain a bunch of
artificial lamps, either broad-band (main emission spectrum 280–360 nm, maximum 320 nm), or
narrow-band UV B irradiation (main emission spectrum 310–315 nm, maximum 311 nm). For patients
who cannot access phototherapy centers, sunbathing, or heliotherapy, can be a safe and effective
treatment alternative. However, as sunlight contains the full range of UV radiation (290–400 nm),
careful sunbathing supervised by photodermatologist based on accurate UV radiation forecast is vital
to minimize potential adverse effects. Here, using 10-year UV radiation data collected at Nakhon
Pathom, Thailand, we developed a deep learning model for UV radiation prediction which achieves
around 10% error for 24-h forecast and 13–16% error for 7-day up to 4-week forecast. Our approach
can be extended to UV data from different geographical regions as well as various biological action
spectra. This will become one of the key tools for developing national heliotherapy protocol in
Thailand. Our model has been made available at https://github.com/cmb-chula/SurfUVNet.
Phototherapy using artificial light sources is one of the standard treatments for various skin conditions1–3. With
established national guidelines and standard dosimetry protocols, hospital-based phototherapy provides safe
and effective treatment for a wide variety of patients. However, many skin patients in Thailand still lack access to
hospital-based phototherapy due to the limited number of phototherapy centers as well as shortage of qualified
phototherapy practitioners across the country.
Heliotherapy, or phototherapy using natural sunlight, has been reported effective for treating diverse health
issues4–6 and skin conditions7–9 since 1890s. Several clinical studies have also shown success outcomes of super-
vised heliotherapy in mostly European countries, including the Canary Islands, Spain, Helsinki, Finland and
Davos, Switzerland10–15. Despite clear benefits of heliotherapy, a key issue that limits its effectiveness is the
substantial variation in surface UV radiation throughout the year and time of day. Therefore, accurate estimates
of UV radiation, in conjunction with treatment action spectrum and dosimetry, are essential for developing a
safe and effective heliotherapy protocol in long-term use for a particular geographical region16–18. To date, a few
studies have explored the prospect of quantitative heliotherapy planning based on UV radiation forecast17,19.
Prediction of surface UV radiation can roughly be categorized into three groups: modeling based on the
physics of UV radiation, a hybrid between the physics and empirical techniques, and deep learning. Modeling
approaches based on the physics of UV radiation calculate the amount of solar UV radiation that arrives at a
certain location on Earth at a certain time mainly based on the Earth–Sun distance and the thickness of the
Earth’s ozone l ayer19–21. This is also known as the clear-sky UV radiation. Then, to obtain the amount of radiation
on the Earth’s surface, the clear-sky estimates are multiplied by factors such as Cloud Modification Factor19,22 to
account for reflection and scattering of UV in the atmosphere. Hybrid approaches rely on Physics knowledge
1
Department of Computer Engineering, Faculty of Engineering, Chulalongkorn University, Bangkok,
Thailand. 2Computational Molecular Biology Group, Faculty of Medicine, Chulalongkorn University,
Bangkok, Thailand. 3Division of Information Science, Nara Institute of Science and Technology, Nara,
Japan. 4Photodermatology Unit, Division of Dermatology, Department of Medicine, King Chulalongkorn Memorial
Hospital and Faculty of Medicine, Chulalongkorn University, Bangkok, Thailand. 5Department of Physics, Faculty
of Science, Silpakorn University, Nakhon Pathom, Thailand. 6Research Affairs, Faculty of Medicine, Chulalongkorn
University, Bangkok, Thailand. *email: sira.sr@chula.ac.th; ekapolc@cp.eng.chula.ac.th
Scientific Reports | (2021) 11:5031 | https://doi.org/10.1038/s41598-021-84396-2 1
Vol.:(0123456789)www.nature.com/scientificreports/
to define UV-related factors, such as total ozone column, zenith angle, and weather conditions, but incorporate
numerical simulations and regressions to estimate the contribution of these factors to the amount of surface
UV radiation in a data-driven manner22–25. In contrast, deep learning approaches attempt to predict surface UV
radiation data directly from past observations with little to no constraint on how UV-related factors i nteract26–29.
Although deep learning is effective for forecasting time series30 because of its ability to learn complex non-linear
relationship between the input and output data, it requires a large amount of data to train, lacks interpretability,
and does not perform well on new datasets with different distributions. It is expected that deep learning model for
UV forecasting needs to be retrained for each geographical region. Recent works in the energy domain have suc-
cessfully utilized recurrent neural network (RNN)31 architectures, such as Long Short-Term Memory (LSTM)32
and Gated Recurrent Unit (GRU)33, to predict solar photovoltaic power p roduction26,27,34–36.
37,38
Study of surface UV radiation in Th ailand showed that this region has sufficient UV radiation year-
round, indicating that heliotherapy is a promising treatment alternative for skin patients in the country. In this
work, we developed a deep learning model for surface UV radiation forecasting based on the encoder–decoder
architecture39 and 10-year surface UV radiation data collected at Nakhon Pathom, Thailand (13.82° N, 100.04°
E) from 2009 to 2019. The model requires only past UV radiation data as input and is able to predict antipsoriatic
effective irradiance17 at 10-min intervals from 8 AM to 4 PM with about 10% error for 24-h forecast and 13–16%
error for 7-day up to 4-week forecast. As the model’s performances are well within the acceptable error range
of 10–25% indicated in broadband UVB phototherapy guidelines worldwide1,40, our work serves as a key step
toward the establishment of the national heliotherapy protocol in Thailand.
Methods
Surface UV and weather data acquisition. Surface UV radiation, total ozone column, cloud coverage,
and aerosol optical depth at 500 nm (AOD500), were collected at the Faculty of Science, Silpakorn University,
Nakhon Pathom, Thailand (13.82° N, 100.04° E) from January 2009 to May 2019. UV intensity was measured
every 10 min from 5AM to 7PM at 1-nm wavelength interval from 280 to 400 nm in mW/m2 unit using a
DMc150 double monochromator (Bentham Instruments, Berkshire, UK). AOD500 and cloud coverage data
were collected from 6 AM to 6 PM from January 2011 to December 2018. Hourly AOD500 data were measured
by a ground based CE318 sunphotometer (Cimel Electronique, Paris, France) and calibrated by the Aerosol
Robotic Network (NASA, Washington, DC, USA). Cloud coverage data were estimated on a 0–10 scale from
recorded images of the sky every hour through a PSV-100 skyview instrument (Prede Company, Tokyo, Japan).
Total ozone column data were measured daily in Dobson unit (DU) via an OMI/Aura satellite (NASA, Wash-
ington, DC, USA) from January 2011 to December 2019. The distributions of UV radiation, cloud, ozone and
AOD500 in Nakhon Pathom throughout the year are shown in Fig. 1a–d, respectively.
Hourly downward surface UV radiation in J/m2, total ozone column in kg/m2, and mid cloud coverage were
also downloaded from E RA541 for London, England (51.5° N, 0° E) and Tokyo, Japan (35.75° N, 139.75° E) from
5AM to 7PM from January 2011 to December 2019. It should be noted that ERA5 datasets were generated from
a combination of actual observation (every 3-h) and computational reanalysis. ERA5 downward UV radiation
data cover the 200–440 nm wavelength range.
Data cleaning and preprocessing. Surface UV radiation exhibits an annual seasonal pattern. We used
this pattern as a justification for using UV data of the same dates from adjacent years to impute each missing data
point. This is crucial because missing UV data often arise from sensor malfunction which typically spans multi-
ple days. Also, because the artificial neural network model cannot handle missing values, imputation increases
the number of data points that can be used to train and test the model. Specifically, we impute each missing
data point with the average UV radiation from adjacent 10-min time steps, the same time steps from adjacent
days, and the same dates from adjacent years. The ranges of adjacent time steps, days, and years that were used
for imputation are 2, 5, and 2, respectively. Imputed data were visually inspected to ensure that the overall UV
intensity follows the expected bell-shape pattern with a peak at around noon. In Thailand, this bell-shape pattern
is often observed from October to January where there are few rainy and cloudy days. The Nakhon Pathom UV
data from 2014 were excluded from further considerations as there is a technical problem with the instrument.
Nakhon Pathom UV data were split into a training set (2009–2017), for optimizing the parameters of artificial
neural network models, a validation set (2018), for determining when to stop the optimization process, and a
test set (2019), for evaluating the performance of the final models. We found that using the whole training set,
i.e., using UV data from all dates and times, to train the models yielded the best performance. For the validation
and test sets, we further exclude data from days with anomalous UV intensity profiles to prevent them from
influencing the evaluation of the models. Specifically, we removed data from days whose UV profiles are highly
skewed (absolute skewness greater than 0.3), disproportional (ratio between maximal and minimal irradiances
greater than 15), or out of expected range (maximal irradiance above 400 or below 150 mW/m2). The distribu-
tions of cloud coverage in the validation and test datasets are shown in Fig. 1e and f, respectively. Finally, the
antipsoriatic irradiance at each time point was calculated from 280 to 400 nm UV data based on published
psoriasis clearance action spectrum f ormula17,42,43.
For evaluating the impact of incorporating ozone and AOD500 information as input into SurfUVNet, because
these data were available only up to 2018, we re-split the dataset by setting data from 2009 to 2016 as the training
set, data from 2017 as the validation set, and data from 2018 as the test set. The same quality filter for excluding
data from days with poor UV profiles defined above was also applied to these validation and test sets. SurfUVNet
model variants with and without ozone and AOD500 as input were then trained and evaluated together on this
data split.
Scientific Reports | (2021) 11:5031 | https://doi.org/10.1038/s41598-021-84396-2 2
Vol:.(1234567890)www.nature.com/scientificreports/
(a) (b)
700 Surface UV radiation Cloud coverage
1.0
Irradiance (mW/m2 ) 600 0.8
Cloud coverage
500 0.6
400 0.4
300 0.2
200 0
Jan Feb Mar Apr May Jun Jul Aug Sep Oct Nov Dec Jan Jan Feb Mar Apr May Jun Jul Aug Sep Oct Nov Dec Jan
(c) (d) 2.00
290 Total ozone column AOD500
1.75
280
1.50
Ozone (DU)
270 1.25
AOD500
1.00
260
0.75
250
0.50
240
0.25
230 0
Jan Feb Mar Apr May Jun Jul Aug Sep Oct Nov Dec Jan Jan Feb Mar Apr May Jun Jul Aug Sep Oct Nov Dec Jan
(e) (f) 5.0
Silpakorn cloud data ERA5 cloud data
4.0
ERA5 cloud data 4.0
3.5
3.0
3.0
Density
2.5
Density
2.0
2.0
1.5
1.0 1.0
0.5
0 0
0 0.2 0.4 0.6 0.8 1.0 0 0.2 0.4 0.6 0.8 1.0
Figure 1. Characteristics of UV and weather conditions at Nakhon Pathom, Thailand. Daily maximums are
shown for UV irradiance, total ozone column, and AOD500. Daily averages are shown for cloud coverage. Dark
lines indicate the average across 2009–2017. Shaded areas indicate the ± 1 standard deviation range. (a) Annual
surface UV irradiance. (b) Annual cloud coverage. (c) Annual total ozone column. (d) Annual AOD500. (e)
The distribution of cloud coverage in the validation set (UV data from year 2018). Both Silpakorn University’s
observations and ERA5 data were shown. (f) The distribution of cloud coverage in test set (UV data from year
2019). Information from Silpakorn University is unavailable.
SurfUVNet model architecture. Encoder–decoder-based model is a kind of deep learning model that
have been successfully applied to various applications such as image c aptioning44 and machine translation39. In
the context of UV forecasting, an encoder–decoder model can be used to translate a sequence of past observed
UV radiations into a sequence of future UV radiations. The model consists of two parts: encoder and decoder as
shown in Fig. 2a. Both parts consist of multilayered LSTMs. As the names implied, the LSTMs in the encoder are
used for encoding information from the input sequence while the LSTMs in the decoder decoded that informa-
tion to generate the output sequence.
As the input to our model, for the main implementation which relies only on UV data, we use a sequence
of 10-min interval antipsoriatic data from the previous days, denoted as [A1 , A2 , . . . , At ] and a sequence of
antipsoriatic data from the previous year, denoted as [B1 , B2 , . . . , Bt ]. For the model variant which also accepts
AOD500 and ozone, the inputs Ai ’s and Bi ’s will include these data of the same time-of-day from previous days
and previous year as well. To handle differences in data resolution for various features (10-min for UV irradi-
ance, hourly for AOD500, and daily for ozone), the values of features with lower resolutions were duplicated to
match the highest resolution.
Since the antipsoriatic values are seasonal in nature, we also include day-of-year information as the input by
encoding the day-of-year on a circular index defined as:
day day
Circular Index Date = sin 2π , cos 2π (1)
265 365
Scientific Reports | (2021) 11:5031 | https://doi.org/10.1038/s41598-021-84396-2 3
Vol.:(0123456789)www.nature.com/scientificreports/
Predicted
Encoder
Decoder
UV profile of the same date
from previous year
UV profiles of N previous days up to today
Predicted UV for Predicted UV for
day 15 day 16
UV profile of the day UV profile of the day
15 from previous year 16 from previous year
Predicted UV for day 15
UV profiles of days 1-14
UV profiles of days 2-14
Figure 2. Schematic of SurfUVNet. (a) The underlying encoder–decoder neural network architecture showing
the flow of data from the encoder to the decoder via the central connection denoted by S t. LSTM and Dense
indicates the Long Short-Term Memory and fully connected neural network layers, respectively. UV data from
days prior to the forecast date are fed into the encoder part while UV data from the same date of previous year
are fed into the decoder part. The model forecasts next-day UV radiation at 10-min resolution. (b) The auto-
recursive mode for long-term UV forecasting. To forecast UV radiation for the next N days, SurfUVNet first
forecast next-day’s UV radiation profile and then uses the prediction as input to forecast UV radiation profile for
the day after. This process is repeated until the forecasts for the next N days are generated.
The circular date feature
helps the model to learn the seasonal pattern. The model predicts future antipsoriatic
values,
y1 ,
yt .
y2 , . . . ,
Next, we provide detailed information of our model.
Encoder. The decoder takes the previous day sequence [A1 , A2 , . . . , At ] and the circular date feature as input.
We use a bi-directional45 LSTM as the first layer to help the model learns the temporal effect in both directions.
Scientific Reports | (2021) 11:5031 | https://doi.org/10.1038/s41598-021-84396-2 4
Vol:.(1234567890)www.nature.com/scientificreports/
The latter layers are uni-directional LSTM that will capture the information and pass the information to the
decoder via the final cell state, St.
Decoder. The decoder takes [B1 , B2 , . . . , Bt ] as input and uses it to future predict antipsoriatic values. The
first layer of the decoder is a LSTM layer which uses St from the decoder as the initial value of the cell state.
We also add two fully connected layers with sigmoid activation function with the dropout46 rate of 0.2 after the
LSTM layer for the final output.
Before feeding the input data to the model, we denoised the input antipsoriatic data with the Savitzky–Golay
filter47. Applying the filter, smooth out the input data, removing any possible noise spikes in the data. However,
we do not apply this processing to the target output data. If we train the model to predict the denoised data, the
model is learning to predict the unrealistic data and will not be able to handle noises in the UV intensities. Then,
we normalized the antipsoriatic data into a range of [0, 1].
We trained the model using quantile l oss48 defined as:
N
1
LQUANTILE = max q
yi − yi , q − 1
yi − yi (2)
N
i=1
where yi is the actual value and yi is the predicted value, q is a quantile value which balances the penalties of
overestimates and underestimates. If q is more than 0.5, the quantile loss gives more penalty to overestimated pre-
dictions and vice versa. In our work, we set q to 0.33 to favor overestimation rather than underestimation because
underestimated results can cause sunburn to patients due to a prescribed sunbathing time that is too long.
Model training. We used Adaptive Moment Estimation (ADAM)49 as the optimizer. The learning rate was
initially set to 0.0005 and iteratively reduced linearly by 1e−7 per epoch. Models were trained for 2000 epochs
with a batch size of 256.
Results
SurfUVNet model architecture. The task of forecasting in general can be formulated as a problem of
finding the best approximation for the relationship between past and future observations. For surface UV radia-
tion, which exhibits an annual seasonal pattern, the profile of next-day UV radiation can be modeled using not
only data from previous days but also data from previous years. Here, we adapted an encoder–decoder architec-
ture, which can effectively capture relationship between sequence data, to develop an artificial neural network
model for forecasting next-day surface UV radiation. Our model, named SurfUVNet, takes in UV radiation
profiles of the past 7, 14, or 21 days through the encoder and passes the encoded information to the decoder. The
decoder then takes in the UV radiation profile of the same date as the next day but from last year, combines it
with information from the encoder, and then generates the next-day forecast (Fig. 2a). Intuitively, because UV
radiation exhibits annual seasonal pattern, our approach models the next-day UV radiation profile as a trans-
formed version of last year’s data and uses recently observed UV pattern to learn the appropriate transformation.
Finally, to forecast UV radiation profile further into the future, our approach essentially performs next-day fore-
cast repeatedly via an auto-regressive approach. For example, if we define today as the day N, to predict the UV
radiation profile for next week, or day N + 7, our model first uses data from days N − 6, N − 5, …, N to forecast
UV for the day N + 1, and then uses the data from days N − 5, N − 4, …, N, and the forecast for the day N + 1 to
forecast UV for the day N + 2, and so on (Fig. 2b).
Benchmark procedure. We evaluated the performance of SurfUVNet (also called Seq2Seq-14 here)
against four alternative models: a simple model that uses the previous day UV radiation pattern as the predic-
tion, an empirical approach that combined physics knowledge to define the interactions between UV-related fac-
tors with regression technique to learn coefficient values, which is currently in used by the Thai Meteorological
Department22, a CNN-LSTM neural network model developed for solar power f orecasting27, and an implemen-
tation of bidirectional GRU neural network model which is often used in time series forecasting applications.
As prior study has shown that the CNN-LSTM model benefits from additional smoothing of UV data from
rainy days27, we considered two CNN-LSTM model implementations: one without smoothing and one with
Savitzky–Golay filter42 (denoted by CNN-LSTM and CNN-LSTM-SG in Fig. 3a and Table 1). To fairly compare
model performance, the validation and test datasets were subjected to quality filtering to remove days with
highly skewed and out-of-range UV irradiance values (see “Methods” section) where all models are expected to
perform poorly on. However, it should be noted that this does not mean that our validation and test sets consist
of only clear-sky data. The distribution of cloud coverage shows that both datasets contain many days with cloud
coverage above 0.2 and up to 0.4 or more (Fig. 1e and f).
Next‑day antipsoriatic irradiance forecast for Nakhon Pathom dataset. All artificial neural net-
work models were trained using the same UV data from 2011 to 2017 and evaluated on the same UV data from
2018 and 2019 while the regression model based on Earth–Sun distance and total ozone column was fit to UV
and ozone data of the same year. All models were trained to forecast next-day antipsoriatic irradiance at 10-min
resolution. Furthermore, as past UV radiation profile is a critical input data for artificial neural network models,
we tried inputting data from 7, 14, or 21 days prior to the forecast date to explore whether the models benefit
from seeing data from more distant past.
Scientific Reports | (2021) 11:5031 | https://doi.org/10.1038/s41598-021-84396-2 5
Vol.:(0123456789)www.nature.com/scientificreports/
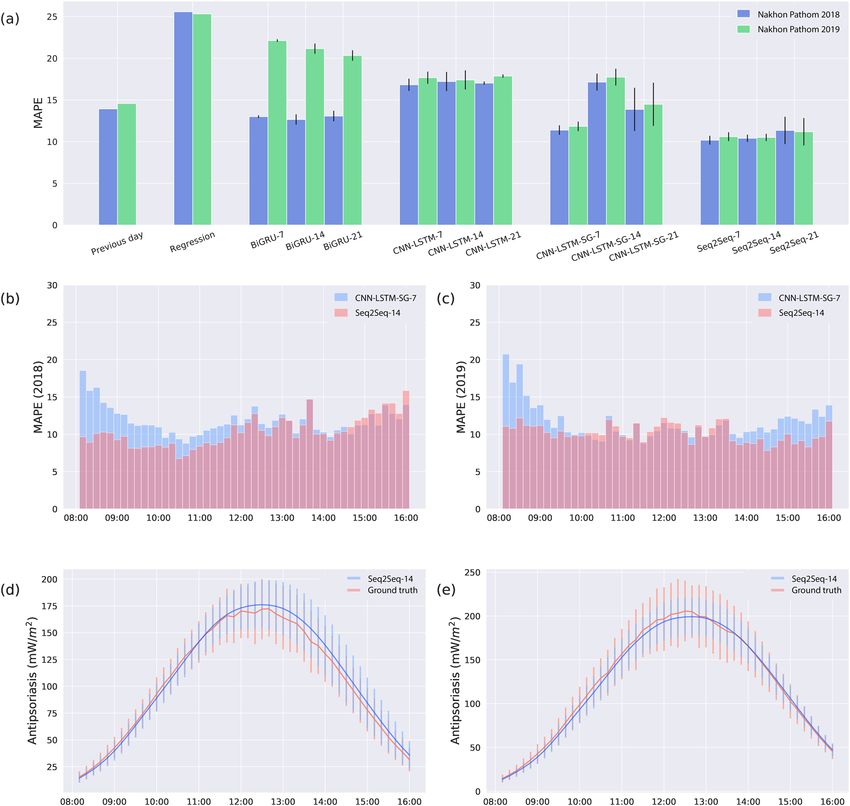
Figure 3. SurfUVNet accurately forecast antipsoriatic irradiance throughout the day. Results on Nakhon
Pathom dataset were shown. (a) Comparison of the mean absolute percentage errors (MAPE) for the next-day
antipsoriatic irradiance forecast between SurfUVNet (Seq2Seq-14) and four benchmark models (see “Methods”
section). Previous day model simply predicts next-day’s UV radiation to be the same as today’s. Regression
model refers to the regression model based on Earth–Sun distance and total ozone column currently in used by
the Thai Meteorological D epartment22. BiGRU is an artificial neural network architecture that is often utilized
for time series forecasting. CNN-LSTM, and CNN-LSTM-SG are artificial neural network models that were
recently applied to UV forecasting in the energy d omain27. The tags − 7, − 14, and − 21 designate the length of
UV data, in days prior to the forecast date, that were input into each model. (b) Distribution of MAPE for the
validation set (UV data from 2018) throughout the times of the day. Results for the best performing models,
namely CNN-LSTM-SG-7 and SurfUVNet (Seq2Seq-14), are shown. (c) A similar plot showing distribution of
MAPE for the test set (UV data from 2019). (d) Comparison of ground truth UV data and forecasts made by
SurfUVNet for the validation set (UV data from 2018). Error bars indicate one-standard deviation ranges. (e) A
similar plot for the test set (UV data from 2019).
Overall, SurfUVNet achieves the best next-day forecasting performance with mean absolute percentage errors
(MAPE) of 10.41 and 10.51 on the validation and test sets, respectively (Seq2Seq models in Fig. 3a and Table 1).
It should be noted that while the CNN-LSTM-SG model can also reach similar levels of performance (MAPE of
11.39 and 11.84), it is highly sensitive to the length of input UV data. Changing the length of input UV data from
7 days to 14 or 21 days significantly raises the MAPE of CNN-LSTM-SG models to 13.87–17.74. In contrast, the
performance of SurfUVNet is stable with respect to the length of the input. Furthermore, SurfUVNet achieves
Scientific Reports | (2021) 11:5031 | https://doi.org/10.1038/s41598-021-84396-2 6
Vol:.(1234567890)www.nature.com/scientificreports/
Model Number of parameters Validation set MAPE (2018, 8AM–4PM) Test set MAPE (2019, 8AM–4PM)
Previous day model – 13.93 14.58
Regression model based on Earth–Sun distance and total ozone
6 25.57 25.32
column22
b
BiGRU-7 39,165,013 13.00 ± 0.16 22.12 ± 0.33
BiGRU-14 78,158,933 12.66 ± 0.62 21.15 ± 1.20
BiGRU-21 117,152,853 13.07 ± 0.63 20.33 ± 0.47
CNN-LSTM-727 16.82 ± 0.73 17.67 ± 0.91
CNN-LSTM-1427 17.21 ± 1.15 17.40 ± 0.44
CNN-LSTM-2127 17.02 ± 0.20 17.87 ± 0.24
178,077
CNN-LSTM-SG-7 11.39 ± 0.57 11.84 ± 0.63
CNN-LSTM-SG-14 17.14 ± 1.01 17.74 ± 0.70
CNN-LSTM-SG-21 13.87 ± 2.59 14.48 ± 1.96
Seq2Seq-7 10.18 ± 0.53 10.60 ± 0.34
Seq2Seq-14 (SurfUVNet) 1,627,393 10.41 ± 0.43 10.51 ± 0.41
Seq2Seq-21 11.35 ± 1.64 11.19 ± 0.33
Table 1. Mean absolute percentage errors (MAPE) of the next-day antipsoriatic irradiance forecasting
produced by SurfUVNet and benchmark models on Nakhon Pathom dataset.
Tokyo London
Validation set MAPE (2018, Test set MAPE (2019, Validation set MAPE (2018,
Model 8AM–4PM) 8AM–4PM) 8AM–4PM) Test set MAPE (2019, 8AM–4PM)
Previous day model 21.78 35.50 18.14 43.57
Regression model based on Earth–
Sun distance and total ozone 16.68 16.52 18.68 19.17
column22
CNN-LSTM-SG-7 14.75 ± 0.41 15.77 ± 0.33 13.14 ± 0.35 16.27 ± 0.54
CNN-LSTM-SG-14 13.18 ± 0.28 14.99 ± 0.51 12.19 ± 0.19 17.78 ± 0.19
Seq2Seq-14 (SurfUVNet) 11.83 ± 0.44 12.72 ± 0.67 11.54 ± 0.50 17.74 ± 0.19
Table 2. Mean absolute percentage errors (MAPE) of the next-day antipsoriatic irradiance forecasting
produced by SurfUVNet and other models on the ERA5 Tokyo and London datasets.
consistent forecasting accuracy throughout the day while the CNN-LSTM-SG model produce significantly higher
forecast error during the morning and afternoon hours (8AM–9AM and 2PM–4PM) compared to the middle
of the day (Fig. 3b and c). Lastly, comparison of ground truth antipsoriatic irradiance and SurfUVNet’s forecast
confirmed that SurfUVNet’s prediction closely mimics the expected bell-shaped pattern of daily UV radiation
in both validation and test sets (Fig. 3d and e).
Next‑day downward solar UV irradiance forecast for Tokyo and London datasets. All models
were further evaluated on hourly downward solar UV irradiance data obtained from ERA5 for Tokyo, Japan
and London, England, which represent different weather regimes from Thailand’s. In contrast to the seasonal
cloud coverage pattern at Nakhon Pathom (Fig. 1b), cloud coverage for Tokyo and London fluctuates around
0.2–0.4 year-round (Supplementary Figure 1). Furthermore, day-to-day variation in UV radiation profiles are
much higher in Tokyo and London compared to Nakhon Pathom, as indicated by much higher MAPE between
today’s and the next day’s UV profiles (Tables 1 and 2, 21.78–35.50 for Tokyo, 18.14–43.57 for London, and
13.93–14.58 for Nakhon Pathom). Overall, SurfUVNet performs competitively, achieving MAPE of 12.72 and
17.74 for the next-day forecast for Tokyo and London datasets, respectively (Table 2). The regression model
based on Earth–Sun distance and total ozone column performs much better on these datasets than on Nakhon
Pathom’s (Tables 1 and 2, MAPE of 16.52–19.17 on ERA5 compared to 25.52–25.57 on Nakhon Pathom) and
only slightly worse than the artificial neural network approaches. Again, it should be noted that the validation
and test sets contain many days with considerable cloud coverage (Supplementary Figure 2).
Adding weather information does not improve forecasting. As atmospheric conditions can reflect
and scatter UV radiation before it reaches the Earth’s surface, we tried incorporating total ozone column, atmos-
pheric aerosol (AOD500), and cloud coverage data into SurfUVNet. However, cloud coverage data contain many
missing values that could not be imputed due to the irregularity of the data and had to be excluded from model
development. Instead, we used cloud coverage data to evaluate whether SurfUVNet overestimates the amount
of UV radiation when the weather is cloudy. This reveals that SurfUVNet’s forecasting errors weakly correlate
with cloud condition (Fig. 4, spearman rank correlation = 0.16776, − 0.04546, and 0.20229 for Nakhon Pathom,
Scientific Reports | (2021) 11:5031 | https://doi.org/10.1038/s41598-021-84396-2 7
Vol.:(0123456789)www.nature.com/scientificreports/
Nakhon Pathom (2019) Tokyo (2019)
Percentage error
Percentage error
Cloud coverage Cloud coverage
London (2019) Nakhon Pathom (heliotherapy sunbathing session)
Percentage error
Percentage error
Cloud coverage Cloud coverage
Figure 4. SurfUVNet’s forecast error weakly correlates with cloud coverage. Violin plots showing the
distribution of SurfUVNet’s forecast error in 1-h interval with various cloud coverage. Errors on the test sets
(UV data from year 2019) are shown. (a) Nakhon Pathom dataset. (b) Tokyo dataset. (c) London dataset.
(d) Heliotherapy sunbathing sessions planned by photodermatologist at King Chulalongkorn Memorial
Hospital. Each data point that constitutes the violin plots correspond to the error between predicted and
actual antipsoriatic irradiances that a patient would be exposed to if he or she were to sunbath according to
dermatologist’s planning.
Tokyo, and London 2019 datasets). For Nakhon Pathom dataset, SurfUVNet’s forecast error stays roughly the
same before shifting upward when cloud coverage goes above 0.7 (Fig. 4a). For Tokyo dataset, SurfUVNet’s error
is not correlated with cloud coverage at all (Fig. 4b). SurfUVNet’s error shows the clearest correlation with cloud
coverage in London dataset (Fig. 4c). Addition of ozone and AOD500 data into SurfUVNet does not improve
the performance of the base model that utilizes only UV data (Supplementary Figure 3). The model with ozone
and AOD500 data achieves MAPE of 15.33 on the validation set (data from 2017) and MAPE of 13.91 on the
test set (data from 2018), while the base model achieves MAPE of 14.32 and 13.60, respectively. This may be
because ozone and AOD500 data were collected at lower frequency (hourly vs every 10 min) and at a shorter
time period during the day (6AM–6PM vs 5AM–7PM) than UV data. Although data from the early morning
and late evening hours where the amount of UV radiation is almost nonexistence should not contribute much to
the forecasting of UV radiation during daylight hours, we found that withholding UV data from 6AM to 8AM
and 4PM to 6PM from the model slightly raises error from 10.51 to 11.78 MAPE (Wilcoxon signed rank test
result is not significant with p value = 0.5567). Lastly, to evaluate the impact of uncertainty of next-day ozone
and AOD500 on the forecast performance, a variant of SurfUVNet was trained with the actual values of next-day
ozone and AOD500. This does not reduce the forecast error (MAPE of 15.70 and 15.50 on the validation and test
sets, respectively), indicating that the limitation lies elsewhere.
Scientific Reports | (2021) 11:5031 | https://doi.org/10.1038/s41598-021-84396-2 8
Vol:.(1234567890)www.nature.com/scientificreports/
(a)
Today N-th day
Today N-th day
Forecast
Forecast
…
(b)
Seq2Seq (auto-regressive) Seq2Seq (auto-regressive)
Seq2Seq (specific day) Seq2Seq (specific day)
Regression Regression
CNN-LSTM-SG (specific day) CNN-LSTM-SG (specific day)
Forecast date (# of days into the future) Forecast date (# of days into the future)
Figure 5. Long-term antipsoriatic irradiance forecasting. Results on Nakhon Pathom dataset were shown. (a)
Diagram of two approaches for making long-term forecast: developing specific artificial neural network model
for making forecast for a specific day that is a certain number of days into the future (left) and autoregressively
using the next-day forecast as input for making forecast for the day after that (right). (b) Long-term antipsoriatic
irradiance forecasting performance for up to 28 days into the future on the validation set (UV data from 2018)
and the test set (UV data from 2019). Performance for SurfUVNet, the regression model based on Earth–Sun
distance and total ozone column, and the best CNN-LSTM models were shown.
Long‑term antipsoriatic irradiance forecasting. Long-term UV forecasting is essential for heliother-
apy applications as it allows clinicians and patients to plan sunbathing schedule in advance and make necessary
adjustments to the schedule to achieve the desire UV radiation dosage. We explored two approaches for forecast-
ing antipsoriatic irradiance for up to a month into the future (Fig. 5a). The first approach is to train a collection
of artificial neural network models, each making the forecast for a specific date that is a certain number of days
into the future. In other words, we trained one model for making the next-day forecast, one model for making
the forecast for the day after that, and so on. The second approach is to train a single model for making the next-
day forecast and then autoregressively use the next-day forecast as in input to make the forecast for the day after
that. Evaluation on Nakhon Pathom 2018–2019 UV datasets showed that the performance of the autoregressive
approach is quite stable with average MAPE of 13.70–15.79 for forecasting up to 28 days into the future (Table 3
and Fig. 5b). On the other hand, developing specific models for specific days performs well on the 2019 dataset
but poorly on the 2018 dataset (MAPE of 11.46 vs 18.38 for forecasting up to 28 days into the future). We also
additionally explored the possibility of training a model that can forecast UV profiles of multiple days at once,
but the performances were much worse than the two methods described above (MAPE of 29.49 and 49.69 for
forecasting the next 7 days at once on the 2018 and 2019 datasets, respectively). Hence, we decided to choose the
autoregressive approach for SurfUVNet. It should be noted that the regression approach based on Earth–Sun
distance and ozone information performed poorly on Nakhon Pathom’s UV data even for next-day forecast
(Table 1, MAPE of 25.32–25.57).
Discussion
We have developed SurfUVNet, an artificial neural network model for predicting surface UV radiation that
achieves around 10% error for next-day forecast and 13–16% error for 7-day up to 4-week forecast. This affirms
that quantitative UV forecast is appropriate for heliotherapy applications, which tolerate up to 10–25% error level.
SurfUVNet’s performance is competitive on UV data from multiple regions, Thailand, Japan, and England, and
on both antipsoriatic and downward irradiance. Hence, SurfUVNet can be adapted for forecasting other useful
UV action spectra such as vitamin D production and erythemal UV index as well. In fact, our model can even
be trained to forecast antipsoriatic irradiance from input erythemally-weighted UV data from a UV Biometer
instrument with a small performance reduction (data now shown). This capability is necessary for establishing
a national heliotherapy network in Thailand because there is only one full-spectrum UV sensor located in the
central region of the country while the rest of the country is covered by a network of UV Biometers.
A key limitation of artificial neural network is that it tends to overfit to the training dataset and does not
generalize well to other datasets that come from different distributions. In the context of UV forecasting, this
dictates that the model must be retrained with data from particular weather station in order to be usable for that
geographic region. Indeed, the accuracy of each model varies by 5–6% across the three geographical regions,
Thailand, Japan, and England and even across 2018 and 2019 in the case of London dataset (Tables 1 and 2). For
the case of London dataset, comparison of UV profiles between consecutive days in 2019 showed an extremely
Scientific Reports | (2021) 11:5031 | https://doi.org/10.1038/s41598-021-84396-2 9
Vol.:(0123456789)www.nature.com/scientificreports/
Model Target day Validation set MAPE (2018, 8AM–4PM) Test set MAPE (2019, 8AM–4PM)
7 25.57 25.07
Regression model based on Earth–Sun 14 26.10 25.11
distance and total ozone column22 21 26.53 25.45
28 26.37 25.53
7 16.18 ± 0.42 16.68 ± 0.59
CNN-LSTM-SG-7 14 16.09 ± 1.70 16.60 ± 1.77
Forecast specific date 21 14.91 ± 1.08 15.24 ± 0.29
28 14.76 ± 1.39 15.09 ± 1.56
7 18.56 ± 2.65 17.41 ± 2.70
CNN-LSTM-SG-7 14 20.60 ± 2.31 19.49 ± 2.92
Auto-regressive 21 22.51 ± 1.97 21.37 ± 1.83
28 24.45 ± 1.60 22.62 ± 0.98
7 16.69 ± 0.92 16.73 ± 1.16
CNN-LSTM-SG-14 14 14.82 ± 0.63 15.49 ± 1.43
Forecast specific date 21 15.96 ± 0.99 16.18 ± 0.46
28 15.46 ± 0.71 15.55 ± 1.14
7 17.31 ± 0.45 17.77 ± 0.55
CNN-LSTM-SG-14 14 17.20 ± 0.47 19.16 ± 0.65
Auto-regressive 21 17.13 ± 0.50 20.71 ± 0.57
28 17.00 ± 0.50 20.83 ± 0.97
7 12.21 ± 0.65 12.68 ± 0.53
Seq2Seq-14 (SurfUVNet) 14 16.42 ± 1.40 12.80 ± 1.64
Forecast specific date 21 16.61 ± 1.29 11.97 ± 0.88
28 18.28 ± 1.57 11.46 ± 0.38
7 13.13 ± 0.41 13.86 ± 0.91
Seq2Seq-14 (SurfUVNet) 14 14.03 ± 0.62 14.09 ± 1.49
Auto-regressive 21 14.22 ± 0.74 13.83 ± 2.20
28 15.79 ± 1.90 13.70 ± 2.65
Table 3. Mean absolute percentage errors (MAPE) for long-term antipsoriatic irradiance forecasting for up to
28 days into the future on Nakhon Pathom dataset.
high average variation of 43.57%. The discrepancy in performance of the regression model based on Earth–Sun
distance and total ozone column developed by the Thai Meteorological D epartment22 between Nakhon Pathom
and ERA5 datasets (25% error on Nakhon Pathom and 16–19% error on ERA541 datasets) could be attributed
to the fact that ERA5 data, which contain more detailed ozone measurements (hourly compared to daily) and
were computationally interpolated, are likely to be more easily fitted by regression.
The fact that SurfUVNet’s forecast error only weakly correlates with cloud coverage (Fig. 4) is unexpected
but may be explained by the fact that cloud coverage in Nakhon Pathom exhibits clear seasonal pattern (Fig. 1b)
and that the UV radiation profiles are stable over consecutive days (Table 1, MAPE of 13.94–14.58 for previous
day model). On a geographical region with highly variable weather condition, such as London in 2019, artificial
neural network models’ performance drop significantly (Table 2) and the error of SurfUVNet exhibits higher cor-
relation with cloud coverage (Fig. 4c). Hence, artificial neural network models seem to be able to exploit seasonal
weather pattern and day-to-day variation to achieve good performance without relying on explicit cloud coverage
information. This capability of the model to extract seasonal patterns may also explain why addition of ozone
and AOD500 information did not improve the performance of SurfUVNet (Supplementary Figure 3), particu-
larly as AOD500 level at Nakhon Pathom closely follows the same seasonal pattern as cloud coverage (Fig. 1d).
We explored two approaches for forecasting long-term UV radiation. Initially, we expected that developing
a specific model for making the forecast for a specific date a certain number of days into the future would yield
better performance than an autoregressive approach which use the next-day forecast as input for making the
forecast for the day after because forecasting errors would accumulate through autoregressive steps. However,
the models for specific date seem to overfit the training data, performing well on the 2019 dataset but poorly on
the 2018 dataset (Table 3, 11.46% vs 18.28% error for forecasting up to 28 days into the future). In contrast, the
autoregressive approach performs more consistently (13.70% and 15.79% error). An explanation for the over-
fitting of the model trained for specific date may be because the relationship between today’s and next week’s
UV radiation profiles is so weak that the models learn mostly patterns that are specific to the training dataset.
The poor performance of models for multi-day forecast (29.49–49.69% error for 7-day forecast) is likely due
to the sheer number of outputs that the models must optimize. To make a 7-day forecast at 10-min resolution,
the model has to output 595 values. From these results, we recommend the autoregressive approach for making
long-term UV forecast with SurfUVNet.
Scientific Reports | (2021) 11:5031 | https://doi.org/10.1038/s41598-021-84396-2 10
Vol:.(1234567890)www.nature.com/scientificreports/
To prospectively examine whether SurfUVNet’s performance is sufficient for heliotherapy applications, we
asked photodermatologist at King Chulalongkorn Memorial Hospital to plan a 3-month sunbathing course based
on SurfUVNet’s output and then compared their schedule with the ground truth antipsoriatic irradiances of the
same time interval. This reveals that the error in antipsoriatic dose that the patient would receive by following
the clinician’s sunbathing protocol remains well within the acceptable 10–25% up to 0.3 cloud coverage (Fig. 4d,
MAPE of 11.23). A possible solution for accounting for weather effects on UV radiation that we are exploring is
to have each patient carry a portable UV sensor or a smartphone equipped with light sensor and use that data
to adjust SurfUVNet’s forecast in real-time.
Received: 7 October 2020; Accepted: 16 February 2021
References
1. Menter, A. et al. Guidelines of care for the management of psoriasis and psoriatic arthritis: section 5. Guidelines of care for the
treatment of psoriasis with phototherapy and photochemotherapy. J. Am. Acad. Dermatol. 62, 114–135 (2010).
2. Legat, F. J. Importance of phototherapy in the treatment of chronic pruritus. Der Hautarzt 69, 631–640 (2018).
3. Patrizi, A., Raone, B. & Ravaioli, G. M. Safety and efficacy of phototherapy in the management of eczema. In Ultraviolet Light in
Human Health, Diseases and Environment. Advances in Experimental Medicine and Biology, vol 996. (ed. Ahmad, S. I.) 319–331
(Springer, Berlin, 2017).
4. Metzger, J. The clinical application of heliotherapy. Trans. Am. Climatol. Clin. Assoc. 42, 132–138 (1926).
5. Gardiner, C. F. Heliotherapy in Colorado. Trans. Am. Climatol. Clin. Assoc. 31, 184–191 (1915).
6. Alpert, J. S. The Jeremiah Metzger lecture: Jeremiah Metzger and the era of heliotherapy. Trans. Am. Clin. Climatol. Assoc. 126,
219–226 (2015).
7. Linser, K. & Harnack, K. Heliotherapy of mycosis fungoides. Arch. Klin. Exp. Dermatol. 215, 181–201 (1962).
8. Buchholz, W. Heliotherapy of psoriasis. Zeitschrift fur Haut- und Geschlechtskrankheiten 44, 13–16 (1969).
9. Korbler, J. To the history of development of heliotherapy. Hippokrates 38, 145–150 (1967).
10. Hitomi, K. et al. Climatotherapy in Japan: a pilot study. Int. J. Biometeorol. 61, 2141–2143 (2017).
11. Snellman, E. Comparison of the antipsoriatic efficacy of heliotherapy and ultraviolet B: a cross-over study. Photodermatol. Photo-
immunol. Photomed. 9, 83–85 (1992).
12. Snellman, E. et al. Effect of heliotherapy on skin and joint symptoms in psoriasis: a 6-month follow-up study. Br. J. Dermatol. 128,
172–177 (1993).
13. Takada, Y., Irisawa, K. & Kawada, A. Heliotherapy of pityriasis licgenoides chronica. J. Dermatol. 4, 91–94 (1977).
14. Snellman, E., Jansen, C. T., Lauharanta, J. & Kolari, P. Solar ultraviolet (UV) radiation and UV doses received by patients during
four-week climate therapy periods in the Canary Islands. Photodermatol. Photoimmunol. Photomed. 9, 40–43 (1992).
15. Snellman, E. et al. Supervised four-week heliotherapy alleviates the long-term course of psoriasis. Acta Dermato-Venereol. 73,
388–392 (1993).
16. Krzyscin, J. W. et al. Perspectives of the antipsoriatic heliotherapy in Poland. J. Photochem. Photobiol. B 140, 111–119 (2014).
17. Krzyscin, J. W. et al. Effectiveness of heliotherapy for psoriasis clearance in low and mid-latitudinal regions: a theoretical approach.
J. Photochem. Photobiol. B 115, 35–41 (2012).
18. Moosa, Y. & Esterhuyse, D. Heliotherapy: a South African perspective. S. Afr. Med. J. 100(11), 728–733 (2010).
19. Krzyscin, J. W. et al. 24 hour forecast of the surface UV for the antipsoriatic heliotherapy in Poland. J. Photochem. Photobiol. B
148, 136–144 (2015).
20. Allaart, M., van Weele, M., Fortuin, P. & Kelder, H. An empirical model to predict the UV-index based on solar zenith angles and
total ozone. Meteorol. Appl. 11(1), 59–65 (2004).
21. Leccese, F., Salvadori, G., Lista, D. & Burattini, C. Outdoor workers exposed to UV radiation: comparison of UV index forecasting
methods 1–6.
22. Sudhibrabha, S., Harold, R., Exell, B. & Sukawat, D. Ultraviolet forecasting in Thailand. ScienceAsia 32, 107–114 (2006).
23. Deo, R. C., Downs, N., Parisi, A. V., Adamowski, J. F. & Quilty, J. M. Very short-term reactive forecasting of the solar ultraviolet
index using an extreme learning machine integrated with the solar zenith angle. Environ. Res. 155, 141–166 (2017).
24. Feister, U., Laschewski, G. & Grewe, R.-D. UV index forecasts and measurements of health-effective radiation. J. Photochem.
Photobiol. B 102, 55–68 (2011).
25. Foyo-Moreno, I., Vida, J. & Alados-Arboledas, L. A simple all weather model to estimate ultraviolet solar radiation (290–385 nm).
J. Appl. Meteorol. 38, 1020–1026 (1998).
26. Qing, X. & Niu, Y. Hourly day-ahead solar irradiance prediction using weather forecasts by LSTM. Energy 148, 461–468 (2018).
27. Wang, F. et al. Wavelet decomposition and convolutional LSTM networks based improved deep learning model for solar irradiance
forecasting. Appl. Sci. 8(8), 1286 (2018).
28. Elminir, H. K., Own, H. S., Azzam, Y. A. & Riad, A. M. Testing the applicability of artificial intelligence techniques to the subject of
erythemal ultraviolet solar radiation. Part two: an intelligent system based on multi-classifier technique. J. Photochem. Photobiol.
B Biol. 90(3), 198–206 (2008).
29. Jacovides, C. P., Tymvios, F. S., Boland, J. & Tsitouri, M. Artificial neural network models for estimating daily solar global UV, PAR
and broadband radiant fluxes in an eastern Mediterranean site. Atmos. Res. 152, 138–145 (2015).
30. Siami-Namini, S., Namin, A. S. Forecasting Economics and Financial Time Series: ARIMA vs. LSTM. arXiv preprint arXiv: 1803.06386
(2018).
31. Elman, J. L. Finding structure in time. Cogn. Sci. 14(2), 179–211 (1990).
32. Hochreiter, S. & Schmidhuber, J. Long short-term memory. Neural Comput. 9(8), 1735–1780 (1997).
33. Cho, K., et al. Learning phrase representations using RNN encoder–decoder for statistical machine translation. arXiv preprint
arXiv :1406.1078 (2014).
34. Husein, M. & Chung, I.-Y. Day-ahead solar irradiance forecasting for microgrids using a long short-term memory recurrent neural
network: a deep learning approach. Energies 12, 1856–1856 (2019).
35. Gensler, A., Henze, J., Sick, B. & Raabe, N. Deep learning for solar power forecasting—an approach using AutoEncoder and LSTM
neural networks 002858–002865.
36. Huang, X. et al. Forecasting hourly solar irradiance using hybrid wavelet transformation and Elman model in smart grid. IEEE
Access 7, 139909–139923 (2019).
37. Buntoung, S. et al. An investigation of total solar ultraviolet radiation at Nakhon Pathom, Thailand. Proc. Eng. 32, 427–432 (2012).
38. Janjai, S., Buntung, S., Wattan, R. & Masiri, I. Mapping solar ultraviolet radiation from satellite data in a tropical environment.
Remote Sens. Environ. 114(3), 682–691 (2010).
39. Sutskever, I., Vinyals, O. & Le, Q. V. Sequence to sequence learning with neural networks. In Inproceedings3104–3112 (2014).
Scientific Reports | (2021) 11:5031 | https://doi.org/10.1038/s41598-021-84396-2 11
Vol.:(0123456789)www.nature.com/scientificreports/
40. Nast, A. et al. European S3-guideline on the systemic treatment of psoriasis vulgaris—update Apremilast and Secukinumab—EDF
in cooperation with EADV and IPC. J. Eur. Acad. Dermatol. Venereol. 31(12), 1951–1963 (2017).
41. Hersbach, H., Bell, B., Berrisford, P. et al. ERA5 Hourly Data on Single Levels from 1979 to Present. Copernicus Climate Change
Service (C3S) Climate Data Store (CDS) (Accessed on 30/12/2020) (2018).
42. Parrish, J. A. & Jaenicke, K. F. Action spectrum for phototherapy of psoriasis. J. Investig. Dermatol. 76(5), 359–362 (1981).
43. Fischer, T., Alsins, J. & Berne, B. Ultraviolet-action spectrum and evaluation of ultraviolet lamps for psoriasis healing. Int. J. Der-
matol. 23(10), 633–637 (1984).
44. Vinyals, O., Toshev, A., Bengio, S. & Erhan, D. Show and tell: a neural image caption generator. In Inproceedings 3156–3164 (2015).
45. Schuster, M. & Paliwal, K. K. Bidirectional recurrent neural networks. IEEE Trans. Signal Process. 45(11), 2673–2681 (1997).
46. Srivastava, N., Hinton, G., Krizhevsky, A., Sutskever, I. & Salakhutdinov, R. Dropout: a simple way to prevent neural networks
from overfitting. J. Mach. Learn. Res. 15(56), 1929–1958 (2014).
47. Savitzky, A. & Golay, M. J. E. Smoothing and differentiation of data by simplified least squares procedures. Anal. Chem. 36(8),
1627–1639 (1964).
48. Koenker, R. & Hallock, K. F. Quantile regression. J. Econ. Perspect. 15(4), 143–156 (2001).
49. Kingma, D. & Ba, J. Adam: a method for stochastic optimization. In International Conference on Learning Representations (2014).
Acknowledgements
This work was in part supported by the Royal College of Physicians of Thailand (to E.B.) and the Grant for Special
Task Force for Activating Research, Ratchadapisek Sompoch Endowment Fund, Chulalongkorn University (to
E.C. and S.S.). We would like to thank B. Chancheewa, MD. and A. Sriaram, B.Eng. (Photodermatology Unit,
Division of Dermatology, Department of Medicine, King Chulalongkorn Memorial Hospital, Bangkok, Thailand)
and T. Chalermsongsak, Ph.D. (Science Division, Mahidol University International College, Nakhon Pathom,
Thailand) for their expert supports.
Author contributions
R.R. and P.S. analyzed data and developed artificial neural network models. E.B. and J.P. evaluated the impact
of UV forecast on heliotherapy planning. P.L., S.B., and S.J. contributed UV data, weather data, and expertise in
surface UV radiation. E.B. and P.A. conceived the project and provided clinical expertise. S.S. and E.C. supervised
the research. All authors have contributed to the writing and approved of the final version of the manuscript.
Competing interests
The authors declare no competing interests.
Additional information
Supplementary Information The online version contains supplementary material available at https://doi.
org/10.1038/s41598-021-84396-2.
Correspondence and requests for materials should be addressed to S.S. or E.C.
Reprints and permissions information is available at www.nature.com/reprints.
Publisher’s note Springer Nature remains neutral with regard to jurisdictional claims in published maps and
institutional affiliations.
Open Access This article is licensed under a Creative Commons Attribution 4.0 International
License, which permits use, sharing, adaptation, distribution and reproduction in any medium or
format, as long as you give appropriate credit to the original author(s) and the source, provide a link to the
Creative Commons licence, and indicate if changes were made. The images or other third party material in this
article are included in the article’s Creative Commons licence, unless indicated otherwise in a credit line to the
material. If material is not included in the article’s Creative Commons licence and your intended use is not
permitted by statutory regulation or exceeds the permitted use, you will need to obtain permission directly from
the copyright holder. To view a copy of this licence, visit http://creativecommons.org/licenses/by/4.0/.
© The Author(s) 2021
Scientific Reports | (2021) 11:5031 | https://doi.org/10.1038/s41598-021-84396-2 12
Vol:.(1234567890)You can also read