A transcriptomic taxonomy of Drosophila circadian neurons around the clock
←
→
Page content transcription
If your browser does not render page correctly, please read the page content below
RESEARCH ARTICLE

                                       A transcriptomic taxonomy of Drosophila
                                       circadian neurons around the clock
                                       Dingbang Ma1†, Dariusz Przybylski1†, Katharine C Abruzzi1, Matthias Schlichting1,
                                       Qunlong Li1, Xi Long2, Michael Rosbash1*
                                       1
                                        Howard Hughes Medical Institute, Brandeis University, Waltham, United States;
                                       2
                                        Howard Hughes Medical Institute, Janelia Research Campus, Ashburn, United
                                       States

                                       Abstract Many different functions are regulated by circadian rhythms, including those
                                       orchestrated by discrete clock neurons within animal brains. To comprehensively characterize and
                                       assign cell identity to the 75 pairs of Drosophila circadian neurons, we optimized a single-cell RNA
                                       sequencing method and assayed clock neuron gene expression at different times of day. The data
                                       identify at least 17 clock neuron categories with striking spatial regulation of gene expression.
                                       Transcription factor regulation is prominent and likely contributes to the robust circadian oscillation
                                       of many transcripts, including those that encode cell-surface proteins previously shown to be
                                       important for cell recognition and synapse formation during development. The many other clock-
                                       regulated genes also constitute an important resource for future mechanistic and functional studies
                                       between clock neurons and/or for temporal signaling to circuits elsewhere in the fly brain.

*For correspondence:                   Introduction
rosbash@brandeis.edu                   Eukaryotic circadian clocks rely on a now well-defined transcription-translation feedback loop, which
†                                      generates roughly ~24 hr periodicity (Takahashi, 2017; Top and Young, 2018). Importantly, these
 These authors contributed
equally to this work                   circadian transcription factors (TFs) drive the oscillating expression of many thousands of tissue-spe-
                                       cific output genes, which regulate diverse aspects of physiology and behavior (Meireles-Filho et al.,
Competing interests: The               2014).
authors declare that no
                                           Circadian clocks tick away in many different mammalian tissues including the brain. The brain
competing interests exist.
                                       clock is most apparent – has very strong core clock gene expression – in a restricted region of the
Funding: See page 16                   anteroventral hypothalamus, the suprachiasmatic nucleus (SCN) (Reppert and Moore, 1991). There
Received: 13 September 2020            are approximately 10,000 neurons in each unilateral mice SCN. The comparable region in Drosophila
Accepted: 11 January 2021              contains about 75 clock neurons on each hemisphere of the fly brain. The SCN in mammals and
Published: 13 January 2021             these 75 pairs of neurons in flies orchestrate many circadian functions, including behaviors
                                       (Allada and Chung, 2010; Siepka et al., 2007).
Reviewing editor: Amita
                                           The fly brain clock neurons have been principally classified based on anatomy. There are lateral
Sehgal, Howard Hughes Medical
Institute, University of
                                       neurons and dorsal neurons. The lateral neurons are separated into three groups: ventral lateral neu-
Pennsylvania, United States            rons (nine LNvs), dorsal lateral neurons (six LNds), and lateral posterior neurons (three LPN). The
                                       LNvs are further subdivided into large and small LNvs based on size and location, four l-LNvs and
    Copyright Ma et al. This article
                                       five s-LNvs, respectively. The dorsal neurons constitute a much larger fraction of the 75 clock neu-
is distributed under the terms of
                                       rons and are also separated into four groups based on location: 15 DN1ps, 2 DN1as, 2 DN2s, and
the Creative Commons
Attribution License, which             35–40 DN3s (Shafer et al., 2006; Helfrich-Förster, 2004). Not surprisingly perhaps, these different
permits unrestricted use and           clock neuron groups are distinct by multiple criteria. For example, calcium and functional assays indi-
redistribution provided that the       cate that different clock neurons are active at different times during a 24-hr cycle (Liang et al.,
original author and source are         2016; Guo et al., 2017). Although microarray and RNA sequencing studies also indicate that differ-
credited.                              ent clock neuron groups express different sets of genes and transcripts (Abruzzi et al., 2017; Kula-

Ma, Przybylski, et al. eLife 2021;10:e63056. DOI: https://doi.org/10.7554/eLife.63056                                                  1 of 19
Research article                                                                 Chromosomes and Gene Expression Neuroscience

                                    Eversole et al., 2010; Nagoshi et al., 2010), the extent of gene expression heterogeneity is often
                                    underestimated by group sequencing.
                                       To comprehensively investigate clock neuron gene expression heterogeneity, we leveraged sin-
                                    gle-cell RNA sequencing to systematically characterize most Drosophila clock neurons – under light:
                                    dark (LD) and constant darkness (DD) conditions and ‘around the clock’. An unsupervised clustering
                                    method confidently identified 17 clock neuron classes. These clusters were successfully mapped
                                    based on both known and novel marker genes to cover most if not all functionally distinct clock sub-
                                    groups. Cell-type-specific enriched and oscillating transcripts were identified by differential gene
                                    expression. Strikingly, they include cell-surface molecules, previously shown to be important for cell
                                    recognition and synapse formation during development. We suggest that the circadian regulation of
                                    these specificity molecules orchestrate the temporal regulation of synapse formation and/or strength
                                    within the circadian network or between this network and other locations in the adult nervous sys-
                                    tem. Our study more generally establishes a foundation for neuron-specific mechanistic and func-
                                    tional studies within the fly brain circadian network.

                                    Results
                                    Single-cell RNA sequencing of Drosophila clock neurons around the
                                    clock
                                    To systematically study Drosophila clock neuron gene expression at the single-cell level, flies were
                                    entrained, either in a 12:12 LD cycle or in DD, and collected at six different times around the clock.
                                    (There were also two replicates for each condition and timepoint.) The clock neuron driver Clk856-
                                    GAL4 was used to express EGFP in most adult brain clock neurons (Gummadova et al., 2009),
                                    which were indeed GFP- and TIM (TIMELESS) -positive (Figure 1A). The number of TIM- and GFP-
                                    positive neurons were counted based on their anatomical distribution in each brain hemisphere
                                    (Figure 1B,C; numbers on top of the bar graph) and compared to the known number of cells in each
                                    clock neuron group in a single brain hemisphere (noted in x-axis labels, Figure 1C). Notably, most if
                                    not all neurons in every group were GFP-positive; the only exception was the DN3s with 30% GFP-
                                    positive neurons. Cell-specific knock-down of critical clock components with Clk856-GAL4 mimics
                                    the phenotypes of classic circadian mutant lines (Schlichting et al., 2019), consistent with the notion
                                    that the GFP-positive cells identify many functionally important clock neurons. There were also
                                    approximately seven ectopic GFP-positive cells in each hemisphere; they were TIM-negative by
                                    immunohistochemistry (Figure 1A–C).
                                        Since Clk856-GAL4 driving EGFP successfully identified most circadian neurons, we isolated them
                                    using fluorescence-activated cell sorting (FACS) and generated single-cell sequencing libraries using
                                    a method based on the CEL-Seq2 technique (Hashimshony et al., 2016). CEL-Seq2 is a ligation-free
                                    method, and in vitro amplification mitigates possible PCR bias. This approach detects more genes,
                                    especially weakly expressed genes, than many other methods (Mereu et al., 2020). We optimized
                                    this method for Drosophila clock neurons (Figure 1—figure supplement 1A) by using two rounds of
                                    in vitro transcriptions to amplify polyA RNA (Paul et al., 2017). Each cell was sequenced to a depth
                                    of about 0.5 million reads, and approximately 2300 cells from LD- and DD-entrained flies passed the
                                    stringent filtering criteria for a total of 4671 cells (Figure 1—figure supplement 1B). There were
                                    about 2600 genes detected per cell (mean) with an average of about eight UMIs (unique molecular
                                    identifiers; about 20,000 UMIs total). This indicates deep molecular characterization as only a few
                                    genes and UMIs were detected in empty wells (Figure 1—figure supplement 1C). We pooled the
                                    cells collected at different times of day based on the replicates and LD cycles to reconstruct pseudo-
                                    bulk samples. The Pearson correlation between the corresponding replicates demonstrates that the
                                    sequencing data are highly reproducible, and even the Pearson correlation between LD and DD is
                                    0.97, indicating highly similar gene expression between these two conditions (Figure 1—figure sup-
                                    plement 1D). This tight correlation likely emphasizes housekeeping transcripts as well as the averag-
                                    ing of the time point data.
                                        We next integrated together the cells collected in LD and DD conditions cross different times of
                                    day by unsupervised clustering with Seurat (Butler et al., 2018), which resulted in 39 distinct clusters
                                    (Figure 1D). Every cluster contains cells from all six time points and from both LD- and DD-entrained
                                    flies with only modest variability (Figure 1—figure supplement 1E,F). There is, however, much more

Ma, Przybylski, et al. eLife 2021;10:e63056. DOI: https://doi.org/10.7554/eLife.63056                                                2 of 19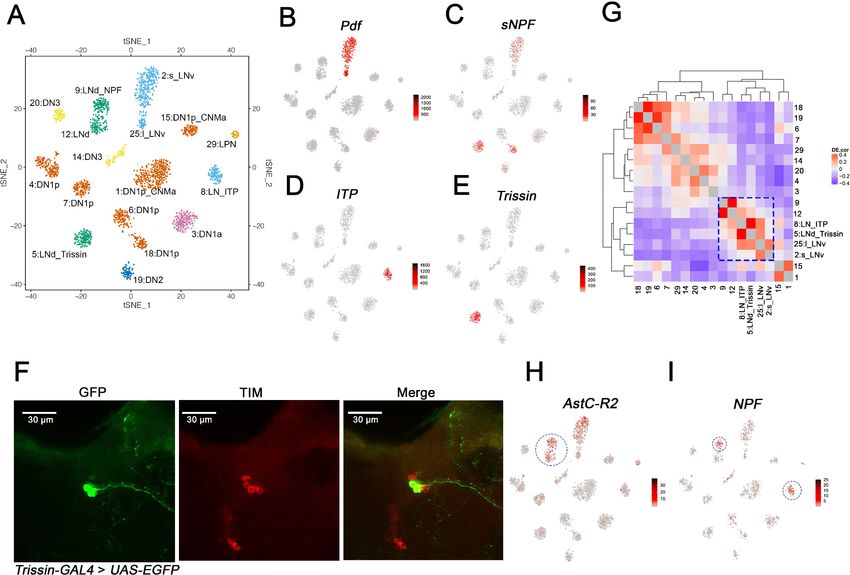
Research article Chromosomes and Gene Expression Neuroscience
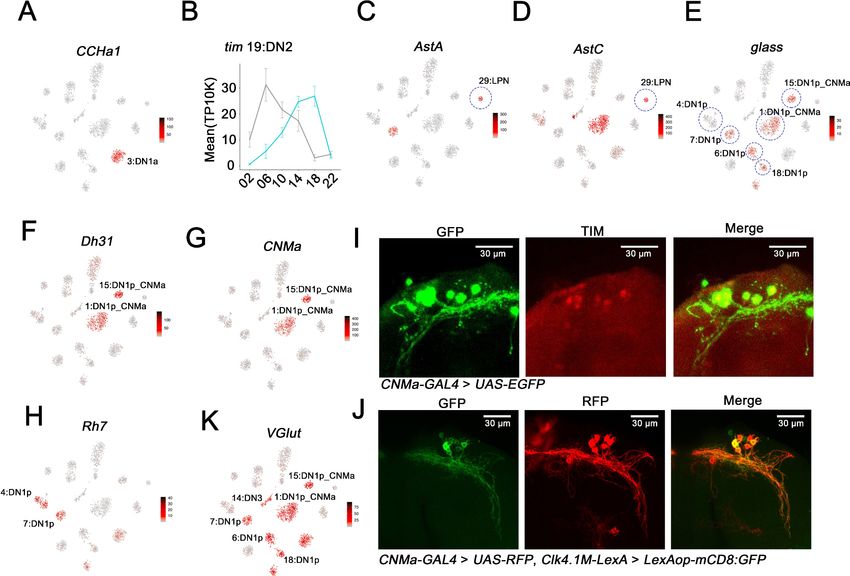
Figure 1. Single-cell RNA sequencing of Drosophila clock neurons around the clock. (A) Confocal stack images of immunostained brains from Clk856-
GAL4 > UAS-Stinger-GFP flies at ZT18. Anti-GFP (left), anti-TIM (middle) and a merge of these two images (right). The arrow indicates the DN3 neurons.
(B) Schematic depiction of clock neurons in an adult Drosophila brain. The core clock network consists of about 150 lateral and dorsal neurons, they are
subdivided into different groups based on anatomy. (C) Quantification of the neurons labeled by Clk856-GAL4 as shown in (A). The number on top of
the bars represent the number neurons that were observed to be GFP- and TIM-positive (clock neuron subgroups) or just GFP-positive (ectopic
neurons). The numbers indicated in the x-axis labels reflect the number of each type of neuron that is found in one hemisphere of an adult fly brain.
Nearly, all neurons in the clock network are labeled by the Clk856-GAL4 driver with the exception of some of the DN3s. (D) Visualization of Drosophila
clock neuron clusters on the t-Distributed stochastic neighbor embedding (t-SNE) plot. Each dot represents a cell and they are color-coded by major
anatomy groups. Thirty-nine different clusters were found. Clustering contains all cells: both light:dark (LD) and constant darkness (DD) conditions at all
timepoints. (E) Each neuron cluster is defined by a set of highly differentially expressed genes. The heatmap showing the expression levels of the top
differentially expressed genes (rows) in cells (columns). Clusters are ordered by size: cluster 0 on the left and cluster 38 on the right. Expression is
indicated by Z score of ln (TP10K+1); red indicates high expression and blue indicates low expression.
The online version of this article includes the following figure supplement(s) for figure 1:
Figure supplement 1. Methods and verification of single-cell RNA sequencing of Drosophila clock neurons.
variability in the number of cells per cluster, and they are numbered based on the number of cells
they include: 0 has the most cells, 38 the least (Figure 1—figure supplement 1G). Nonetheless,
there are similar numbers of genes and UMIs per cell in each cluster (Figure 1—figure supplement
Ma, Przybylski, et al. eLife 2021;10:e63056. DOI: https://doi.org/10.7554/eLife.63056 3 of 19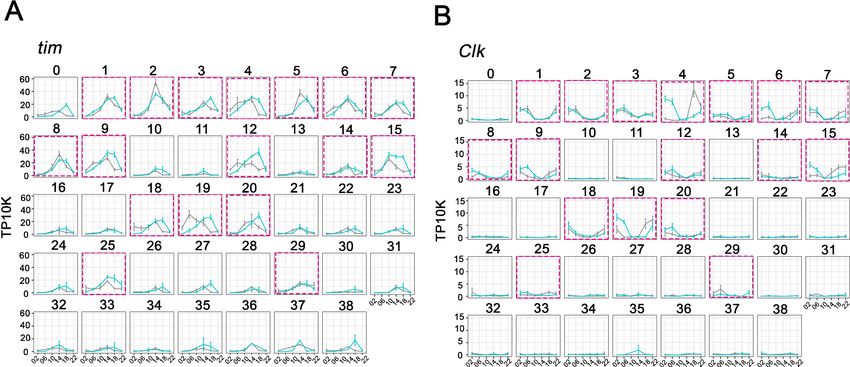
Research article                                                                           Chromosomes and Gene Expression Neuroscience

                                     1H). Moreover, every cluster except cluster 0 shows a unique marker gene expression profile, sup-
                                     porting the validity of even the smallest clusters (Figure 1E).

                                     Identifying the key circadian neuron clusters based on core clock gene
                                     expression
                                     To identify clusters most likely to correspond to the well-characterized clock neuron groups, we
                                     compared tim as well as Clk expression between the 39 clusters. As expected, tim mRNA is cycling
                                     with a gene expression peak at ZT14-ZT18 in most if not all clusters (Figure 2A). The data for vri
                                     mRNA is similar (Figure 2—figure supplement 1). There is, however, a marked difference in the tim
                                     and vri expression levels per cell among the different clusters. Despite a few exceptional clusters,
                                     those with more cells generally show considerably higher clock gene expression per cell (Figure 2A,
                                     Figure 2—figure supplement 1). Clk expression at its usual LD peak time of ZT2 is similarly higher
                                     in almost all of these same clusters (Figure 2B). Based on the notion that higher levels of Clk and
                                     CLK-CYC direct target genes may identify bona fide circadian clock neurons and to focus on a
                                     smaller number of clusters, we chose 17 for analysis in more detail (Figure 2; purple boxes). They
                                     retain their numbers from their position in the original 39 clusters, and many of their names carry
                                     additional labels (Figure 3A) to reflect the information described below.

                                     Identification of the lateral neuron clusters: LNvs and LNds
                                     To identify lateral neuron clusters, we first addressed the expression of the famous circadian neuro-
                                     peptide gene Pdf. It is expressed in just eight clock cells and two cell types, the four large and four
                                     small LNvs on each side of the brain; they are classically referred to as l-LNvs and s-LNvs, respec-
                                     tively (Helfrich-Forster, 1995). Pdf is expressed in only two clusters, 2 and 25 (Figure 3B); cluster 2
                                     but not cluster 25 also expresses substantial levels of sNPF mRNA (Figure 3C). As sNPF is expressed
                                     in s-LNvs but not l-LNvs (Johard et al., 2009), these data suggest that cluster 2 identifies s-LNvs and

Figure 2. Cycling timeless (tim) expression and Clock (Clk) abundance defines key circadian neuron clusters. (A–B) The mean tim expression (A) and Clk
(B) throughout the day in light: dark (LD) and constant darkness (DD) conditions is graphed for each cluster. Seventeen clusters were chosen as high
confidence clusters based on robust core clock genes expression (purple boxes). X axis indicates the time points in LD and DD. Error bars represent
mean ± SEM. Cyan and gray lines indicate the gene expression in LD and DD conditions, respectively.
The online version of this article includes the following figure supplement(s) for figure 2:
Figure supplement 1. Cycling vrille (vri) expression helps to define key circadian neuron clusters.

Ma, Przybylski, et al. eLife 2021;10:e63056. DOI: https://doi.org/10.7554/eLife.63056                                                          4 of 19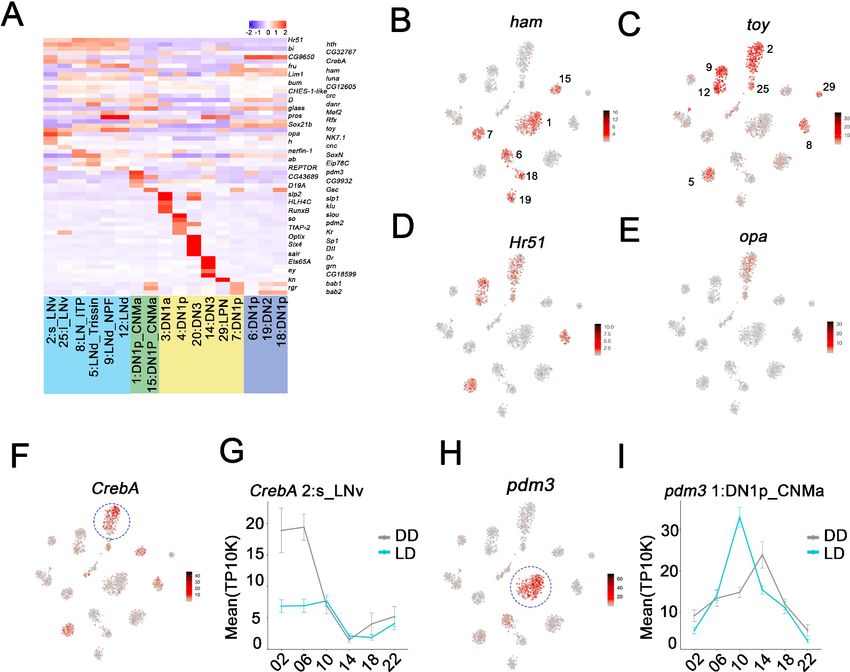
Research article                                                                         Chromosomes and Gene Expression Neuroscience

Figure 3. Identification of the lateral neuron clusters: LNvs and LNds. (A) Seventeen Drosophila clock neuron clusters. t-SNE visualization of 2615 clock
neurons from both light:dark (LD) and constant darkness (DD). Each cluster retains its original identifying number (as in Figure 1D), and the anatomical
cluster to which it was assigned is added to its name. The clusters are colored by their major anatomy groups. (B–E) t-SNE plots showing key lateral
neuron marker genes expression: Pdf (B), sNPF (C), ITP (D) and Trissin (E). Red indicates higher expression (color bar, TP10K), LD and DD data are
plotted together. (F) Confocal stack images from Trissin-GAL4 > UAS-EGFP adult fly brains stained with GFP and TIM antibodies. GFP (left), TIM
(middle), and a merge of these two images (right). Only two neurons in the clock network were identified using the Trissin-GAL4 knock-in line. (G) Gene
expression correlation of the identified clock neuron clusters. (H–I) t-SNE plots showing key lateral neuron marker genes expression: AstC-R2 (H) and
NPF (I). Red indicates higher expression (color bar, TP10K). AstC-R2 expression is from LD and DD together, NPF expression is from LD condition only.
The online version of this article includes the following figure supplement(s) for figure 3:
Figure supplement 1. Identification of two Trissin-expressiong LNd neurons.

                                     cluster 25 identifies l-LNvs. The s-LNv cluster 2 has many more cells than the l-LNv cluster 25 despite
                                     the fact that each fly brain has the same number of s-LNvs and l-LNvs (see Discussion).
                                         To address the remaining seven lateral neurons, the six LNds and the (PDF-negative) fifth s-LNv,
                                     we focused on neuropeptides known to be expressed in these neurons. One LNd and the fifth s-LNv
                                     express ion transport peptide (ITP) (Johard et al., 2009; Schubert et al., 2018). As ITP mRNA iden-
                                     tifies only a single cluster, #8 (Figure 3D), we named it LN_ITP and suggest that it contains these
                                     two cells, the fifth s-LNv and this single LNd. A single cluster implies that the transcript composition
                                     of these two neurons is very similar, consistent with their indistinguishable functional and connectiv-
                                     ity properties (Yao and Shafer, 2014).
                                         The neuropeptide sNPF is expressed in two LNd cells in addition to the s-LNvs (Johard et al.,
                                     2009), and this transcript is well-expressed in clusters 5 and 18 as well as in the s-LNv cluster 2 as
                                     described above (Figure 3C). Cluster 18 is identified as a dorsal neuron cluster (see below). Cluster

Ma, Przybylski, et al. eLife 2021;10:e63056. DOI: https://doi.org/10.7554/eLife.63056                                                             5 of 19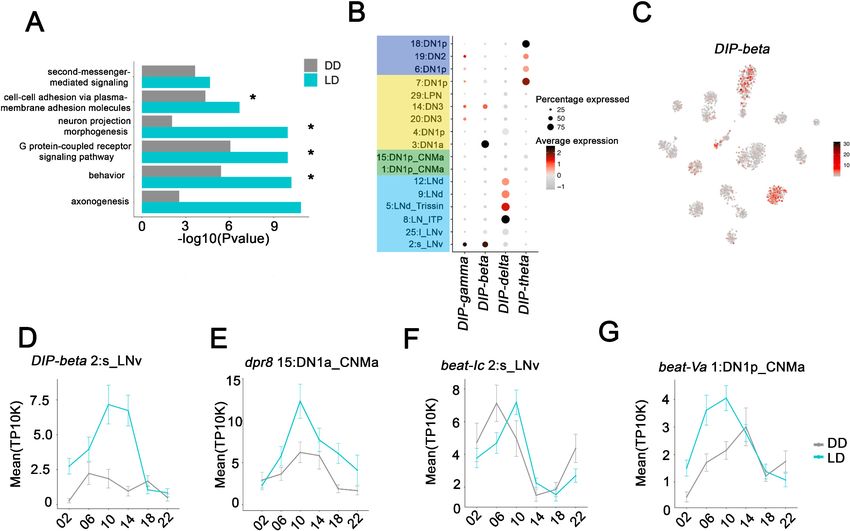
Research article                                                                 Chromosomes and Gene Expression Neuroscience

                                    5 has prominent expression of another neuropeptide, Trissin (Figure 3E). A chemoconnectome Tris-
                                    sin endogenous GAL4 knock-in line (Deng et al., 2019) resulted in expression in two LNds
                                    (Figure 3F), and an intersectional assay combining Trissin-LexA with Clk856-GAL4 also expressed
                                    only in these two LNds (Figure 3—figure supplement 1). In both these experiments, the TIM immu-
                                    nostaining signal co-localized with GFP and further confirmed that these neurons are LNds
                                    (Figure 3F, Figure 3—figure supplement 1). Based on these data, we named this two-cell cluster 5:
                                    LNd_Trissin.
                                        To identify the remaining three LNds, we examined gene expression similarity to find clusters
                                    most similar to the two previously defined lateral neuron clusters, LN_ITP and LNd_Trissin. These are
                                    clusters 9 and 12 (Figure 3G; blue box). The transcript encoding the AstC receptor, AstC-R2 mRNA
                                    is well-expressed in these two clusters (Figure 3H) and in LNds based on previous RNA sequencing
                                    and physiology experiments (Abruzzi et al., 2017; Dı́az et al., 2019). Because NPF is also expressed
                                    in two LNds that are AstC-R2 positive (Lee et al., 2006), this explains the presence of NPF in cluster
                                    9, which must contain these two cells. We noticed NPF is upregulated in most of the clusters in DD,
                                    for cluster classification, NPF expression in LD condition is shown in Figure 3I. By elimination, cluster
                                    12 must contain the remaining single LNd. Therefore, we have named these two clusters 9:
                                    LNd_NPF and 12: LNd.

                                    Identifying the dorsal and LPN clock neurons
                                    Dorsal clock neurons (DNs) constitute the majority of Drosophila clock neurons, but their organiza-
                                    tion and function—how many different cell types there are and what they do—are far from certain.
                                    There are, however, some small DN subgroups about which more is known (Shafer et al., 2006).
                                        The two DN1a neurons are the only source of CCHa1 in the fly clock system (Fujiwara et al.,
                                    2018), and immunohistochemistry of a chemoconnectome CCHa1 line indicates that this gene is
                                    indeed expressed in only two clock neurons at the expected location for DN1as (Figure 4—figure
                                    supplement 1A). As only cluster 3 expresses high levels of CCHa1, we assigned the two DN1as to
                                    this cluster (Figure 4A). For DN2 neuron assignment, we took advantage of the fact that DN2
                                    molecular oscillations are in anti-phase with the rest of the clock neuron population in DD
                                    (Kaneko et al., 1997). Remarkably, only cluster 19 shows unambiguous anti-phasic DD cycling for a
                                    number of core clock genes including tim (Figure 2 and Figure 4B) and vri (Figure 2—figure sup-
                                    plement 1), justifying the assignment of the DN2s to cluster 19. The three LPNs are the only clock
                                    neuron group with both AstC and AstA expression (Dı́az et al., 2019; Ni et al., 2019); only the small
                                    cluster 29 meets this criterion (Figure 4C,D).
                                        A number of criteria were used to identify the 15 DN1p neurons and their surprising assignment
                                    to six different clusters. First, the glass (gl)-encoded TF is expressed in and necessary for the devel-
                                    opment of most DN1ps (Helfrich-Förster et al., 2001; Shafer et al., 2006). Five novel clusters (1, 6,
                                    7, 15, and 18) express the gl transcript, suggesting that they contain DN1ps (Figure 4E; five of the
                                    six circles). Cluster 18 is sNPF enriched as shown above (Figure 3C). Second, two of these five clus-
                                    ters, clusters 1 and 15, express the transcript encoding the neuropeptide Dh31 (Figure 4F). Previous
                                    results indicate that Dh31 is expressed in some DN1ps, and loss- and gain-of-function studies of
                                    Dh31 indicate that its expression within this set of clock neurons regulates fly sleep (Kunst et al.,
                                    2014; Goda et al., 2016). Third, these same two clusters also express the transcript encoding the
                                    neuropeptide CNMa (Figure 4G). To verify the assignment of these two CNMa clusters, we used a
                                    chemoconnectome knock-in CNMa-GAL4 to drive EGFP for immunohistochemistry. The only TIM-
                                    positive EGFP-positive neurons were in the position of DN1ps (Figure 4I). These six to eight EGFP-
                                    positive dorsal cells overlapped well with the well-known DN1p Clk4.1 driver (Clk4.1M-LexA), indi-
                                    cating that these two DN1p clusters contain about half the DN1ps (Figure 4J). Fourth, expression of
                                    the neuropeptide gene AstC mRNA identified only a single DN1p cluster, the larger Dh31-positive
                                    and CNMa-positive cluster 1 (Figure 4D), an assignment that is consistent with recent work indicat-
                                    ing that AstC is expressed in a subset of DN1ps (Dı́az et al., 2019).
                                        Lastly, Rh7 expression identified an additional 6th DN1p cluster, cluster 4 (Figure 4E,H). Rh7
                                    mRNA is present in this cluster as well as three others: the DN1as, DN2s, and the gl-positive DN1p
                                    cluster 7 (Figure 4H). This assignment of cluster 4 to the DN1ps is despite the lack of robust gl
                                    expression and based in part on previous characterization of a Rh7 mimic line. It indicated that Rh7
                                    may be only expressed in four to five DN1ps as well as the two DN1as (Kistenpfennig et al., 2017).

Ma, Przybylski, et al. eLife 2021;10:e63056. DOI: https://doi.org/10.7554/eLife.63056                                                 6 of 19
Research article Chromosomes and Gene Expression Neuroscience
Figure 4. Mapping the dorsal and lateral posterior neuron (LPN) clock neurons. (A) t-SNE plots showing CCHa1 expression. Red indicates higher
expression (color bar, TP10K). Light:dark (LD) and constant darkness (DD) data are plotted together. CCHa1 expression is specific to cluster 3 and thus
identifies the DN1a neurons. (B) tim expression in cluster 19 in LD and DD conditions. The phase of tim cycling shifts in DD to be approximately
antiphase to LD cycling. DN2s assigned to Cluster 19. Error bars represent mean ± SEM. Cyan and gray lines indicate the gene expression in LD and
DD conditions, respectively. (C–D) t-SNE plot showing AstA (C) and AstC (D) expression. Red indicates higher expression (color bar, TP10K). LD and DD
data are plotted together. The LPN cluster is highlighted by the blue circle. (E–H) t-SNE plot showing glass (E), Dh31 (F), CNMa (G), and Rh7 (H)
expression. Red indicates higher expression (color bar, TP10K); LD and DD data are plotted together. The identified DN1p neuron clusters are
highlighted by blue circles showing in (E). (I) Confocal stack of images showing antibody staining for GFP (left) and TIM (middle) and the merge (right)
in the dorsal brain of CNMa-GAL4 > UAS-EGFP flies. (J) Confocal stack of images showing antibody staining for GFP (left) and RFP (middle) and the
merge (right) in the dorsal brain of Clk4.1M-LexA > LexAop-mCD8: GFP; CNMa-GAL4 > UAS-RFP flies. (K) t-SNE plot showing VGlut expression. Red
indicates higher expression (color bar, TP10K), LD and DD data are plotted together.
The online version of this article includes the following figure supplement(s) for figure 4:
Figure supplement 1. Mapping the dorsal clock neurons.
To further assess Rh7 expression, we generated a split-GAL4 line using regulatory regions of per
and Rh7; functional GAL4 should only be expressed in clock cells that also express Rh7. Consistent
with the Rh7 mRNA expression pattern in the clusters, this assay also indicated Rh7 expression in
two DN1ps and the DN2 neurons (Figure 4—figure supplement 1B).
The glutamate vesicular transporter mRNA VGlut is enriched in most dorsal neuron clusters
(Figure 4K). Consistent with this conclusion is a split-GAL4 assay with Pdfr and VGlut regulatory
regions: it indicates that most DN1ps express VGlut (Figure 4—figure supplement 1C); the RNA
profiling indicates that only a single DN1p cluster—the gl-negative Rh7-positive cluster 4—is an
exception. These data are also consistent with prior studies indicating that some dorsal neurons are
Ma, Przybylski, et al. eLife 2021;10:e63056. DOI: https://doi.org/10.7554/eLife.63056 7 of 19Research article Chromosomes and Gene Expression Neuroscience
VGlut-positive, and glutamate expression is relevant to sleep-wake behavior (Guo et al., 2016;
Guo et al., 2017; Hamasaka et al., 2007). In summary, six DN1p clusters were identified by the
known and newly identified markers (Figure 4—figure supplement 1D).
The two final clusters, 14 and 20, are missing almost all marker genes identified in the better char-
acterized clock neurons and were therefore assigned to the enigmatic DN3 population. The one
exception is VGlut. It is expressed in Cluster 14, and previous studies have shown that some DN3s
are glutamatergic (Hamasaka et al., 2007). Gene expression correlation analysis indicates that clus-
ter 20 is similar to cluster 14 (Figure 3G), so we also assigned this last cluster to the DN3s.
Enriched and cycling transcripts in the clock neuron clusters
To further characterize the gene expression profiles of these clock neuron clusters, we first
addressed differential (enriched) gene expression. Each cluster shows a unique combination of
marker gene expression (Figure 5—figure supplement 1A,B, Source data 1). Notably, TFs are
prominently expressed in the clock clusters and extend well beyond the known clock gene TFs,
for example Figure 2. Interestingly, some TF mRNAs are enriched in all clusters from a particular
anatomical neuron group (Figure 5A). For example, ham, D as well as gl transcripts are enriched in
most DN1p clusters (e.g. ham Figure 5B). Most striking is the cluster-specific TF expression in the
DNs and LPNs (labeled in yellow). Each cluster has at least one TF mRNA enriched relative to the
rest of the circadian network (Figure 5A, Figure 5—figure supplement 1C). For example, cluster 4
DN1s show strong expression of transcripts encoding slou and so and the TF mRNAs hth, bi, toy,
and Hr51 are enriched in all lateral neurons (e.g. toy and Hr51; Figure 5C,D). opa mRNA is specifi-
cally enriched in the LNvs (Figure 5E).
Interestingly, CrebA mRNA is highly expressed in only some s-LNv cluster cells (Figure 5F; circle),
due to robust oscillations under both LD and DD conditions (Figure 5G). For unknown reasons, the
amplitude of CrebA expression is more robust in DD than in LD. pdm3 mRNA oscillates in the
DN1p_CNMa cluster 1 with peak expression at midday (Figure 5H,I).
To address cycling gene expression more generally, we examined the entire single-cell RNA
sequencing dataset for oscillating transcripts (cycling RNAs or cyclers) under both LD and DD condi-
tions. The following cycling cutoffs were used: a JTK cycle Benjamini-Hochberg corrected q-value of
less than 0.05, a F24 score of greater than 0.5, and a cycling amplitude (maximum expression
divided by minimum expression) of at least 1.5-fold, and a maximal expression of at least 0.8 TP10K.
Although these conservative criteria were used to mitigate against false positive (see Materials and
methods), ~24% of all transcripts identified in the 17 clock neuron clusters (1320/5517) undergo
time-of-day oscillations in at least one cluster (Figure 6—figure supplement 1A). Notably, even
under the more cycling-permissive LD conditions, 74% of the LD cycling transcripts are found in only
one or two clusters. This specificity may be due in part to the difficulty in identifying cyclers from the
smaller clusters (see Discussion). However, even the two largest clusters (Clusters 1:DN1p_CNMa
and 2_sLNv) have only ~30% overlap. In contrast, the core clock gene transcripts are identified as
cyclers in most of the 17 clusters in LD (Clk (11), tim (17), vri (12), and Pdp1 (13)). Several other tran-
scripts also cycle in multiple clusters including the mRNA-binding protein fne, the arginine kinase
ArgK, and the unknown transcript CG15628 (Figure 6—figure supplement 1B and
Supplementary file 1).
To address possible functions of the clock neurons cycling program, we first performed
gene ontology (GO) term analysis on LD cyclers from the individual clusters (Supplementary file 2).
This analysis was more informative for the larger clusters, as they had more cyclers than the smaller
clusters. Although there are also significant GO terms shared between cyclers from different clusters
such as behavior, neuron projection morphogenesis and G-protein-coupled signaling pathways,
many of the GO terms indicate that cycling transcripts contribute to different processes in the differ-
ent clusters. For example, the DN1p_CNMa cyclers (cluster 1) are enriched for chemical synaptic
transmission (0.008), whereas the s-LNv cyclers (cluster 2) are enriched for cation membrane trans-
port (2.1E-7).
We also performed GO term analysis on all cycling transcripts identified in any of the 17 clusters
(Supplementary file 3). In addition to the GO terms identified in multiple individual clusters
(Figure 6A, Asterix), several new GO terms emerged from the combined cyclers; they included sec-
ond messenger-mediated signaling, cell-cell adhesion via plasma membrane adhesion molecules
and axonogenesis (Figure 6A). These new functions required the pooling of cycling transcripts
Ma, Przybylski, et al. eLife 2021;10:e63056. DOI: https://doi.org/10.7554/eLife.63056 8 of 19Research article Chromosomes and Gene Expression Neuroscience
Figure 5. Enriched transcripts in identified clock neuron clusters. (A) Heatmap showing the enriched transcription factors expression in each cluster. (B–
E) t-SNE plot showing ham (B), toy (C), Hr51 (D), and opa (E) expression in clock neurons. Red indicates higher expression (color bar, TP10K). (F) t-SNE
plot showing CrebA expression in clock neurons. Red indicates higher expression (color bar, TP10K). (G) Mean CrebA expression in 2:s_LNv neurons
throughout the day in light:dark (LD) and constant darkness (DD) conditions. Error bars represent mean ± SEM. Cyan and gray lines indicate the gene
expression in LD and DD conditions, respectively. (H) t-SNE plot showing pdm3 expression in clock neurons. Red indicates higher expression (color bar,
TP10K). (I) Mean pdm3 expression in 1:DN1p_CNMa neurons at different times in LD and DD conditions. Error bars represent mean ± SEM. Cyan and
gray lines indicate the gene expression in LD and DD conditions, respectively.
The online version of this article includes the following figure supplement(s) for figure 5:
Figure supplement 1. Enriched transcripts in identified clock neuron clusters.
because each clock neuron cluster only contains one or two cycling transcripts from these large
gene families. This small number is insufficient to identify the function from individual clusters. To try
to learn a bit more about the importance of these GO terms relative to time of day, we examined
whether these GO terms were specific to cyclers peaking in the day or night (Supplementary file 3).
Interestingly, in LD, G-protein-coupled receptor signaling was identified as a GO term only for
cycling transcripts that peak at night. In contrast neuron-projection morphogenesis was identified as
a GO term only for cycling transcripts peaking during the day.
Two prominent examples of the axonogenesis category are the DIP (Dpr interacting proteins; 11
genes) and Dpr (Defective proboscis extension response; 21 genes) families. A DIP protein on the
surface of a neuron has affinity for partner Dpr proteins, which together help drive synapse specific-
ity during development (Cosmanescu et al., 2018). Four of 11 DIP transcripts are specifically
enriched and undergo LD cycling in specific clock neuron clusters (Figure 6B). Similarly, 10 of 21 Dpr
transcripts are enriched and undergo LD cycling in specific clusters (Figure 6—figure supplement
1C). Intriguingly, DIP-beta mRNA is enriched and cycles strongly in s-LNvs (Figure 6C,D), whereas a
Dpr8 transcript encodes one of its partner proteins and cycles with a similar phase in DN1ps
(Figure 6E). Perhaps, cycling gene expression regulation of DIP-beta and Dpr8 contribute to the cir-
cadian regulation of the known interaction between s-LNvs and DN1ps. Circadian regulation of an
Ma, Przybylski, et al. eLife 2021;10:e63056. DOI: https://doi.org/10.7554/eLife.63056 9 of 19Research article Chromosomes and Gene Expression Neuroscience
Figure 6. Neuron-specific cycling gene expression. (A) Gene ontology (GO) analysis of the all the cycling genes found in all the clock neuron clusters.
GO terms that were also identified in cluster-specific GO term analysis are indicated by asterisks. (B) Dot plot showing the Dpr interacting protein (DIP)
family gene expression in clock neuron clusters. Size of dot indicates what percentage of cells in a particular cluster that express the indicated DIP-
family member. Color indicates the mean expression within that cluster. (C) t-SNE plot showing DIP-beta expression in clock neurons. Red indicates
higher expression (color bar, TP10K). (D–G) Mean cell-cell adhesion gene expression throughout the day in different neuron clusters. DIP-beta
expression in 2:s_LNv (D), dpr8 expression in 15:DN1p_CNMa (E), beat-Ic expression in 2:s_LNv (F) and beat-Va expression in 1:DN1p_CNMa (G). Error
bars represent mean ± SEM. Average gene expression shown in constant darkness (DD) (gray) and light:dark (LD; cyan).
The online version of this article includes the following figure supplement(s) for figure 6:
Figure supplement 1. Oscillating transcripts in Drosophila clock neurons.
interaction between s-LNv termini and a target like DN1ps was the original suggestion for the func-
tion of s-LNv morphological cycling (Fernández et al., 2008; Petsakou et al., 2015).
Beat transcripts encode another Ig superfamily of molecules, which are involved in axonogenesis
(Pipes et al., 2001) and show impressive cluster-specific enrichment and cycling (Figure 6F,G). We
speculate that all three classes of cell surface molecules help temporally coordinate synaptic con-
tacts, principles that function broadly within the circadian circuit and even elsewhere within the brain
to superimpose time-of-day control on synaptic strength if not choice (Guo et al., 2018).
Discussion
Drosophila adult brain clock neurons are known to be heterogeneous, based principally on their
anatomy, immunohistochemistry, and functional characterization (Top and Young, 2018;
Tataroglu and Emery, 2015; Peschel and Helfrich-Förster, 2011). To extend this characterization,
we optimized a single-cell RNA sequencing protocol and applied it to most of the clock network,
Ma, Przybylski, et al. eLife 2021;10:e63056. DOI: https://doi.org/10.7554/eLife.63056 10 of 19Research article Chromosomes and Gene Expression Neuroscience
about 45 of the 75 neurons on each side of the brain. Only the numerous and poorly characterized
DN3 clock neurons were mostly missing from the 45 assayed neurons.
We suspect that the identification of the 17 clock clusters reflects gene expression heterogeneity
revealed by our modified CEL-Seq2 method. A large number of genes and UMIs resulted, which
probably allowed for a more thorough definition of clock neuron cell type. The only fly brain neuron
studies with similar sequencing depth per cell also reported comparable molecular heterogeneity
(Li et al., 2020; Li et al., 2017).
The initial unsupervised clustering results were surprising. Assuming the immunostaining revealed
all GFP-positive neurons (Figure 1A), the 39 clusters indicates about 1–2 cells/cluster from each side
of the brain at about 8X coverage for each cell at each time point (Figure 1D). One possibility is that
many of the small clusters are DN3 neurons that were inefficiently recovered during FACS sorting,
due perhaps to lower Clk expression (Figure 2B).
The 17 final clock neuron groups contain a somewhat larger number of cells per cluster, about
two to three, many of which are well-defined by immunohistochemistry and contain the predicted
number of cells. They include for example the two DN1as, two LNd_Trissin cells, two DN2s, and
the four s-LNvs. There are, however, clusters that contain too few cells, most notably the l-LNvs and
the LPNs; they should contain four and three cells, respectively. As the correct cell numbers of
l-LNvs and LPNs are easily visible by GFP-staining of Clk856-GAL4 > UAS-Stinger-GFP brains, many
of these neurons are probably poorly recovered or perhaps incorrectly assigned.
The clustering and analysis clarified several clock neuron identity issues for the LNds and the
DN1ps. There is only one ITP-expressing cluster, which must contain the ITP-positive LNd as well as
the fifth s-LNv. Their indistinguishable gene expression profiles fit nicely with recent neuroanatomical
studies suggesting that they have nearly identical properties; they innervate the same brain areas
with similar pre- and postsynaptic sites, and they both drive evening activity (Schubert et al., 2018;
Hermann-Luibl et al., 2014). Most surprising perhaps was the division of the DN1ps into six clusters.
Two of these express the recently characterized rhodopsin gene Rh7, and two others the neuropep-
tides CNMa and Dh31. All the CNMa cells reside close together in the dorsal brain and are spatially
distinct from the rest of the DN1p population, yet they are still divided into two clusters based on
this molecular profiling. Two recently identified sleep-promoting DN1p groups show novel projec-
tion patterns and should be relevant (Guo et al., 2018; Guo et al., 2016), but we do not know which
DN1p clusters they define.
The clustering results reveal remarkable heterogeneity of clock neuron gene expression. None-
theless, additional post-transcriptional regulation might also be important for neuronal function.
There are few examples where the single-cell sequencing results are inconsistent with functional
results. For instance, AstC-R2 is reported to be expressed in only one LNd (Dı́az et al., 2019), yet its
mRNA is expressed in both clusters 9 and 12. We speculate that this transcript (as well as others)
may undergo post-transcriptional regulation that further refines protein expression within the clock
neuron network.
There is abundant circadian regulation of mRNA cycling in the 17 clock neuron clusters. It is there-
fore surprising that the canonical property of clock gene cycling is not present in all of them. How-
ever, vri and tim mRNA cycle in all 17 clusters by eye (also see Figure 2), suggesting that the lack of
universal clock gene cycling reflects some data variability combined with the conservative computa-
tional criteria used to define cycling. In contrast and with only a few exceptions, most non-clock
gene mRNA cycling remains highly neuron-specific by eye as well as by computation. Moreover,
24% of detected transcripts displayed rhythmic expression in only one or a small number of clusters.
Although this could be influenced by the difficulty in identifying cyclers within the smaller clusters,
the overlap of cycling transcripts is limited even between the larger clusters.
Although so much neuron-specific cycling in these 17 clusters of clock neurons might seem sur-
prising, our previous bulk sequencing study of three categories of clock neurons (PDF cells, LNds,
and DN1s) came to a similar conclusion (Abruzzi et al., 2017). The large percentage probably
reflects some specific temporal as well as spatial gene expression regulation occurring within clock
neurons. However, this neuron-specific control recapitulates lessons learned from mammals as well
as from flies about the circadian regulation of gene expression: this regulation is highly cell- and tis-
sue-specific with only the exception of core clock genes and a handful of others. In this context of
cell type and tissue, it is interesting that the mammalian brain has the lowest number of tissue-spe-
cific cycling transcripts (Zhang et al., 2014). Perhaps, this is because the brain has the greatest
Ma, Przybylski, et al. eLife 2021;10:e63056. DOI: https://doi.org/10.7554/eLife.63056 11 of 19Research article Chromosomes and Gene Expression Neuroscience
number of constituent cell types. Without assaying separately these cells, cell-specific cycling is invis-
ible when assaying the complete tissue/organ. In this context, most of the cycling mRNAs identified
in this study were not detected as cycling in fly head or brain mRNA (Hughes et al., 2012).
While this work was in progress, we became aware of a single-cell RNA sequencing study of the
mouse SCN, the mammalian equivalent of the 150 fly clock neurons (Wen et al., 2020). Although
only five neuronal subtypes were identified, this number is consistent with previous characterizations
of SCN neuronal heterogeneity (Welsh et al., 2010). It is also possible that this heterogeneity is
underestimated due to the lower sequencing depth afforded by droplet-based methods
(Wen et al., 2020). We suspect that high-throughput commercial sequencing methods similarly
underestimate neuronal heterogeneity because of limited sequencing depth. For example, they only
identified 29 and 87 initial clusters in larval and adult Drosophila brains (Davie et al., 2018;
Brunet Avalos et al., 2019).
In summary, this work reveals a surprising extent of fly brain clock neuron heterogeneity and pro-
vides a resource for future functional and mechanistic circadian studies. Although some of these fea-
tures may be limited to the clock system, we suspect that neuronal heterogeneity will be more
generally characteristic of fly brain circuits. This heterogeneity also helps explain why Drosophila has
such a sophisticated behavioral repertoire despite a brain of only 100,000 neurons and suggests that
many drivers that express in one or only a few neurons are likely to have substantial behavioral
impact.
Materials and methods
Key resources table
Reagent type
(species) or
resource Designation Source or reference Identifiers Additional information
Genetic reagent UAS-Stinger BDSC RRID:BDSC_84277
(D.
melanogaster)
Genetic reagent R14F03-p65.AD BDSC RRID:BDSC_70551
(D.
melanogaster)
Genetic reagent VT029514-GAL4. BDSC RRID:BDSC_75062
(D. DBD
melanogaster)
Genetic reagent R18H11-p65.AD BDSC RRID:BDSC_68852
(D.
melanogaster)
Genetic reagent R51H05-GAL4. BDSC RRID:BDSC_69036
(D. DBD
melanogaster)
Genetic reagent P{10XUAS-IVS- BDSC RRID:BDSC_32197
(D. myr::GFP}attP2
melanogaster)
Genetic reagent Clk856-GAL4 Gummadova et al., 2009 Flybase: FBtp0069616
(D.
melanogaster)
Genetic reagent Clk4.1M-LexA Guo et al., 2016 Flybase: FBtp0093698
(D.
melanogaster)
Genetic reagent UAS-EGFP BDSC RRID:BDSC_5428
(D.
melanogaster)
Genetic reagent UAS-FRT-STOP- Guo et al., 2018
(D. FRT-
melanogaster) CsChrimson.
mVenus and
LexAop-FLP
Continued on next page
Ma, Przybylski, et al. eLife 2021;10:e63056. DOI: https://doi.org/10.7554/eLife.63056 12 of 19Research article Chromosomes and Gene Expression Neuroscience
Continued
Reagent type
(species) or
resource Designation Source or reference Identifiers Additional information
Genetic reagent Trissin-LexA Deng et al., 2019
(D.
melanogaster)
Genetic reagent Trissin-GAL4 Deng et al., 2019
(D.
melanogaster)
Genetic reagent CCHa1-GAL4 Deng et al., 2019
(D.
melanogaster)
Genetic reagent CNMa-GAL4 Deng et al., 2019
(D.
melanogaster)
Antibody Anti-PER Laboratory of 1:1000
Rabbit Michael Rosbash
polyclonal
Antibody Anti-TIM Laboratory of RRID: AB_2753140 1:200
Rat monoclonal Michael Rosbash
Antibody Anti-PDF DSHB RRID: AB_760350 1:500
Mouse
monoclonal
Antibody Anti-GFP Sigma-Aldrich RRID: AB_390913 1:1000
Mouse
monoclonal
Antibody Chicken anti- Abcam RRID: AB_300798 1:1000
GFP
Antibody Rabbit anti- Takara Bio USA RRID: AB_10013483 1:200
DsRed
Antibody Goat anti-mouse ThermoFisher RRID: AB_2536185 1:200
polyclonal
Antibody Goat anti-rabbit ThermoFisher RRID: AB_2576217 1:200
polyclonal
Antibody Goat anti-rabbit ThermoFisher RRID: AB_2633281 1:200
polyclonal
Antibody Anti-PDF DSHB RRID: AB_760350 1:500
Mouse
monoclonal
Software, FIJI https://fiji.sc/ RRID: SCR_002285
algorithm
Software, Microsoft Office
algorithm Excel
Software, RStudio https://rstudio.com RRID: SCR_000432 Version 1.2.5033
algorithm
Software, Adobe RRID: SCR_014199
algorithm Photoshop CC
Software, Code for This paper R code
algorithm clustering and Ma and Przybylski, 2020)
rhythmic gene
expression
analysis
Fly rearing
In all the experiments, equal numbers of males and females were used. Flies were reared in standard
cornmeal medium with yeast under 12:12 hr LD cycles.
Ma, Przybylski, et al. eLife 2021;10:e63056. DOI: https://doi.org/10.7554/eLife.63056 13 of 19Research article Chromosomes and Gene Expression Neuroscience
FACS sorting of circadian neurons
Flies were entrained for 3 days in 12:12 LD (for LD) and subjected to constant darkness for 3 days
(for DD) prior to dissection. Time points were taken every 4 hr around the clock. Fly brains were dis-
sected with standard protocol (Abruzzi et al., 2017). Briefly, 20 mM DNQX, 0.1 mM TTX, and 50 mM
APV were added into the dissection saline (HEPES-KOH 9.9 mM pH7.4, NaCl 137 mM, KCl 5.4 mM,
NaH2PO40.17 mM, KH2PO40.22 mM, glucose 3.3 mM and sucrose 43.8 mM). The brains were
digested with papain (50 unit/ml, ~2 ml per brain) at room temperature for 30 min. Digestion was
quenched with a fivefold volume of the SM medium (active Schneider’s medium), and brains were
washed twice with the ice-cold SM medium. Brains were triturated with flame-rounded 1000 ml
pipette tips until most of the tissues were dissociated to single cells. The resulting cell suspension
was filtered by 100 mm sieve prior to FACS sorting. The single-cell sorting was carried out with BD
Melody. For single-cell sorting, single-cell sorting mode was used, cells were collected by 96-well
plates or 384-well plates. Plates with sorted cells were centrifuged at 3000 g for 1 min at 4˚C and
then stored in 80˚C until further processing.
Single-cell RNA library preparation
The single-cell library prep was based on CEL-seq2 with some modifications (Paul et al., 2017;
Hashimshony et al., 2016). Drosophila neurons were sorted into 96-well or 384-well plates prefilled
with 0.6 ml primer mix; two empty wells on each plate were used as negative controls. We made four
libraries from a 384-well plate. Sorted plates were centrifuged at 3000 g for 1 min at 4˚C, and then
stored in 80˚C. Eppendorf EPmotion liquid handler was used to dispense first strand synthesis
reagents (0.4 ml) and second strand synthesis reagents mix (6 ml). cDNA from 96 different primers
was pooled together, and 0.8-fold AMPure beads (0.8-fold ratio; Beckman Coulter) were used for
cDNA clean up before the in vitro transcription. The RNA from the first round of IVT was purified by
0.8-fold RNAClean XP beads (0.8-fold ratio) and was used as a substrate for another round of first
strand synthesis at 42˚C for 2 hr using second-round primers (second Round Primer: NNNNNN),
RNA:DNA hybrids were digested with RNase H (Thermal Fisher #18021014) at 37˚C for 30 min. The
second-round second-strand synthesis was carried out at 16˚C with a T7-RA5 primer (GCCGGTAA
TACGACTCACTATAGGGAGTTCTACAGTCCGACGATC). The resulting cDNA underwent another
final second round IVT step at 37˚C overnight and followed ExoSAP treatment (Affymetrix 78200) for
15 min at 37˚C. Other steps were performed as described in the CEL-Seq2 protocol. Each single cell
was sequenced on an Illumina Nextseq 550 sequencing system at a depth of ~0.5 million reads.
Immunohistochemistry
Immunohistochemistry was performed on 3–5 days old flies. Flies were entrained in LD conditions
for 3 days before being fixed with 4% (vol/vol) paraformaldehyde with 0.5% Triton X-100 for 2 hr
and 40 min at room temperature. Brains were dissected with standard protocol in 0.5% PBST. The
brains then washed twice (10 min) in 0.5% PBST buffer and blocked overnight in 10% Normal Goat
Serum (NGS; Jackson ImmunoResearch Lab) at 4˚C. The brains were then incubated in rabbit anti-
PER at 1:1000 dilution, a rat anti-TIM at 1:200 dilution, a mouse or chicken anti-GFP antibody at a
1:1000, a rat anti-RFP antibody at 1:200, or a mouse anti-PDF antibody at 1:1000 for overnight, then
the brains then washed twice (10 min) in 0.5% PBST buffer. The corresponding secondary antibodies
were added and incubated for overnight. Brains were mounted in Vectashield (Thermal Fisher) and
imaged on a Leica SP5 confocal microscope.
Pre-processing of scRNA-seq data
scRNA-Seq data aligned to the Drosophila genome (dm6) using zUMIs (Parekh et al., 2018),
together with STAR with default setting (Dobin et al., 2013). Only the alignments to annotated
exons were used for UMI quantitation. Next, we filtered out low-quality cells using the following cri-
teria: (1) fewer than 1000 or more than 6000 detected genes (where each gene had to have at least
one UMI aligned); (2) fewer than 6000 or more than 75000 total UMI; (3) gene expression entropy
smaller than 5.5, where entropy was defined as -nUMI * ln(nUMI) for genes with nUMI >0, where
nUMI was a number of UMI in a cell.
Ma, Przybylski, et al. eLife 2021;10:e63056. DOI: https://doi.org/10.7554/eLife.63056 14 of 19Research article Chromosomes and Gene Expression Neuroscience
We reported a relative, normalized number of UMIs in a cell as TP10K – transcripts per 10 thou-
sand transcripts. Except where indicated specifically (NPF expression in LD), the reported gene
expression on t-SNE plot is from LD and DD together.
Dimensionality reduction and clustering
We integrated the data from six time points and LD and DD conditions using integration functions
from Seurat 3 (version 3.0.2) package (Butler et al., 2018). First, we separately transformed data
from each time point and condition using the normalization and variance stabilization of counts
(SCTransform function in Seurat), regressing out numbers of genes, UMIs, detected genes per cell,
sequencing batches, percentage of mitochondrial transcripts, and computing 3000 variable genes at
each time point and condition. Next, we found a subset of variable genes that were common to six
time points in LD and DD conditions. From this set of common variable genes, we removed the
mitochondrial, ribosomal, and transfer RNA genes. The resulting, filtered set of genes was used for
integrating data from all time points and conditions using Seurat FindIntegrationAnchors and Inte-
grateData functions using top 50 canonical correlation analysis (CCA) eigenvectors from canonical
correlation analysis. Finally, we performed principal component analysis (PCA) on scaled gene
expression vectors (z-scores) and reduced the data to the top 50 PCA components. We used graph-
based clustering of the PCA-reduced integrated data with the Louvain method. We clustered the
dimensionally reduced data using FindNeighbors and FindClusters functions in the Seurat package.
We visualized the clusters on a two-dimensional map produced with t-distributed stochastic neigh-
bor embedding (t-SNE).
Differentially expressed genes in each cluster
We computed genes that were differentially expressed in each cluster using a negative binomial
generalized linear model (Seurat FindAllMarkers function with a latent variable indicating time,
sequencing batch, and condition). For each gene, the expression in a given cluster was compared
with expression of cells in the remaining clusters. The p-values were adjusted for multiple hypothesis
testing using Bonferroni method. We used an adjusted p-value significance of 0.05 and fold change
cutoff of 1.25 as the threshold of significant differential expression.
Identification of cycling transcripts
Cycling transcripts were identified using both the JTK cycle component of MetaCycle (Wu et al.,
2016) and Fourier transformation (Wijnen et al., 2006). In MetaCycle, cycling transcripts in each
cluster were identified by treating each individual cell as a replicate. Since Fourier transformation is
designed for two replicates of circadian timepoints, the single cells at each timepoint were randomly
split into two groups using a custom script and mean expression for each group was calculated
resulting in two six time point datasets that were used for Fourier analyses. To be considered
cycling, the following cutoffs were used: a JTK cycle Benjamini-Hochberg corrected q-value of less
than 0.05, a F24 score of greater than 0.5, and a cycling amplitude (maximum expression divided by
minimum expression) of at least 1.5-fold, and a maximal expression of at least 0.8 TP10K. If minimum
expression was zero, transcripts passed amplitude cutoffs if they met expression requirements.
Gene ontology analysis
Gene ontology analyses were performed using g:Profiler (Raudvere et al., 2019). All gene lists were
compared to a custom background list that consisted of all genes expressed in the Clk856-GAL4
neuron clusters at a value of at least 0.8 TP10K. Separate background corrections were used for LD
and DD conditions. A g:SCS corrected p-value of less than 0.05 was used as a cutoff for significance.
Acknowledgements
We thank the Bloomington Drosophila Stock Center and Dr. Yi Rao for fly stocks in this study. We
thank the members of the Rosbash lab for thoughtful discussion and comments. We greatly appreci-
ate Drs. Orie Shafer, Sejal Davla, Dragana Rogulja, Bryan Song, Paul Garrity, Sebastian Kadener, and
Fang Guo for insightful comments on the manuscript.
Ma, Przybylski, et al. eLife 2021;10:e63056. DOI: https://doi.org/10.7554/eLife.63056 15 of 19Research article Chromosomes and Gene Expression Neuroscience
Additional information
Funding
Funder Author
Howard Hughes Medical Insti- Dingbang Ma
tute Dariusz Przybylski
Katharine C Abruzzi
Matthias Schlichting
Qunlong Li
Xi Long
Michael Rosbash
The funders had no role in study design, data collection and
interpretation, or the decision to submit the work for publication.
Author contributions
Dingbang Ma, Investigation, Visualization, Methodology, Writing - original draft; Dariusz Przybylski,
Katharine C Abruzzi, Formal analysis, Writing - review and editing; Matthias Schlichting, Methodol-
ogy, Writing - review and editing; Qunlong Li, Xi Long, Methodology; Michael Rosbash, Conceptuali-
zation, Resources, Funding acquisition, Project administration, Writing - review and editing
Author ORCIDs
Dingbang Ma https://orcid.org/0000-0002-5575-7604
Katharine C Abruzzi http://orcid.org/0000-0003-3949-3095
Matthias Schlichting http://orcid.org/0000-0002-0822-0265
Xi Long http://orcid.org/0000-0002-0268-8641
Michael Rosbash https://orcid.org/0000-0003-3366-1780
Decision letter and Author response
Decision letter https://doi.org/10.7554/eLife.63056.sa1
Author response https://doi.org/10.7554/eLife.63056.sa2
Additional files
Supplementary files
. Source data 1. List of identified marker genes in each cluster. Table displaying the average log-
fold change values, percentage of expression and p-value for the list of differentially expressed
genes among clusters.
.Supplementary file 1. List of identified rhythmic genes in each cluster. Table displaying the mini-
mum and maximum gene expression level, phase, and p-value for the list of rhythmically expressed
genes among clusters in light:dark (LD) and constant darkness (DD) conditions.
. Supplementary file 2. Gene ontology (GO) term analysis of the cyclers in each cluster. Table dis-
playing p-value for the GO term analysis of the rhythmically expressed genes among clusters in
light:dark (LD) condition.
. Supplementary file 3. Gene ontology (GO) term analysis for all cyclers. Table displaying the GO
terms and their p-values of the pooled rhythmically expressed genes.
. Transparent reporting form
Data availability
The single-cell RNA sequencing data has been deposited in GEO under the accession code
GSE157504. Code used in this analysis has been deposited in GitHub (https://github.com/rosbash-
lab/scRNA_seq_clock_neurons), copy archived at swh:1:dir:
19da0c557f8884812d196e912af760ba5f5ffe2b.
Ma, Przybylski, et al. eLife 2021;10:e63056. DOI: https://doi.org/10.7554/eLife.63056 16 of 19Research article Chromosomes and Gene Expression Neuroscience
The following dataset was generated:
Database and Identifier
Author(s) Year Dataset title Dataset URL
Ma D, Przybylski D, 2021 A transcriptomic taxonomy of https://www.ncbi.nlm. NCBI Gene Expression
Abruzzi KC, Drosophila circadian neurons nih.gov/geo/query/acc. Omnibus, GSE157504
Schlichting M, Li Q, around the clock cgi?acc=GSE157504
Long X, Rosbash M
References
Abruzzi KC, Zadina A, Luo W, Wiyanto E, Rahman R, Guo F, Shafer O, Rosbash M. 2017. RNA-seq analysis of
Drosophila clock and non-clock neurons reveals neuron-specific cycling and novel candidate neuropeptides.
PLOS Genetics 13:e1006613. DOI: https://doi.org/10.1371/journal.pgen.1006613, PMID: 28182648
Allada R, Chung BY. 2010. Circadian organization of behavior and physiology in Drosophila. Annual Review of
Physiology 72:605–624. DOI: https://doi.org/10.1146/annurev-physiol-021909-135815, PMID: 20148690
Brunet Avalos C, Maier GL, Bruggmann R, Sprecher SG. 2019. Single cell transcriptome atlas of the Drosophila
larval brain. eLife 8:e50354. DOI: https://doi.org/10.7554/eLife.50354, PMID: 31746739
Butler A, Hoffman P, Smibert P, Papalexi E, Satija R. 2018. Integrating single-cell transcriptomic data across
different conditions, technologies, and species. Nature Biotechnology 36:411–420. DOI: https://doi.org/10.
1038/nbt.4096
Cosmanescu F, Katsamba PS, Sergeeva AP, Ahlsen G, Patel SD, Brewer JJ, Tan L, Xu S, Xiao Q, Nagarkar-Jaiswal
S, Nern A, Bellen HJ, Zipursky SL, Honig B, Shapiro L. 2018. Neuron-Subtype-Specific expression, interaction
affinities, and specificity determinants of DIP/Dpr cell recognition proteins. Neuron 100:1385–1400.
DOI: https://doi.org/10.1016/j.neuron.2018.10.046, PMID: 30467080
Davie K, Janssens J, Koldere D, De Waegeneer M, Pech U, Kreft Ł, Aibar S, Makhzami S, Christiaens V, Bravo
González-Blas C, Poovathingal S, Hulselmans G, Spanier KI, Moerman T, Vanspauwen B, Geurs S, Voet T,
Lammertyn J, Thienpont B, Liu S, et al. 2018. A Single-cell transcriptome atlas of the aging Drosophila brain.
Cell 174:982–998. DOI: https://doi.org/10.1016/j.cell.2018.05.057, PMID: 29909982
Deng B, Li Q, Liu X, Cao Y, Li B, Qian Y, Xu R, Mao R, Zhou E, Zhang W, Huang J, Rao Y. 2019.
Chemoconnectomics: mapping chemical transmission in Drosophila. Neuron 101:876–893. DOI: https://doi.
org/10.1016/j.neuron.2019.01.045, PMID: 30799021
Dı́az MM, Schlichting M, Abruzzi KC, Long X, Rosbash M. 2019. Allatostatin-C/AstC-R2 is a novel pathway to
modulate the circadian activity pattern in Drosophila. Current Biology 29:13–22. DOI: https://doi.org/10.1016/j.
cub.2018.11.005, PMID: 30554904
Dobin A, Davis CA, Schlesinger F, Drenkow J, Zaleski C, Jha S, Batut P, Chaisson M, Gingeras TR. 2013. STAR:
ultrafast universal RNA-seq aligner. Bioinformatics 29:15–21. DOI: https://doi.org/10.1093/bioinformatics/
bts635
Fernández MP, Berni J, Ceriani MF. 2008. Circadian remodeling of neuronal circuits involved in rhythmic
behavior. PLOS Biology 6:e69. DOI: https://doi.org/10.1371/journal.pbio.0060069, PMID: 18366255
Fujiwara Y, Hermann-Luibl C, Katsura M, Sekiguchi M, Ida T, Helfrich-Förster C, Yoshii T. 2018. The CCHamide1
neuropeptide expressed in the anterior dorsal neuron 1 conveys a circadian signal to the ventral lateral neurons
in Drosophila melanogaster. Frontiers in Physiology 9:1276. DOI: https://doi.org/10.3389/fphys.2018.01276,
PMID: 30246807
Goda T, Tang X, Umezaki Y, Chu ML, Kunst M, Nitabach MNN, Hamada FN. 2016. Drosophila DH31
neuropeptide and PDF receptor regulate Night-Onset temperature preference. The Journal of Neuroscience
36:11739–11754. DOI: https://doi.org/10.1523/JNEUROSCI.0964-16.2016, PMID: 27852781
Gummadova JO, Coutts GA, Glossop NRJ. 2009. Analysis of the Drosophila clock promoter reveals
heterogeneity in expression between subgroups of central oscillator cells and identifies a novel enhancer
region. Journal of Biological Rhythms 24:353–367. DOI: https://doi.org/10.1177/0748730409343890
Guo F, Yu J, Jung HJ, Abruzzi KC, Luo W, Griffith LC, Rosbash M. 2016. Circadian neuron feedback controls the
Drosophila sleep–activity profile. Nature 536:292–297. DOI: https://doi.org/10.1038/nature19097
Guo F, Chen X, Rosbash M. 2017. Temporal calcium profiling of specific circadian neurons in freely moving flies.
PNAS 114:E8780–E8787. DOI: https://doi.org/10.1073/pnas.1706608114
Guo F, Holla M, Dı́az MM, Rosbash M. 2018. A circadian output circuit controls Sleep-Wake arousal in
Drosophila. Neuron 100:624–635. DOI: https://doi.org/10.1016/j.neuron.2018.09.002, PMID: 30269992
Hamasaka Y, Rieger D, Parmentier M-L, Grau Y, Helfrich-Förster C, Nässel DR. 2007. Glutamate and its
metabotropic receptor in Drosophila clock neuron circuits. The Journal of Comparative Neurology 505:32–45.
DOI: https://doi.org/10.1002/cne.21471
Hashimshony T, Senderovich N, Avital G, Klochendler A, de Leeuw Y, Anavy L, Gennert D, Li S, Livak KJ,
Rozenblatt-Rosen O, Dor Y, Regev A, Yanai I. 2016. CEL-Seq2: sensitive highly-multiplexed single-cell RNA-
Seq. Genome Biology 17:77. DOI: https://doi.org/10.1186/s13059-016-0938-8
Helfrich-Forster C. 1995. The period clock gene is expressed in central nervous system neurons which also
produce a neuropeptide that reveals the projections of circadian pacemaker cells within the brain of Drosophila
melanogaster. PNAS 92:612–616. DOI: https://doi.org/10.1073/pnas.92.2.612
Ma, Przybylski, et al. eLife 2021;10:e63056. DOI: https://doi.org/10.7554/eLife.63056 17 of 19You can also read