A safe, reliable and regenerative electrical energy supply to power the future
←
→
Page content transcription
If your browser does not render page correctly, please read the page content below

EPJ Web of Conferences 246, 00017 (2020)                                                                 https://doi.org/10.1051/epjconf/202024600017
Joint EPS-SIF International School on Energy 2019

                      A safe, reliable and regenerative electrical energy
                      supply to power the future
                      H. Weber and N. Ahmed
                      University of Rostock - 18059 Rostock, Germany

                             Summary. — Today, three phenomena are developing into critical global problems,
                             requiring urgent attention from leaders all over the world. The first of these is
                             the increase in carbon dioxide (CO2 ) emissions due to the escalated use of coal,
                             resulting in the gradual increase of the Earth’s average temperature. The second
                             is the continually diminishing fossil fuel resources, e.g. oil and natural gas, which
                             are the primary sources of energy for vital services like transportation and domestic
                             heating. The third is the unforeseen and rapid “world population boom” since the
                             beginning of the 19th century after the invention of the steam engine by James Watt.
                             The combination of these three factors signal imminent danger. With the increase
                             of the world population, there is a subsequent rise in the usage of both electrical
                             and non-electrical types of energy. At the same time, not only are the sources of
                             these energy forms, i.e. the fossil fuels, depleting because they are non-renewable
                             but their usage is also severely detrimental to the environment. Therefore, it is of
                             utmost importance to reduce the dependence on fossil fuels and switch to renewable
                             or even nuclear resources as alternatives, in order to prevent an impending climate
                             disaster. Hence, taking the aforementioned problems into account, a method is
                             proposed in this paper to create a safe, reliable and regenerative electrical energy
                             supply system using renewable wind and solar energy as well as hydrogen storages.

                      1. – Introduction

                         In fig. 1, a picture developed by two National Aeronautics and Space Administration
                      (NASA) data visualizers is presented, showing the world illuminated by city lights during
                      the night [1]. As can be seen easily, North America, Europe, Japan and South-Korea

   © The Authors, published by EDP Sciences. This is an open access article distributed under the terms of the Creative Commons Attribution License 4.0
   (http://creativecommons.org/licenses/by/4.0/).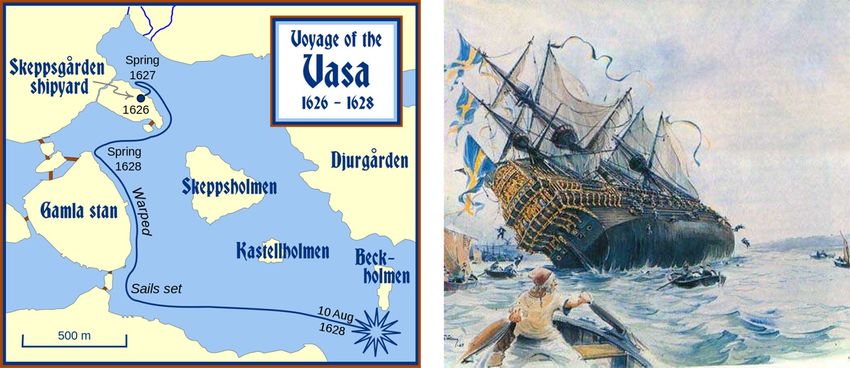
EPJ Web of Conferences 246, 00017 (2020)                                                   https://doi.org/10.1051/epjconf/202024600017
Joint EPS-SIF International School on Energy 2019

                    Fig. 1. – The Earth lights at night. This a composite image of hundreds of pictures made by
                    the orbiting Defense Meteorological Satellite Program (DMSP) satellites [1].

                    are brightly lit. These regions are the ones with the highest standards of living. In
                    Europe this means that a two-person household consumes approximately 3.5 MWh of
                    electrical energy per year [2-5]. Described in gasoline equivalents, this is roughly equal
                    to filling a 100-liter car tank 3.5 times per year. Taking Europe’s population and its
                    total energy usage into account, an annual consumption of about 37 MWh per capita can
                    be calculated, as displayed in table I [6]. In the United States of America (USA) this
                    value is approximately doubled, i.e. 78 MWh per capita per year. This means that every

                    Table I. – Comparison of the annual energy consumption per capita between different regions
                    of the world [6-10]. 1 toe = 11.63 megawatt-hour (MWh).

                                                                                                    Energy
                                                Energy          Energy
                                                                              Population         consumption
                           Regions           consumption     consumption
                                                                              (millions)          per capita
                                             (million toe)      (TWh)
                                                                                                   (MWh)
                        United States           2188.3         25449.9           325.7               78.1
                            EU-28               1629.5         18951.1           508.5               37.3
                            China               2973.3         34579.5           1390                24.8
                            India                   851.1      9,898.3           1260                 7.9
                        South Korea                 272.7      3171.5            49.09               64.6
                          Australia                 125.3      1457.2            22.25               65.5
                           Russia                   709.7      8253.3            144.5               57.1
                            Japan                   429.8      4998.6            136.7               36.6
                            World               13647.4       158719.3           7383                21.5

                                                                 2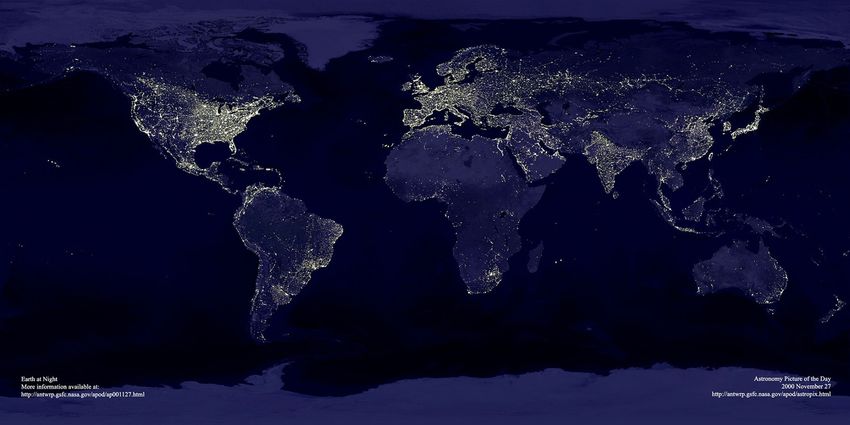
EPJ Web of Conferences 246, 00017 (2020)                                                    https://doi.org/10.1051/epjconf/202024600017
Joint EPS-SIF International School on Energy 2019

                    Fig. 2. – The GDP per capita of different regions of the world in Purchasing Power Parity (PPP)
                    in the year 2000 [11].

                    person in the USA consumes almost twice the energy compared to a resident in Europe
                    on an annual basis. The next largely illumined regions which can be seen on the map
                    are China and India. These so-called “emerging nations” have increased their energy
                    consumption drastically in the recent years, leading to annual figures of about 25 MWh
                    and 8 MWh per capita, respectively.
                       Countries such as Russia and Australia also have high annual energy consumption
                    per capita of roughly 57 MWh and 66 MWh, respectively. However, only certain parts of
                    these areas appear to be brightly lit in fig. 1 owing to their massive size and nature of
                    the population distribution. On the contrary, regions like Africa are nearly completely
                    dark, despite possessing a high population. This is also true for a lot of countries in
                    South America such as Bolivia and Peru. This confirms the fact that the “Earth Night
                    Lights” are not a reflection of the world’s population distribution, but instead represent
                    the quality of life in different areas of the world. Unpopulated regions like deserts and
                    large forests are not taken into account in this case.

                                                                  3
EPJ Web of Conferences 246, 00017 (2020)                                                 https://doi.org/10.1051/epjconf/202024600017
Joint EPS-SIF International School on Energy 2019

                        The trends from fig. 1 are also reflected in fig. 2 which represent the Gross Domestic
                    Product (GDP) per capita of the different regions of the world in the year 2000. Here,
                    the sizes of the regions are adapted according to their total GDP. From this depiction, it
                    can be observed that North America, Europe, Japan and South Korea have the highest
                    GDP per capita values of more than US$ 20000 per capita. Today, these values are much
                    higher; greater than US$ 50000 for North America and Australia, around US$ 40000 for
                    Europe and Japan and close to US$ 30000 for South Korea [12]. This indicates a clear
                    link between the electrical consumption per capita and distribution of global wealth.

                    2. – The role of fossil fuels in global overpopulation and climate change

                       When it comes to ensuring the distribution of the global wealth, one invention was of
                    paramount importance as the driving force. As shown in fig. 3, this was the Steam Engine
                    designed by James Watt. The Scotsman received the patent for his machine in 1769 [13].
                    This contributed to the onset of the first industrial revolution, a significant turning point
                    in the human history, roughly within the next 50 years [14]. In fig. 4, the example of
                    threshing is used to describe one of the many benefits of this invention for mankind. In
                    the past, threshing was done manually for weeks on the farmyard and after the rise of
                    the steam engine, the same work could be done in a matter of hours. However, not only

                    Fig. 3. – The Steam Engine of James Watt and Mathew Bolton [15].

                                                                 4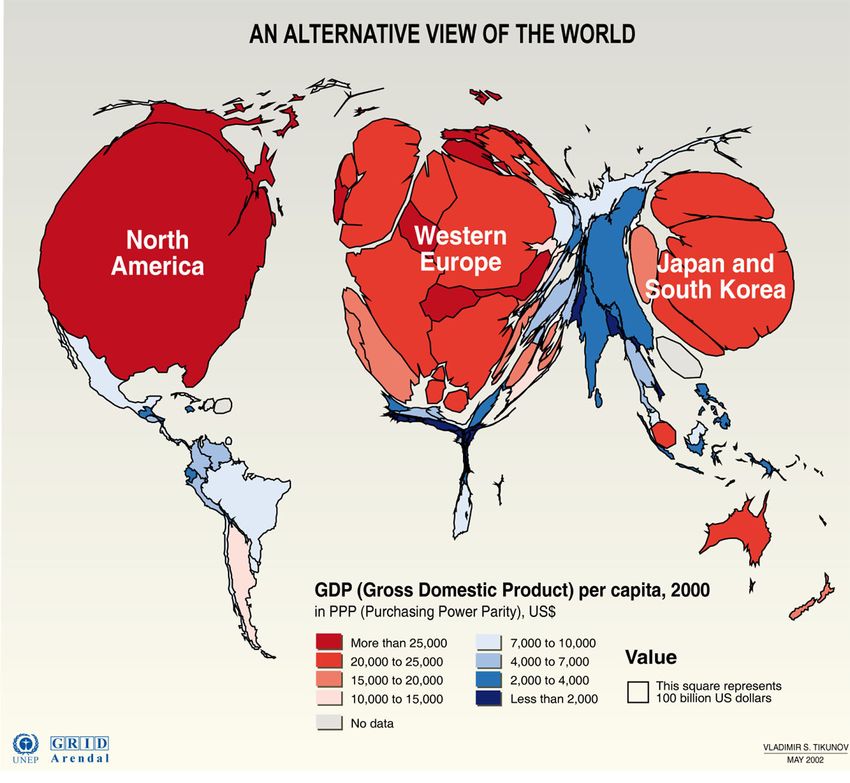
EPJ Web of Conferences 246, 00017 (2020)                                                       https://doi.org/10.1051/epjconf/202024600017
Joint EPS-SIF International School on Energy 2019

                    Fig. 4. – Left: threshing via manual labor. Right: threshing by using a threshing machine [16,17].

                    were farming techniques revolutionized as a result, but also transportation, irrigation,
                    manufacturing of medical products and of course military needs experienced a dramatic
                    boom. Heavy and daunting manual work was reduced for the working class. Then again,
                    the cost of this, being paid till today, is the rise of two other global nightmares; the rapid
                    increase in population and the overuse of fossil fuels resulting in the greenhouse effect
                    leading to the gradual increase of the Earth’s average temperature.
                       Figure 5 portrays the change in world population through time. As predicted in the
                    diagram on the left, more than eight billion people will live on the globe in the year
                    2025. The primary reason for this, as exhibited in the zoomed figure on the right, is
                    the accelerated population growth at the beginning of the 19th century. This was the
                    time when not only were the number of steam engines increasing drastically but also
                    operating reliably. The red arrow on the figure gives an estimate of the total world

                    Fig. 5. – Left: world population growth through history. Right: zoomed view of the global
                    population over the last millennium [18, 19].

                                                                    5
EPJ Web of Conferences 246, 00017 (2020)                                                     https://doi.org/10.1051/epjconf/202024600017
Joint EPS-SIF International School on Energy 2019

                    population without this invention. This indicates that less than one billion people would
                    live on the planet today!
                        The practice of harvesting energy from fossil fuels, based on their current rate of
                    usage, is only expected to continue for approximately 200 more years [20]. Before the
                    inception of such extensive usage of fossil fuels, all the energy was originating from
                    humans, animals as well as wind and water forces. After these non-renewable sources are
                    depleted, only such traditional energy sources along with the prospect of photovoltaics
                    (PV) and nuclear energy will be available. So in the end, the all-important question
                    arises. How can energy be provided to the future generations? Surely, the answer to this
                    question will play a crucial role in the continued existence of life as we know it. While
                    searching for a possible answer, one must also anticipate the possible energy supply and
                    demand in the future. Figure 6 displays such data representing the expected growth of
                    electrical energy in Europe and the entire world until 2040, forecasting an increase of 8%
                    and 61%, respectively. Thus, it cannot be expected that the use of electrical energy will
                    be reduced in the future.
                        Table II lists the different forms of fossil fuel reserves, their consumption rate and
                    their predicted lifetimes. The required data was accumulated from different sources
                    and then used to calculate the lifetime values. As can be seen, only coal is expected
                    to exist for nearly the next 150 years. Oil, natural gas and uranium reserves could
                    come to an end within half a century. As reserves only those fossil energy sources are
                    considered the extraction of which are economically viable. In contradiction, fossil fuel
                    resources such as deep grounded coal, oil sand and shale etc. are energy sources which
                    cannot be mined easily owing to geological, economic and technological limitations. The
                    exploration of such types of primary energy would not only be very expensive, but also
                    environmentally detrimental. Additionally, bearing in mind the current alarming increase

                    Fig. 6. – Predicted electrical energy production increase in the EU (left) and the World (right)
                    with calculations adopted from [21].

                                                                   6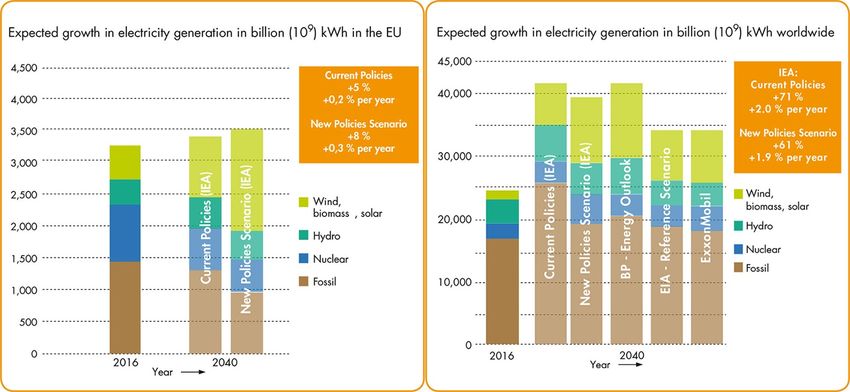
EPJ Web of Conferences 246, 00017 (2020)                                                                   https://doi.org/10.1051/epjconf/202024600017
Joint EPS-SIF International School on Energy 2019

                    Table II. – Different fossil reserves and resources along with their projected lifetimes, taking
                    their current storage levels and rate of usage into account [22-26].

                                                                        Reserves                                 Resources
                           Fossil fuel types                           Consumption          Lifetime                    Lifetime
                                                        Storage                                            Storage
                                                                        (per year)          (years)                     (years)
                               Coal                    1055 Bt            7.8 Bt              135         16195 Bt        2028
                                Oil                     244 Bt           4.66 Bt               52           161 Bt          38
                            Natural gas                197 Tm3          3.85 Tm3               51         310 Tm3           92
                             Uranium                   7.64 Mt            56 Kt               136         36.81 Mt         657
                                                                                                           ∗
                        Non-conventional oil               –                 –                  –            280 Bt        456
                        Non-conventional gas               –                 –                  –         527 Tm3          833
                    ∗
                        Increased value largely due to a re-evaluation of the oil shale resources [27].

                    in the atmospheric density of CO2 , it would be best to discourage the extraction and
                    subsequent usage of such resources.
                        Figure 7 (left) represents a horizontal bar chart signifying the total and per capita
                    CO2 emissions due to the burning of fossil fuels in different regions. The percentage
                    change in the emissions between the years 1990 and 2014 is also shown for each region.
                    As can be seen, the largest increase is in China and India, which are home to the highest
                    populations in the world. Only Europe has reduced its CO2 emissions by 21%, while for
                    USA, the figure is nearly unchanged (4%). On the figure to the right, the production of
                    CO2 from different power plant types is shown. Here of course the emission level from
                    lignite plants is maximum, but that from natural gas power plants is also quite high.
                    Thus, in the long run, combined cycle gas plants are the best option as power plants
                    running on non-renewable fossil fuels. In the end though, considering the ultimate effect

                    Fig. 7. – Carbon dioxide (CO2 ) emissions in selected regions of the world (left) and from different
                    types of power plants (right) [28, 29].

                                                                              7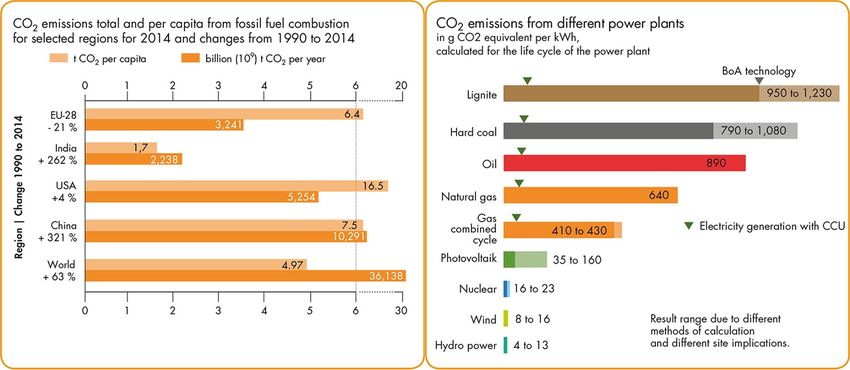
EPJ Web of Conferences 246, 00017 (2020)                                                     https://doi.org/10.1051/epjconf/202024600017
Joint EPS-SIF International School on Energy 2019

                    Table III. – Incentives, goals and future challenges for the energy sector of Germany.

                    Motivation
                       – Replacing fossil fuels with renewable energy sources
                             – Massive reduction of carbon dioxide emissions
                        – No further production of radioactive waste
                            – Eliminating risks of nuclear accidents such as in Fukushima, 2011
                    Goals
                       – Reduce carbon dioxide emissions in Germany by 80% till 2050
                        – Nuclear power phase-out by 2022
                        – Increase the share of renewable energies from 18% today to 40% in 2020 and to 80%
                          in 2050
                    Challenges
                       – Maximum possible direct use of regenerative energy
                        – Maximum utilization of existing potentials
                        – Problems caused by the transmission of power over long distances
                        – Balancing the intermittent feed-in with thermal power plants
                        – Ensuring security of power supply and system stability

                    of CO2 and other greenhouse gases on the climate and environment, PV, wind, nuclear
                    and hydropower are the best and outright options for electrical energy generation.

                    3. – Transformation of the electrical energy system

                       So taking these issues into account, the goals to be met are shown in table III, using
                    Germany as an example. Similar targets also hold true for other countries, since solving
                    the world’s energy crisis and simultaneously tackling an impending climatic disaster
                    requires a global effort.

                    4. – Development of wind and solar resources in Germany

                        Table IV, displays the magnitudes of electrical power and energy generation from
                    wind and PV resources in Germany between the years 2011 and 2025. The maximum
                    electrical load in Germany is 80 GW and this value is expected to remain constant in
                    the near future. On the other hand, the production of power from the renewables is
                    projected to reach 100 GW in 2020. As a result, a significant part of the society believes
                    that further installations to harness renewable power are unnecessary. This often results
                    in strong opposition towards construction of new PV power stations or wind farms.
                    However, analysis regarding the electrical energy requirement for the country leads to
                    completely different conclusions. Germany needs about 600 TWh of electrical energy per
                    year, but the renewable sources can only generate about 200 TWh [30]. It is predicted
                    that the maximum amount of energy which can be harvested from renewable resources

                                                                  8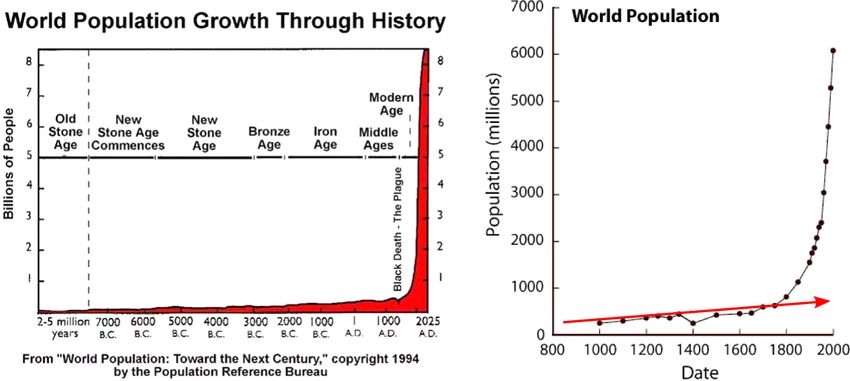
EPJ Web of Conferences 246, 00017 (2020)                                                        https://doi.org/10.1051/epjconf/202024600017
Joint EPS-SIF International School on Energy 2019

                    Table IV. – Projected installed power capacity and energy output of wind and solar resources
                    in Germany till 2025 [32].

                                         Power generation (GW)                    Power generation (GW)
                       Year              Wind                                     Wind
                                                        PV       Sum                                  PV       Sum
                                Onshore      Offshore                     Onshore      Offshore
                       2010       27.2          0.3     17.0     44.5      58.0          1.0          12.0     71.0
                       2011       28.2          0.8     23.0     52.0      61.0          2.8          24.0     87.8
                       2012       29.8          1.2     29.0     60.0      64.6          3.8          30.5     98.9
                       2013       31.2          2.3     32.0     65.5      67.6          8.4          33.5     109.5
                       2014       32.3          3.5     35.0     70.8      69.2          13.8         37.0     120.0
                       2015       33.6          4.4     38.0     76.0      72.0          19.8         39.8     131.6
                       2016       34.1          6.1     41.2     81.4      73.0          26.8         43.2     143.0
                       2017       34.6          7.7     44.0     86.3      75.7          31.3         46.0     153.0
                       2018       35.6          10.3    46.4     92.3      76.3          42.7         48.7     167.7
                       2019       36.2          12.0    49.2     97.4      79.0          50.0         51.5     180.5
                       2020       36.9          14.3    51.9     103.1     80.0          59.0         54.3     193.3
                       2021       37.8          14.8    53.8     106.4     81.0          63.0         56.3     200.3
                       2022       38.2          17.0    55.5     110.7     82.0          72.0         58.2     212.2
                       2023       38.4          18.8    57.0     114.2     83.0          80.8         59.8     223.6
                       2024       39.0          20.7    59.0     118.7     84.0          87.0         61.8     232.8
                       2025       39.5          21.7    60.2     121.4     84.8          92.0         63.2     240.0

                    will be limited to 1000 TWh in the country due to limitation of free space. However, the
                    total final consumption of energy currently per year is 2600 TWh [31]. Hence, there is
                    still a significant difference between consumption and production.
                        Nevertheless, basing the operation of the electrical energy supply solely on wind and
                    solar resources is also not possible since it introduces additional problems in the electrical
                    grid. An overview of this is presented in fig. 8. Here, the projected total consumption
                    and corresponding generation of electrical power is shown in Germany for a duration
                    of four weeks in May 2020 [32]. As can be seen, the power generation from resources
                    consisting of hydropower, wind onshore and offshore, combined heat and power, as well as
                    photovoltaics is completely unrelated to the load demand. This means that some storage
                    power plants (SPP) are needed to bridge the gap between consumption and production.

                    5. – Operation of a storage power plant (SPP)

                        The SPP consists of converters and storages. The power plant does not contain
                    any flywheels or rotating masses. Similar to wind turbines and solar panels, the SPP
                    is connected to the grid via power electronic converters and hence does not have any
                    inertia. However, in order to function effectively in the current electrical network, the

                                                                   9
EPJ Web of Conferences 246, 00017 (2020) https://doi.org/10.1051/epjconf/202024600017
Joint EPS-SIF International School on Energy 2019
Fig. 8. – The projected electrical power demand and corresponding generation from intermittent
as well as non-dispatchable sources during May 2020 [32].
SPP converter systems have to adapt to the rotating masses and respective frequency
of the conventional power plants (CPP). This can be done by synthetically generating
rotating inertia and primary reserve power. To achieve this, the converters have to
measure the instantaneous active power at the connecting node so they can properly
feed their angle-oriented regulating power into the grid. This way, these new converter
systems can also function as power plants and can hence be integrated into the grid.
In the future, when the number of CPP reduces significantly in the electrical power
supply due to the lack of fossil fuels, the need for such power converters to adapt to rotat-
ing masses will diminish and frequency control may become obsolete. A new method of
grid control can then be introduced, known as the nodal voltage angle control [33,34]. Un-
der this control method, the SPP can function either in grid-forming or grid-supporting
mode with a constant grid frequency. All the fundamental principles of electrical energy
supply and power system control, which are satisfied today with the CPP running on
fossil fuels, can also be met by the SPP. An overview of this is presented in fig. 9 where
the component chains of the two types of power plants are compared. The mode of
operation of a SPP operating in grid-forming mode is explained next and compared with
the output response of a coal fired thermal power plant, when there is a step increase in
the active power requirement in the network.
Conversion/adaptation. The step increase in the active power requirement at the
DC/AC converter with a constant nodal voltage angle (grid-forming) leads to an instan-
taneous increase of three-phase AC current and therefore also an instantaneous increase
of direct current on the DC side of the adjacent converter.
10EPJ Web of Conferences 246, 00017 (2020) https://doi.org/10.1051/epjconf/202024600017
Joint EPS-SIF International School on Energy 2019
Fig. 9. – Comparison between the (a) existing fossil fuel based and (b) new storage power plant.
Storage. The supercapacitor instantaneously accesses its stored electrical energy and
supplies this as output power. A capacitor is chosen for this purpose since it can imme-
diately supply large magnitudes of power. As a result, the voltage of the supercapacitor
decreases, which signifies the amount of its stored energy. These features are similar to
that of the spinning reserve in a thermal power plant, which is provided by the decrease
in the speed of the rotating masses in the system.
Conversion/adaptation. The downstream DC/DC converter’s governor between the
battery and the supercapacitor in fig. 9(b) has to keep the capacitor voltage constant.
To this end, it accesses the battery increasing the battery output power within a few
seconds. As a result, the supercapacitor charging current increases and this recharges its
energy storage. These properties are similar to that of the primary control of thermal
power plants where the opening of the steam valve in the boiler is adjusted to increase
the flow of live steam, restoring the speed of the turbine prime mover.
Storage. Due to the increase in battery output power there is a decrease in battery
voltage resulting in a decline in the amount of stored energy as well.
Conversion/adaptation. The DC/DC converter, on the upper branch between the
fuel cell and the battery, adjusts the required voltages enabling the charging current to
flow from the fuel cell to the battery. The fuel cell’s control unit increases its activity and
synthesizes more water from hydrogen and oxygen and as a result produces more energy
to replenish the battery storage as well as satisfy the power demand in the network.
Storage. The fuel cell’s control unit accesses the hydrogen storage within a few minutes
and increases the fuel input mass flux. The amount of hydrogen in the storage decreases.
11EPJ Web of Conferences 246, 00017 (2020) https://doi.org/10.1051/epjconf/202024600017
Joint EPS-SIF International School on Energy 2019
It may be refilled autonomously by the plant via the electrolyzer. This is similar to
secondary control in a coal fired thermal power plant where the fuel governor accesses
the coal store to increase the fuel input. However, the coal storage cannot be reloaded
automatically by the plant. The capacitor between the DC-DC converter and the fuel
cell stores some energy and this is analogous to the heat stored on the pipe walls inside
the boiler of a thermal power plant.
During steady state operation, the required power is effectively transferred from the
hydrogen storage to the three-phase network. The battery or the capacitor storages only
act, when the consumption or production in the network changes suddenly, to instanta-
neously respond and provide the necessary ancillary services autonomously. Contrary to
current power plants, which are only able to reduce their output to a certain minimum,
this new type of power plant can actually reverse its output. In case of a production sur-
plus from renewable sources or decrease in load demand, there is a shock-free transition
from fuel cell to electrolyzer operation to store the excess energy. The corresponding con-
verters adjust the voltage of each component, while the electrolyzer produces hydrogen
of the required pressure, which can also be used later for automobiles [35].
6. – Angle regulated operation of a storage power plant
When the power supply system will mainly rely on storage power plants, “Watt’s
speed control” will not be required anymore. The three-phase supply can be operated
at a constant frequency, for instance at 50 Hz. The tasks of grid control like spinning
reserve and primary control can be fulfilled using the nodal voltage angle at the storage
power plant’s connection point. The grid itself with its admittance matrix and voltage
angles operates as a coordinating unit. All the required information is provided using
the given load flow. Storage power plants can operate either in grid-forming mode, as
slack power plants (voltage source), or in grid-supporting mode, as PV (constant active
power and voltage magnitude output) power plants (current or power source). These
features are present in the current conventional power plants with a certain time delay
from either an integral acting angle control (slack behavior) or active power control (PV
behavior). To that end, all power plants have to know the current voltage angle at
their connected terminal with reference to the 50 Hz angle standard of their control area
via an accurate radio controlled quartz clock. This clock can be synchronized via the
time signal transmitter, DCF77, of the Physikalisch-Technische Bundesanstalt (PTB) in
Braunschweig, Germany once each day.
The mode of operation of this new type of grid control is best explained with an
example network shown in fig. 10. The grid consists of 25 equidistant nodes, each con-
nected to either a generator or a load. The nodes are interconnected via transmission
lines, each 50 km long and at a voltage level of 110 kV. The line impedances are identical
and each has a magnitude of 0.3 Ω/km, with the resistance to reactance ratio being 0.1.
There are 11 power plants, of which 5 are slack storage power plants. The other 6 are
PV power plants, i.e. generators at terminals where the active power (P) being supplied
and the voltage magnitude (|V|) has a known value. The remaining 14 nodes are each
12EPJ Web of Conferences 246, 00017 (2020) https://doi.org/10.1051/epjconf/202024600017
Joint EPS-SIF International School on Energy 2019
Fig. 10. – 25-node example network.
connected to a PQ consumer, i.e. loads at terminals where the active (P) and reactive
power (Q) being consumed are known.
It is assumed that each of the 14 loads consumes 10 MW of active power. The total
consumption of 140 MW is equally shared by the 5 Slacks and the 6 PV Generators
each producing 12.7 MW to meet this demand. Each load also consumes 3.33 MVAR
of reactive power which is supplied later by the generators. Unfortunately, the reactive
power results are not discussed here due to limitation of space. The network modeling
and simulations are carried out in the software DIgSILENT PowerFactory. The slack
and PV generators are modeled as AC Voltage Sources along with necessary control
loops to represent the behavior of power electronic converters replacing the conventional
Synchronous or Asynchronous generators.
Figures 11 and 12 (left) show the voltage phasors of the initial load flow calculations
Fig. 11. – Voltage phasors of storage power plants (left) and that of PV generators (right), after
the initial loadflow.
13EPJ Web of Conferences 246, 00017 (2020) https://doi.org/10.1051/epjconf/202024600017
Joint EPS-SIF International School on Energy 2019
Fig. 12. – Voltage phasors of loads after the initial loadflow (left) and the active power output
of the storage power plants along with the change in load power consumption (right).
respectively, for slack storage power plants, PV power plants, and PQ consumers. As
shown in the diagrams, the PQ consumer’s voltage phasors follow the surrounding voltage
phasors of slack and PV power plants, ensuring the load flow from the generators to the
consumers. For the sake of clarity in voltage angles, the imaginary axis is shown in an
overstretched manner in this depiction.
In the first case of investigation with the 25 node network, a ramp is implemented
at the central node 13 to represent an increase in the power consumption by load. The
consumer power demand at this node is increased from 10 MW to 110 MW in a duration
of 80 s and the response of the five slack storage power plants is analyzed. Figure 12
(right) shows this power increase of the consumer at node 13 and the corresponding
reaction of the constant voltage slack storage power plants. The depiction shows how
each of the slack storage power plants supply the additional required power according to
their electrical proximity to the consumer.
Fig. 13. – Left: increase in power consumption by load at node 13 and the resulting increases
in the generation of every slack power plant. Right: angle changes in PV generators and PQ
consumers during the increase in load power consumption at node 13.
14EPJ Web of Conferences 246, 00017 (2020) https://doi.org/10.1051/epjconf/202024600017
Joint EPS-SIF International School on Energy 2019
Fig. 14. – Active power of slack nodes and increasing generation at node 12.
These results are further supported by fig. 13 (left), which shows the maximum power
increases of the consumer and storage power plants, depicted as bars. Consumption is
shown as a negative value, and generation as positive values. Due to the resistance
in the transmission lines, there will be some losses during the power flow and the total
additional power supplied will be slightly greater than the additional demand of 100 MW.
Such behavior of storage power plants is analogous to the combined effect of spinning
reserve and primary control. This type of primary control is load flow oriented, since the
storage power plants closer to the origin of the disturbance generate more power than the
remote ones. Hence, in the event of a disturbance, the load flow mainly emerges at that
location while remote storage power plants contribute little in terms of power supply.
Figure 13 (right), exhibits the angular torsion of all the non-slack nodes in the in-
vestigated grid. All angular changes are depicted from their initial operating point as
reference. The voltage angle of the load in node 13 has a maximum decrease by 2.45◦
owing to the large increase in power consumption. The resulting angle torsions in the
rest of the grid due to this power decrease are required by the slack power plants to
provide the necessary additional power.
In the next case of investigation with the 25 node network, a ramp is implemented at
node 12 containing a PV generator in order to increase the generator power output from
10 MW to 110 MW in a duration of 80 s. This depicts a situation that could possibly
arise from the increase in power generation of wind turbines in a particular region due
to an increase in wind speed. The response of the five slack storage power plants to this
change is then analyzed.
Figure 14 depicts how each of the slack storage power plants reduce their power
generation or increase their power storing capability due to the generation of additional
power in the system. Once again, the response of the slack storage power plants are
according to their electrical proximity to the node with changing power, in this case
node 12. This is also supported by fig. 15 (left). These results show that not only can
slack storage power plants increase their power generation to respond to increased load
demands, but they are also able to store active power if there is excessive generation
15EPJ Web of Conferences 246, 00017 (2020) https://doi.org/10.1051/epjconf/202024600017
Joint EPS-SIF International School on Energy 2019
Fig. 15. – Left: increase of power production by PV generator at node 12 and the resulting
decreases in the generation of every slack power plant. Right: angle changes in PV generators
and PQ consumers during the increase in power generation at node 12.
from renewable sources in the system. This truly exhibits the possibility of bidirectional
active power flow for the slack storage power plant system, as shown in fig. 9(b).
Figure 15 (right), depicts all angular changes of the non-slack nodes from their initial
operating point. Since the grid is organized in such a way that there are more slacks to
its northern and eastern part, the angular torsions have higher values in the zones with
fewer slacks, i.e. the southwestern part of the grid. The voltage angle of the generator
in node 12 has a maximum increase of 2.26◦ owing to the large increase in its power
generation. The resulting angle changes in the nodes due to the power increase in node 12
are used by the slack power plants to reduce their output and accordingly store the excess
energy to counter the presence of additional power in the system.
7. – What could be the consequences of ignoring reason?
From the information provided till this point, it is clear that the problems mentioned
previously have to be solved not only to ensure a reliable energy supply in the future but
also for the overall development of our planet. The use of fossil fuel energy resources has
to be reduced and, if possible, even stopped in the future. The consumption of energy
should not significantly increase any further and the growth of the world population
needs to be limited. To achieve all these, it is necessary that a significant part of the
younger generation is not only aware of these issues but is also able to understand them
and offer possible solutions to tackle these problems.
What happens when unqualified and, in certain cases, unethical people are in charge
of decisions under crisis situations can be exemplified with the incident of the “Vasa”
warship sinking in the year 1628 in Stockholm, Sweden during the Thirty Years’ War. To
construct this ship, an equivalent amount of money close to the entire Gross Domestic
Product of one year in Kingdom Sweden was used, to gain warfare advantage in the
Baltic Sea against Poland.
16EPJ Web of Conferences 246, 00017 (2020) https://doi.org/10.1051/epjconf/202024600017
Joint EPS-SIF International School on Energy 2019
Fig. 16. – 1:10 scale model of the ship on display at the Vasa Museum [36].
In fig. 16 a model of the ship can be seen, now present in a museum in Stockholm.
Initially, it was decided that the ship should only have one deck of cannons. However,
King Gustav Adolf recommended to install a second set in an additional higher deck.
Due to this decision, the center of mass of the warship became too high and the ship was
unstable. As a result of the death of the initial Dutch constructor during the construction
phase, new unskilled people took over the job. After finalizing the construction of the
warship, a stability test was performed with 30 sailors running back and forth from
port to starboard five to ten times. During this time, it was observed that the ship
was inclining sideways beyond expected limits and thus the test was stopped. The two
new contractors understood the problem and could conclude that the ship would sink
Fig. 17. – Left: the maiden journey of the Vasa. Right: the sinking of the great warship [37,38].
17EPJ Web of Conferences 246, 00017 (2020) https://doi.org/10.1051/epjconf/202024600017
Joint EPS-SIF International School on Energy 2019
immediately if it was allowed to sail. However, neither of them informed the King nor
did anything stop the maiden voyage. Under this situation, the only solution would have
been to inform the responsible authority and dismantle the ship in order to salvage its
parts so a better one could be constructed later. However, this did not happen and
thus the ship started its voyage from the shipyard as can be seen in fig. 17 (left). After
about 20 minutes, there was a strong gust of wind and the glamorous ship tilted sideways
allowing water to flood into the open lower gundeck causing the ship to sink rapidly, as
shown in fig. 17 (right).
Today, we are nearly in the same situation concerning our energy supply, CO2 emis-
sions, global warming and the increasing global overpopulation. We know the problem,
we know that the current system is unstable and we know the possible alternatives to
using fossil fuels. Thus, it is completely in our own hands if we opt not to make any
changes and continue in our present course or whether we decide to take action against
such impending threats and give our future generations a chance to live on this planet
with at least the same standards of living as ours.
REFERENCES
[1] Mayhew C. and Simmon R., (NASA/GSFC), NOAA/NGDC, DMSP Digital Archive,
Astronomy Picture of the Day (Earth at Night) (Image) 2000. Retrieved from https://
apod.nasa.gov/apod/ap001127.html.
[2] Household composition statistics (2017). Retrieved from https://ec.europa.eu/eurostat/
statistics-explained/index.php/Household composition statistics#
Household size.
[3] Morris C., German power bills are low compared to US average (Blog) 2015. Retrieved
from https://energytransition.org/2015/05/german-power-bills-low-
compared-to-us/.
[4] Morris C., High German power prices, low monthly bills? (Blog) 2018. Retrieved from
https://energytransition.org/2018/02/high-german-power-prices-low-monthly-
bills/.
[5] Thalman E. and Wehrmann B., What German households pay for power, Clean Energy
Wire 2019. Retrieved from https://www.cleanenergywire.org/factsheets/what-
german-households-pay-power.
[6] Eurostat Statistics Explained, The EU in the world - energy (online) 2015. Available
at https://ec.europa.eu/eurostat/statistics-explained/index.php?title=The_EU_
in_the_world_-_energy.
[7] Wikipedia Contributors, Tonne of oil equivalent, in Wikipedia, The Free Encyclopaedia
2018. Retrieved from https://en.wikipedia.org/w/index.php?title=Tonne_of_oil_
equivalent&oldid=873843263.
[8] Eurostat Statistics Explained, Population and population change statistics (online)
2018. Available at https://ec.europa.eu/eurostat/statistics-explained/index.php/
Population_and_population_change_statistics.
[9] People > Population in 2015: Countries Compared (2015). Retrieved from https://www.
nationmaster.com/country-info/stats/People/Population-in-2015.
[10] Worldometers, World Population by Year (online) 2019. Available at https://www.
worldometers.info/world-population/world-population-by-year/.
18EPJ Web of Conferences 246, 00017 (2020) https://doi.org/10.1051/epjconf/202024600017
Joint EPS-SIF International School on Energy 2019
[11] Tikunov V. S., An Alternative View of the World (2000). Retrieved from https://
pasarelapr.com/detail/economic-map-of-the-world-27.html.
[12] World Bank, GDP per capita in US$ (2017). Retrieved from https://ourworldindata.
org/grapher/gdp-per-capita-in-us-dollar-world-bank?time=1960..2017.
[13] Watt J., Steam engine (Art, Architecture and Engineering Library) 1781.
[14] Wikipedia Contributors, Industrial Revolution, in Wikipedia, The Free Encyclopaedia
(2019). Retrieved from https://en.wikipedia.org/w/index.php?title=Industrial
Revolution&oldid=900847688.
[15] Dampfmaschine/Dampfkraftmaschine, Steam engine/Steam power-Funktion, Aufbau
& Animation (Function, construction & animation). Retrieved from https://www.k-wz.
de/dampfmaschine/.
[16] Treading and Threshing, retrieved from http://mek.oszk.hu/02700/02790/html/61.
html.
[17] Watson J., Farm mechanisation - Steam, wind, water and oil, Te Ara - the Encyclopedia
of New Zealand. Retrieved from http://www.TeAra.govt.nz/en/photograph/18372/
steam-powered-threshing-machine.
[18] World population: Toward the next century, copyright by the Population Reference Bureau,
1994.
[19] Human population growth chart, World population growth charts - More than
exponential 2009. Retrieved from http://www.subdude-site.com/WebPages_Local/Blog/
topics/environment/worldPopGrowth_charts/enviro_worldPopGrowth_charts.htm.
[20] Years of fossil fuel reserves left, BP Statistical Review of World Energy 2016. Retrieved
from https://ourworldindata.org/grapher/years-of-fossil-fuel-reserves-left.
[21] IEA, EU Commission, VGB Powertech, Electricity generation facts and figures (2018).
[22] BP Statistical Review of World Energy (2019). Retrieved from https://www.bp.com/
content/dam/bp/business-sites/en/global/corporate/pdfs/energy-economics/
statistical-review/bp-stats-review-2019-full-report.pdf.
[23] Coal and lignite domestic consumption, Global Energy Statistical Yearbook (2019).
Retrieved from https://yearbook.enerdata.net/coal-lignite/coal-world-
consumption-data.html.
[24] Nuclear Energy Agency and International Atomic Energy Agency, Uranium
(2016). Retrieved from https://www.oecd-ilibrary.org/content/publication/
uranium-2016-en.
[25] Federal Institute for Geosciences and Natural Resources (BGR), Reserves,
resources and availability of energy resources (2013). Retrieved from https://www.bgr.
bund.de/EN/Themen/Energie/Downloads/energiestudie 2013 en.pdf? blob=
publicationFile&v=2.
[26] World Energy Council, World energy resources (2016). p. 262. Retrieved from
https://www.worldenergy.org/assets/images/imported/2016/10/World-Energy-
Resources-Full-report-2016.10.03.pdf.
[27] Federal Institute for Geosciences and Natural Resources (BGR), Data and
developments concerning german and global energy supplies (2017) pp. 41–44. Retrieved
from https://www.bgr.bund.de/EN/Themen/Energie/Downloads/energiestudie_2017_
en.pdf?__blob=publicationFile&v=2.
[28] U.S. Department of Energy’s (DOE) Environmental System Science Data
Infrastructure for a Virtual Ecosystem (ESS-DIVE), VGB Powertech, Electricity
generation facts and figures (2018).
[29] Paul Scherrer Institute (PSI) - Switzerland, ESU-services, VGB Powertech, Electricity
generation facts and figures (2018).
19EPJ Web of Conferences 246, 00017 (2020) https://doi.org/10.1051/epjconf/202024600017
Joint EPS-SIF International School on Energy 2019
[30] Federal Ministry of Economic Affairs and Energy, Electricity Market of the
Future-Facts and Figures (2014). Retrieved from https://www.bmwi.de/Redaktion/EN/
Artikel/Energy/electricity-market-of-the-future-facts-and-figures.html.
[31] Total Final Consumption (TFC) by source, Germany 1990–2016 (2016). Retrieved from
https://www.iea.org/statistics/?country=GERMANY&year=2016&category=Energy%
20consumption&indicator=TFCbySource&mode=chart&dataTable=BALANCES.
[32] Ziems C. and Meinke S., Kraftwerksbetrieb bei Einspeisung von Windparks und
Photovoltaikanlagen (Power Plant Operation during Increased Energy Feed-in from Wind
Parks and Photovoltaics), VGB Powertech, Techical Report No. 333 (2012).
[33] Weber H., Baskar P. and Ahmed N., Power system control with renewable sources,
storages and power electronic converters, in 2018 IEEE International Conference on
Industrial Technology (ICIT) 2018 (IEEE) 2018, pp. 1272–1278.
[34] Weber H., Baskar P. and Ahmed N., Nodal Voltage Angle Control of Power Systems
with Renewable Sources, Storages and Power Electronic Converters, in 2018 International
Conference on Smart Energy Systems and Technologies (SEST) (IEEE) 2018, pp. 1–6.
[35] Teichmann D., Arlt W., Wasserscheid P. and Freymann R., “A future energy supply
based on liquid organic hydrogen carriers (LOHC)”, Energy Environ. Sci., 4 (2011) 2767.
[36] Vasa stern color model, Wikimedia Commons, the free media repository (2015).
Retrieved from https://commons.wikimedia.org/w/index.php?title=File:Vasa stern
color model.jpg&oldid=158708673.
[37] Voyage of the Vasa, Wikimedia Commons, the free media repository (2016). Retrieved
from https://commons.wikimedia.org/w/index.php?title=File:Voyage_of_the_Vasa_
2.svg&oldid=189794035.
[38] Klaschka S., VASA’s historic project management lesson (2012). Retrieved from
https://orgchanger.com/2012/03/13/vasas-historic-project-management-lesson/.
20You can also read