A ROADMAP FOR IMMIGRATION REFORM - IDENTIFYING WEAK LINKS IN THE LABOR SUPPLY CHAIN
←
→
Page content transcription
If your browser does not render page correctly, please read the page content below
REPORT
 MARCH 2023

 A ROADMAP FOR
 IMMIGRATION REFORM
 IDENTIFYING WEAK LINKS IN
 THE LABOR SUPPLY CHAIN

DANY BAHAR | GREG WRIGHT

A ROADMAP FOR IMMIGRATION REFORM | IDENTIFYING WEAK LINKS IN THE LABOR SUPPLY CHAIN

 Authors

 Dany Bahar, Nonresident Senior Fellow, Global Economy and Development,
 Brookings Institution; Associate Professor of Practice of International and
 Public Affairs, Brown University

 Greg Wright, Fellow, Global Economy and Development, Brookings Institution

 Acknowledgements

 The Brookings Institution is a nonprofit organization devoted to independent
 research and policy solutions. Its mission is to conduct high-quality,
 independent research and, based on that research, to provide innovative,
 practical recommendations for policymakers and the public. The conclusions
 and recommendations of any Brookings publication are solely those of its
 author(s), and do not reflect the views of the Institution, its management, its
 other scholars, or the funders acknowledged below.

 Brookings gratefully acknowledges the support provided by TIDES and
 Google.org. Brookings recognizes that the value it provides is in its
 commitment to quality, independence, and impact. Activities supported by its
 donors reflect this commitment.

 The authors thank Brahima S. Coulibaly for providing extremely helpful review
 and comments as the editor of this report; Ian Seyal and Carlos Daboin for
 their tremendous research assistance and support on fact-checking; Junjie
 Ren, Izzy Taylor, Esther Rosen, Jeannine Ajello, and the Brookings
 communications team for invaluable communications insights and support.
 The authors further thank participants in the Roadmap for Immigration
 Reform event in October.

Brookings Institution 1
A ROADMAP FOR IMMIGRATION REFORM | IDENTIFYING WEAK LINKS IN THE LABOR SUPPLY CHAIN

 Executive Summary
 The last time the U.S. enacted major immigration reform was the Immigration
 Reform and Control Act in 1986. Since then, little has been done to fix what
 has become a broken system despite heated debate at the national, state, and
 local levels.

 Unfortunately, the immigration debate has also become increasingly
 disconnected from the exigencies of the U.S. economy, even in the aftermath
 of the COVID-19 pandemic in which worker shortages and labor market
 dysfunction have become increasingly glaring. Worse still, the aging U.S.
 workforce and structural shifts toward a more service-oriented economy will
 likely deepen much of this dysfunction unless policymakers can agree to
 major reforms to shore up the U.S. workforce.

 This report aims to support these necessary reforms by highlighting the areas
 of the economy that are most in need of workers. Importantly, our approach
 not only highlights occupations that are—and will continue to be—in greatest
 demand, but also the occupations that are most complementary to the
 existing workforce, ensuring that efforts to meet these labor market needs will
 support all workers. At the core is a framework that we call the Occupational
 Opportunity Network, which identifies strategic occupations that will be in
 high demand for the next decade; are historically immigrant intensive; and
 have a high degree of complementarity with other occupations. In short, we
 define highly complementary occupations as those that are central to the U.S.
 workforce in the sense that they are used as inputs to many different
 industries and, within those industries, tend to augment the employment of
 other workers.

 This framework can support immigration reform efforts in Congress and the
 executive branch—for instance, when considering the scale of any expansion
 in the number of H1B (specialty, high education) and H2 (temporary services)
 visa categories or in devising new policies, possibly including some of those
 that we discuss at the end of the report.

 We show that the H2B visa program should be expanded to accommodate
 increased hiring of hospitality workers, drivers, construction workers, and care
 workers. Similarly, the H1B visa program should be expanded to
 accommodate increased hiring of health care workers, executives, and
 engineers, among others.

Brookings Institution 2
A ROADMAP FOR IMMIGRATION REFORM | IDENTIFYING WEAK LINKS IN THE LABOR SUPPLY CHAIN

 It is important to note at the outset that the jobs that we identify as high-value
 needs for the economy are not intended to be used as explicit targets for
 policy. Immigration system reforms will necessarily need to be broad-based,
 and we assume that the market will allocate workers most efficiently, an
 assumption that is bolstered by research showing that immigrants are highly
 efficient equilibrators of labor markets. This report is instead meant to outline
 the nature and scale of the workforce problems that the U.S. currently faces
 and to highlight the effects that different types of reforms will likely have in
 alleviating the wide-ranging labor market dysfunction that exists.

 We begin by describing the current U.S. labor market context, noting the
 important distortions caused by the pandemic and their relationship to the
 immigrant workforce. Next, we present our detailed framework, the
 Occupational Opportunity Network. Finally, we offer some practical policy
 applications.

Brookings Institution 3
A ROADMAP FOR IMMIGRATION REFORM | IDENTIFYING WEAK LINKS IN THE LABOR SUPPLY CHAIN

 The post-COVID U.S. labor
 market
 Over the past year, the number of new job openings in the U.S. grew by nearly
 half a million, while the number of filled openings fell by nearly 200,000.1 This
 continues a trend of historically tight labor markets that has persisted for over
 two years and shows no sign of abating. This labor shortage has been driven
 in part by strong demand for goods and services as Americans continue to
 spend down pandemic-era savings. But the supply side has also played an
 important role. For instance, many people have still not returned to work and
 labor force participation remains a full percentage point below its pre-
 pandemic level. In addition, the drastic decline in immigration during the
 pandemic reduced the stock of foreign-born workers by nearly two million
 compared to what it would have been in the absence of the pandemic. And
 this decline has not been confined to high-immigration states on the coasts—
 many of the hardest-hit labor markets are fast-growing, midsized cities in the
 Midwest.

 As we discuss below, this labor shortage may be a harbinger of things to
 come, as the aging U.S. population and falling birth rates more permanently
 reduce the supply of workers. In this report, we show that the consequences
 of the labor shortage for U.S. workers may be even larger than it appears, as
 immigrant workers tend to work in occupations that are particularly central to
 the economy and particularly complementary to other occupations.

 Confronting labor market tightness in the short run

 It is important to note that many U.S. workers have exploited the current labor
 market tightness to upgrade to better jobs. Often these new jobs require
 specialized training or skills that these workers would not otherwise have
 acquired, which has been a boon for millions of workers who will carry this
 know-how with them through their careers. But this shift has also left a sizable
 hole in the labor market for less specialized, more routine work that employers
 have been struggling to fill. In fact, the shortage of workers in these jobs has
 persisted despite substantial wage growth in low-paid work, with wages rising
 faster than prices for most of these workers.

1
 Bureau of Labor Statistics, “Job Openings Levels and Rates by Industry and Region, Seasonally Adjusted
- 2022 M06 Results,” accessed August 27, 2022, https://www.bls.gov/news.release/jolts.t01.htm.

Brookings Institution 4
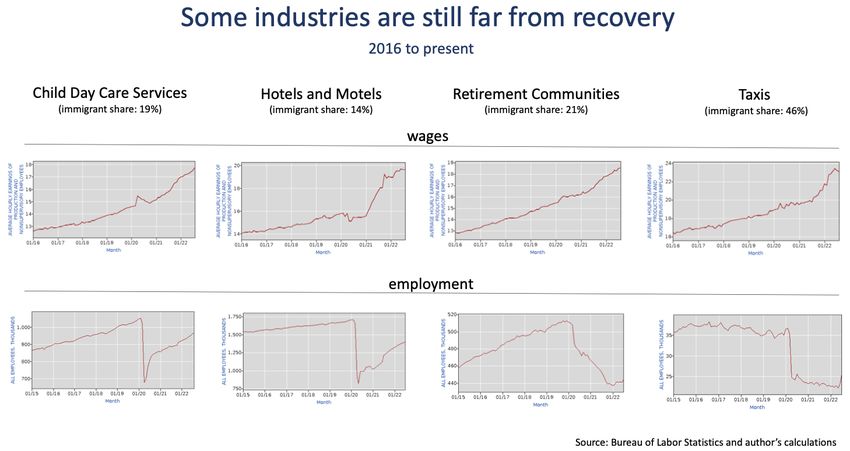
A ROADMAP FOR IMMIGRATION REFORM | IDENTIFYING WEAK LINKS IN THE LABOR SUPPLY CHAIN

Figure 1. Some industries are still far from recovery (2016 to present)

Data source: Bureau of Labor Statistics

 Figure 1 documents these facts for four representative industries over the
 past four years, though there are many other industries whose experience has
 been similar. Each of these industries has been experiencing strong wage
 growth, but weak or non-existent employment growth and, consequently, is
 falling far short of meeting demand for its output. The core problem facing
 firms in these industries is that they simply pay too little for what is often
 arduous work. In some cases, firms in these industries are unable to raise
 wages due to an inability to pass increases in costs through to prices. This is
 the case, for instance, in the child care sector which serves especially price-
 sensitive customers and is therefore constrained to pay low wages. These
 firms are often competing for workers with firms in industries like freight
 trucking ($27/hour) or warehouse and storage ($23/hour) that employ
 similarly educated workers but pay higher wages and, in many cases, offer
 superior working conditions.

Brookings Institution 5
A ROADMAP FOR IMMIGRATION REFORM | IDENTIFYING WEAK LINKS IN THE LABOR SUPPLY CHAIN

Figure 2. Pandemic recovery and wages by industry

Data source: Bureau of Labor Statistics

 Figure 2 documents these facts with a more systematic approach, plotting
 employment growth from February 2020 to the present against the pre-
 pandemic hourly wage of non-supervisory workers for all U.S. industries. The
 figure, therefore, measures the extent of industry recovery from the pandemic
 as a function of its wage and highlights the fact that the industries that remain
 furthest from recovery tend to be the lowest-paid jobs. For instance, essential
 services like health care and child care, which were too scarce and costly
 before the pandemic, have seen drastic declines in availability that have
 persisted for many months. Figure 2 also shows that many of these struggling
 industries are historically highly immigrant-intensive.

 A sign of labor markets to come

 Finally and perhaps most worryingly, the current labor shortage may simply be
 the canary in the coal mine, warning us about the consequences of a coming
 population and workforce decline. Since the Great Recession in 2008, the birth
 rate in the U.S. has been falling, recently reaching a historic low. If this trend
 continues, the only way to offset this decline and maintain overall population
 growth will be through greater immigrant inflows. In fact, this is exactly what

Brookings Institution 6
A ROADMAP FOR IMMIGRATION REFORM | IDENTIFYING WEAK LINKS IN THE LABOR SUPPLY CHAIN

 happened following the dramatic decline in the fertility rate during the 1960s—
 as Figure 3 shows steep drop in fertility coincided with a steep rise in the
 immigrant share of the population and, consequently, the U.S. population
 continued to grow in subsequent decades. But the slowing growth in the
 immigrant population evident in Figure 3—driven in large part by the pandemic
 along with Trump-era immigration policies—is now coinciding with an
 accelerated decline in the fertility rate as well. This is a recipe for a
 continuation of the labor market dysfunction that currently plagues the U.S.
 economy.

Figure 3. Immigrant population change and births per women over time

 16 4.0

 14 3.5

 12 3.0

 10 2.5

 8 2.0

 6 1.5

 4 1.0

 2 0.5

 0 0.0
 1960 1970 1980 1990 2000 2010 2021
 Immigrant Share of Population Births per Woman
Data source: U.S. Census data

 Taken together, these facts highlight the need for comprehensive immigration
 reforms accompanied by greater workplace protections for low-wage workers.
 This report focuses on the former while setting aside discussion of broader
 workplace reforms and protections such as those that have been proposed to
 improve working conditions for care workers, manufacturing workers, and
 hospitality workers. Next, we focus on identifying the highest-value
 occupations that these types of immigration reforms should target.

Brookings Institution 7
A ROADMAP FOR IMMIGRATION REFORM | IDENTIFYING WEAK LINKS IN THE LABOR SUPPLY CHAIN

 The Occupational Opportunity
 Network: A roadmap for
 immigration reform
 This section presents our main tool to analyze the role of immigrants in the
 U.S. labor market and to help policymakers modernize the current immigration
 system.

 We create and present a tool to visualize and identify occupations that have
 the following characteristics:

 • Are highly complementary to other occupations in the economy.
 • Will experience high levels of labor demand over the next decade.
 • Have been traditionally filled by immigrants.
 • Require little or no prior specialized training.

 Our analysis is performed for a list of 89 occupations as defined by the
 Standard Occupation Classification (SOC). In what follows we briefly discuss
 the key measures used in our analysis.

 Complementarity between occupations

 We begin by describing our primary metric which is designed to allow
 policymakers to identify occupations that are central to the functioning of the
 U.S. economy because they complement many other occupations. This can
 serve as a starting point for understanding where targeted immigration policy
 can make the biggest difference in alleviating both short- and long-run labor
 supply shortages while raising overall U.S. productivity.

 Workers are complementary to one another to the extent that they bring
 different skills to the workplace that raise the productivity of the workers
 around them. In academic literature, complementarity has been explored
 between workers with different combinations of experience and education.
 Peri (2016) provides a discussion of the trade-offs associated with estimating
 complementarity with different groupings of workers.2

2
 Giovanni Peri, “Immigrants, Productivity, and Labor Markets,” Journal of Economic Perspectives 30, no. 4
(November 1, 2016): 3–30, https://doi.org/10.1257/jep.30.4.3.

Brookings Institution 8

A ROADMAP FOR IMMIGRATION REFORM | IDENTIFYING WEAK LINKS IN THE LABOR SUPPLY CHAIN

 Here we take a somewhat more flexible approach by focusing on occupations
 as the relevant grouping of workers. In this context, complementarity between
 two occupations can be defined as a negative “cross-price elasticity.” For
 instance, consider two occupations, occupation A and occupation B. Suppose
 that we observe that the wage in occupation A goes up and, as a result,
 demand for labor in occupation A goes down. And suppose that in response
 to this same wage change, the demand for workers in occupation B also goes
 down. Since the demand for workers in occupation B went in the opposite
 direction to the wage change in occupation A, we can say that the
 occupations have a negative cross-price elasticity and are therefore
 complementary.

 In practice, we characterize two occupations as being complementary if their
 employment shares move in the same direction within industries over time,
 which is a stronger notion of complementarity than just looking at levels of
 employment.3 On the other hand, a weakness in this measure is that the co-
 movement in employment shares will often arise because the occupations
 experience some common external shocks—for instance, they may be located
 in the same regions of the country or the same industries, and those regions
 or industries may be doing well or poorly. Nevertheless, even this
 “endogenous” co-movement of occupation shares provides information about
 the strength of the relationship between occupations, even if driven by forces
 external to the way they are used in the production process.

 To construct this measure, we use Lightcast Staffing Patterns Data to first
 calculate the change in the share of employment in each occupation within
 industries over the period 2009 to 2019. Next, for each occupation, we
 calculate the pairwise correlation between changes in its employment share
 and the employment shares of all other occupations. As an example, we find
 that the complementarity between “food and beverage serving workers” and
 “cooks and food preparation workers” is 0.49. This number indicates that in at
 least 49 percent of industries when either of the two occupations was both
 present and one of them grew (or shrank) as a share of total employment the
 other one also grew (or shrank). We can also visualize the pattern of
 correlations in a network diagram, which we present below.
 We then create an overall “complementarity index”—ranging from 0 to 1—for
 each occupation by taking the average of all its pairwise complementarity
 values. Importantly, we calculate the pairwise correlations for each industry
 separately; as a result, occupations that appear in a wider range of industries
 are more likely to be present with other occupations and be assigned non-zero

3
 It is stronger because when the share of employment in one occupation rises the share in all others
mechanically fall. So for two occupation shares to move in the same direction this mechanical effect
must be overcome, implying that the two occupations are especially complementary.

Brookings Institution 9
A ROADMAP FOR IMMIGRATION REFORM | IDENTIFYING WEAK LINKS IN THE LABOR SUPPLY CHAIN

 correlations, mechanically boosting their complementarity index. Therefore,
 occupations that serve as inputs across many parts of the economy will be
 deemed to be more complementary, which is a margin of impact that we
 believe adds value to the measure. Appendix A explains the calculation in
 more detail.

Table 1. Top 10 occupations with the highest overall complementarity
 Overall
 Code Name Employment 2019 Complementarity
 37-3000 Grounds Maintenance Workers 962,670 0.254
 43-9000 Other Office and Administrative Support Workers 3,541,850 0.253
 33-9000 Other Protective Service Workers 1,495,880 0.253
 13-2000 Financial Specialists 2,755,470 0.253
 27-3000 Media and Communication Workers 591,650 0.251
 35-3000 Food and Beverage Serving Workers 6,135,730 0.251
 Supervisors of Office and Administrative Support
 43-1000 Workers 1,427,260 0.251
 Supervisors of Installation, Maintenance, and
 49-1000 Repair Workers 475,000 0.250
 41-9000 Other Sales and Related Workers 628,640 0.247
 51-1000 Supervisors of Production Workers 599,900 0.247

Note: This table presents the 10 occupations with the highest overall complementarity according
to our calculations. The first column, the Standard Occupation Classification (SOC), is the code
used in the data for each occupation. Column 2 is the name of the occupation. Column 3 presents
total employment in the U.S. for that occupation for 2019, while Column 4 presents the overall
complementarity.
Source: Report authors

 Table 1 presents the 10 occupations with the highest overall complementarity.
 The most complementary occupation is “grounds maintenance workers,” with
 an overall complementarity of 0.25. This is an example of how tasks requiring
 little formal education can be highly complementary to other tasks in the
 economy. At the same time, the list also includes high-education occupations
 such as financial specialists and media and communication workers that are
 strongly correlated with employment in their respective industries and are also
 used in many different types of industries. We also note that the measure is
 unrelated to the size of the workforce in each occupation.

 Labor demand

 We proxy demand for occupations both nationally and at the Metropolitan
 Statistical Area (MSA) using employment projections from the U.S. Bureau of

Brookings Institution 10
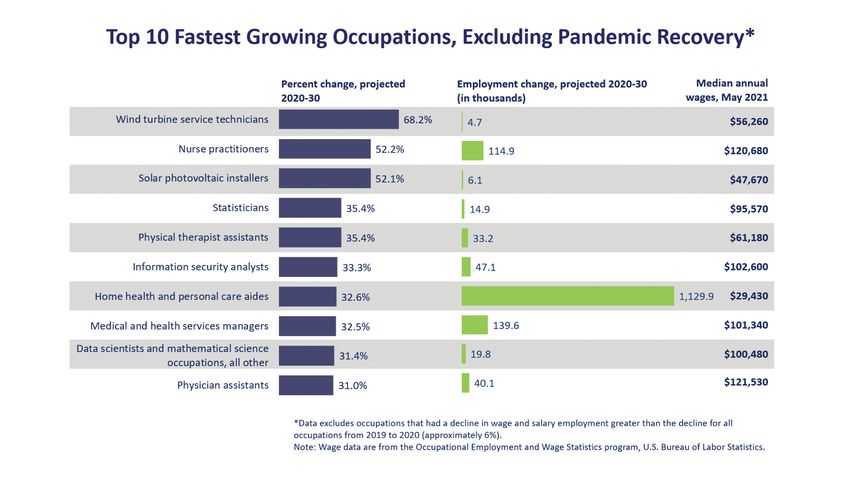
A ROADMAP FOR IMMIGRATION REFORM | IDENTIFYING WEAK LINKS IN THE LABOR SUPPLY CHAIN

 Labor Statistics (BLS). Figure 4 presents the fastest-growing occupations
 according to these projections. We see that some of the fastest growing
 occupations are in health care support, personal care and service, and food
 preparation- and serving-related occupations (though some of this growth is
 clearly due to recovery from the pandemic). Similarly, computer and
 mathematical occupations are expected to see fast employment growth as
 part of the strong demand for IT services in the context of growing telework.

Figure 4.Top 10 fastest-growing occupations, BLS projections 2020-2030

Notes: This figure visualizes the projected percentage and nominal employment change of
occupations in the U.S. over the period 2020 to 2030, as well as the median annual wage for those
occupations in 2020. Data excludes occupations that had a decline in wage and salary
employment greater than the decline for all occupations from 2019-2020 (approximately 6
percent). This list excludes growth due to pandemic recovery.
Source: Occupational Employment and Wage Statistics program, U.S. Bureau of Labor Statistics.

 When focusing our analysis on MSAs we use projections from state Labor
 Departments that are compiled by The Projections Management Partnership.

 Immigrant shares of occupations

 For each occupation, we calculate the share of workers that are foreign-born
 using data from the 2019 American Community Survey. We use the historical
 reliance of each occupation on foreign-born labor as a guide for future
 immigrant needs. Figure 5 shows that migrants play a particularly key role in

Brookings Institution 11
A ROADMAP FOR IMMIGRATION REFORM | IDENTIFYING WEAK LINKS IN THE LABOR SUPPLY CHAIN

 (i) services occupations, (ii) natural resources, construction, and maintenance
 occupations, and (iii) production, transportation, and material moving
 occupations.

Figure 5. Percentage of foreign-born workers by occupation category, 2019

 30.0

 25.0

 20.0

 15.0

 10.0

 5.0

 0.0
 Civilian employed Management, Service Sales and Office Natural Resources, Production,
 age 16 and over Business, Science, Occupations: Occupations: Construction, and Transportation,
 and Arts Maintenance and Material
 Occupations: Occupations: Moving
 Occupations:

Note: This figure visualizes, for each occupational category in the U.S., the percentage of workers
that are foreign-born.
Data source: U.S. census

 Training requirements

 We also exploit data on the extent to which occupations require extensive
 training and preparation to characterize the background that immigrant
 workers will need to fill certain labor supply shortages. Here we rely on the
 Occupational Information Network (O*NET) developed under the sponsorship
 of the U.S. Department of Labor. The O*NET database contains hundreds of
 standardized and occupation-specific descriptors covering almost 1,000 U.S.
 occupations.

 We focus on O*NET Job Zones, which place occupations within one of five
 groups based on the training the occupation requires, where “Job Zone Five”
 requires extensive training and “Job Zone One” requires little to no training.

Brookings Institution 12
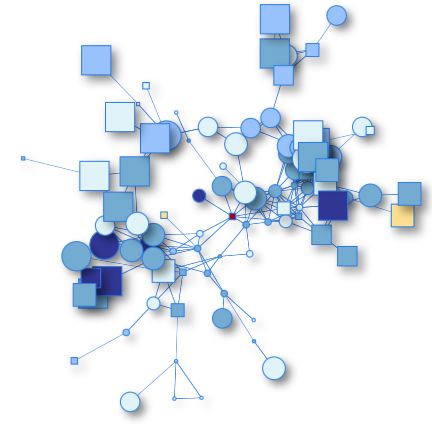
A ROADMAP FOR IMMIGRATION REFORM | IDENTIFYING WEAK LINKS IN THE LABOR SUPPLY CHAIN

 To illustrate, computer occupations are in Job Zone Four, as they require
 considerable training, whereas Grounds Maintenance Workers belong to Job
 Zone One where little or no training is needed.

 Visualizing the network

 In this section, we present the Occupation Opportunity Network (OON) which
 brings the data elements above into a framework to understand the highest-
 value areas of the labor market for immigration reforms targeting workers
 with little formal education. The network assesses all occupations according
 to the four aspects described above. These are occupations (i) with high
 projected levels of growth over the next decade; (ii) that have traditionally
 been filled by immigrants; (iii) that are highly complementary to other
 occupations in the economy; and (iv) that require little or no prior specialized
 training.

 The network is presented in Figure 6. In it, each node represents an
 occupation. The skeleton of the network reflects the bilateral complementarity
 measures detailed above. For visualization purposes, we refrain from showing
 the links between every pair of occupations but rather we visualize the
 network using the minimum spanning tree network approach which highlights
 the strongest five percent of all links in terms of their complementarity.4

 The network also includes other information. The color of the node represents
 the projected job growth (in thousands of jobs) over the period 2020 to 2030.
 The nodes –or occupations—that are in the center of the network tend to be
 highly complementary to all other occupations, while nodes on the outskirts of
 the network represent occupations that tend to have low levels of overall
 complementarity.

 In addition, each node is represented as either a circle or a square according
 to whether it requires prior preparation or training according to the O*NET Job
 Zones indicators. Circles represent jobs that require extensive training (Job
 Zones Three, Four, and Five) and squares represent occupations that require
 little or no prior training (Job Zones One and Two).

 Finally, the size of each node represents the historical immigrant intensity of
 the occupation. The sizes and the corresponding ranges are represented in
 the figure’s legend.

4
 The design and the visualization of our Occupation Opportunity Network, and the underlying
complementarity measure, is highly inspired by and adapted from the work of Hidalgo et al. (2007) and
Hausmann et al. (2014).

Brookings Institution 13
A ROADMAP FOR IMMIGRATION REFORM | IDENTIFYING WEAK LINKS IN THE LABOR SUPPLY CHAIN

Figure 6. The Occupation Opportunity Network

Note: This figure presents the Occupational Opportunity Network, or OON. Each node represents
an occupation.
Source: Report authors

 The highest-value targets for raising productivity through increased
 immigration are (i) toward the center of the network (highly complementary),
 (ii) large (immigrant intensive), and (iii) blue (projected to grow rapidly).
 Finally, square nodes represent occupations that do not require specialized
 training while circle nodes do. For instance, if not required then immigrants
 could potentially “hit the ground running,” whereas if formal preparation is
 required then policymakers may want to consider training programs such as
 Global Skills Partnerships in which immigrants receive training prior to arriving
 in the U.S.5

5
 Michael Clemens and Katelyn Gough, “Global Skill Partnerships: A Proposal for Technical Training in
Settings of Forced Displacement,” n.d., 45.

Brookings Institution 14
A ROADMAP FOR IMMIGRATION REFORM | IDENTIFYING WEAK LINKS IN THE LABOR SUPPLY CHAIN

 For example, “cooks and food preparation” workers is one of the largest
 squares in the middle of the network. Its overall complementarity measure is
 0.24, among the highest of all occupations reflecting the obvious centrality of
 food-making to the economy. This occupation is also projected to grow
 significantly over the next 10 years in the United States, adding nearly 650
 thousand workers. At a national level, about 26 percent of all workers in this
 occupation are foreign-born, indicating that future growth in these jobs will
 rely heavily on a growing immigrant labor force. Finally, this is an occupation
 that requires little training, and therefore immigrants arriving in the U.S. could
 easily fill these positions.

 Other occupations in our framework that have similar characteristics (high
 complementarity, high labor demand, reliance on foreign-born workers, and
 little to no preparation needed) include other occupations in the food industry
 (e.g., waiters), as well as construction workers and transportation workers.
 Given the centrality of these occupations to the economy based on the OON
 metric, it is no surprise that there has been a shortage of these types of front-
 line workers in the aftermath of the COVID-19 pandemic. The high degree of
 complementarity with other occupations also indicates that job growth more
 broadly is being constrained by these shortages.

 Another interesting but different example is “computer occupations,” also
 located in the center of the network with an overall complementarity of 0.19.
 This occupation is projected to grow significantly, adding nearly 670 thousand
 workers over the next decade, and 27 percent of its workers are foreign-born.
 The key difference with cooks and food preparation workers is simply that the
 node denoted by a circle, implying that workers need considerable preparation
 for the job. Other occupations that fall in this category (in high demand, with a
 high share of immigrants, highly complementarity, but with significant training
 needed) include health workers, financial specialists, and vehicle mechanics.

 Application to local economies

 One benefit of our approach is that it can be easily adapted to local
 economies for the use of local governments and policymakers. To do this, we
 use values that are specific to Metropolitan Statistical Areas (MSAs).
 Specifically, we use labor demand projections at the MSA level, marked by the
 color of the nodes, and the baseline share of foreign-born workers in an MSA
 for each occupation, represented by the size of the nodes. The
 complementarity measures and the training characteristics are unchanged
 because they do not depend on local economic conditions.

Brookings Institution 15
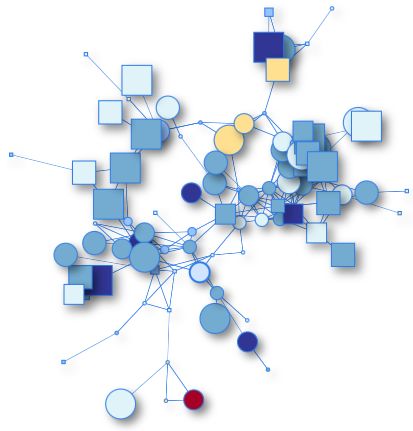
A ROADMAP FOR IMMIGRATION REFORM | IDENTIFYING WEAK LINKS IN THE LABOR SUPPLY CHAIN

 Figure 7 presents the OON for three quite different MSAs: panel (a) for New
 York-Newark-Jersey City (NY-NJ) area; panel (b) for Boise City (ID); and panel
 (c) for Austin-Round Rock (TX).

 As can be seen in the figure, the skeleton of the network is the same, but as
 explained above, the size of the nodes (representing the share of foreign-born
 workers) and the color (representing projected demand) varies by city,
 allowing local policymakers to better understand their own landscape.

 First, all three cities tend to have many occupations in which foreign-born
 workers are an important part of the workforce, as there are several large
 nodes throughout each network. Second, labor demand projections are often
 quite different. In the case of Boise City, for instance, there are many more
 instances where we can expect a downturn in labor demand for occupations
 such as scientists and law enforcement officers. In the case of Austin-Round
 Rock, all occupations are on the rise, whereas in the case of New York-
 Newark-Jersey City, we can expect a downturn in labor demand for
 occupations such as secretaries, printing workers, and communication
 equipment operators.

 Some occupations are in high demand in all three cities, such as cooks and
 food preparation workers, for instance. Interestingly, in all three cities, a large
 share of cooks is foreign-born (an astounding 58 percent in NY-NJ, 19 percent
 in Boise City, and 29 percent in Austin-Round Rock).

Figure 7. The Occupation Opportunity Network at the city level

 (a) New York-Newark-Jersey City (b) Boise City (ID) (c) Austin-Round Rock (TX)
 (NY-NJ)

Source: Report authors

 Since migration policy is primarily set at the federal level, this report focuses
 on national-level indicators to provide overall policy guidance. However,

Brookings Institution 16
A ROADMAP FOR IMMIGRATION REFORM | IDENTIFYING WEAK LINKS IN THE LABOR SUPPLY CHAIN

 looking at policy implications for states, commuting zones, or cities is an
 essential part of our ongoing policy research agenda.

 Immigration and the Occupation Opportunity Network

 Figure 8 below depicts the relationship between overall complementarity and
 the reliance of each occupation on the immigrant workforce. The vertical axis
 measures the share of all workers in an occupation that was born abroad, and
 the horizontal axis tracks our complementarity index.

 Overall, the pattern in the figure indicates that immigrants tend to work in
 occupations that are more central to the overall workforce, in effect
 supporting millions of American workers.

 This is consistent with the literature, which often finds little or no effect of
 low-education immigrant inflows on native outcomes. While in some cases
 immigrants may crowd out native-born workers, they are also raising overall
 productivity and job creation through their complementarity with other types
 of work. In fact, this is consistent with evidence that, on average, immigrants
 may generate upward economic mobility for many native-born workers.6

6
 Giovanni Peri, “The Effect Of Immigration On Productivity: Evidence From U.S. States,” Review of
Economics and Statistics 94, no. 1 (February 2012): 348–58, https://doi.org/10.1162/REST_a_00137.

Brookings Institution 17
A ROADMAP FOR IMMIGRATION REFORM | IDENTIFYING WEAK LINKS IN THE LABOR SUPPLY CHAIN

Figure 8. Overall complementarity and the reliance of each occupation on the immigrant
workforce

Source: Report authors

 The relationship is even more remarkable when looking at occupations
 classified in “Job Zone One” or “Job Zone Two”, which are occupations for
 which workers need little to no prior training. These occupations are
 fundamental to the economy in terms of their overall complementarity and
 many of them have a share of foreign-born workers that is much higher than
 the average in the economy of about 17 percent. In fact, foreign-born workers
 in the top 10 occupations in Job Zones One and Two represent about 19
 percent of the workforce.

 This figure supports the notion that immigrants work in occupations that are
 central to the economy.

Brookings Institution 18
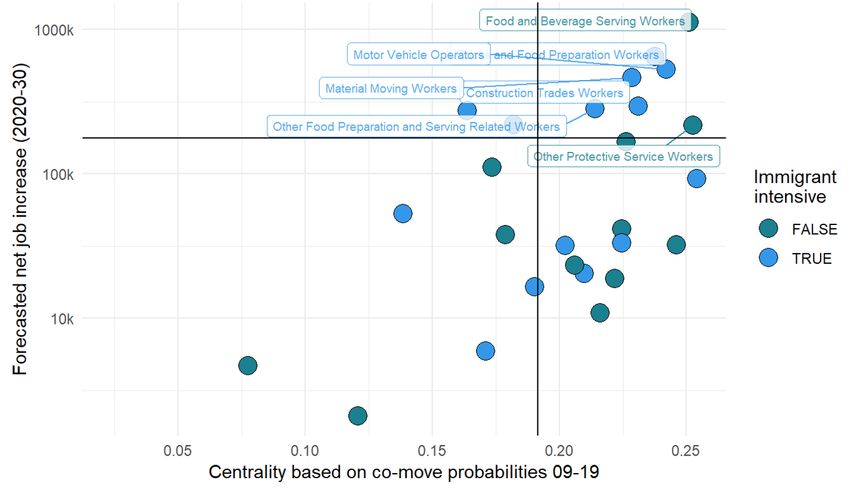
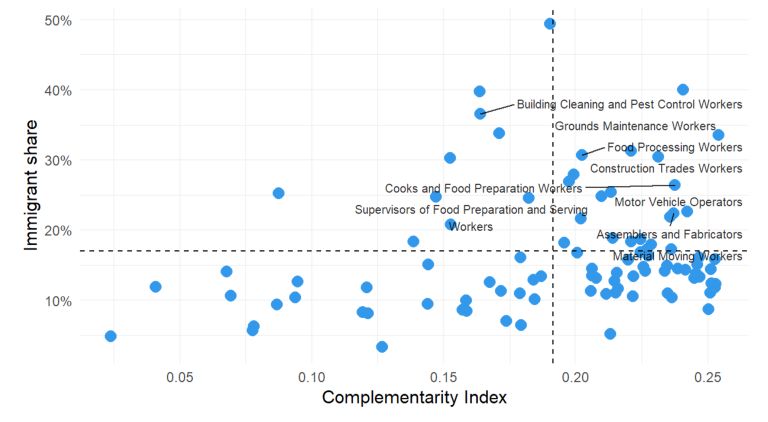
A ROADMAP FOR IMMIGRATION REFORM | IDENTIFYING WEAK LINKS IN THE LABOR SUPPLY CHAIN

 Policy insights
 This framework provides a guide for policymakers to identify the occupations
 that require the most attention in the context of U.S. immigration policy over
 the next decade. To do that, we incorporate all the variables that we used in
 the network above to produce two different sets of policy recommendations,
 first for occupations that do not require prior training and, second, for those
 that do.

 Occupations that do not require prior training

 Figure 9 presents a scatter plot in which each observation is an occupation.
 The horizontal axis measures the overall complementarity of the occupation
 based on the measure described above and the vertical axis measures the
 projected demand for those occupations between 2020 to 2030, also
 described above.

 The color of the observations mark whether such occupation is “immigrant
 intensive,” meaning that the share of foreign-born workers in that occupation
 in 2019 was above or below 17 percent, which corresponds to the national
 average for foreign-born workers. Blue dots are immigrant intensive while
 green dots are not. Of course, the fact that a particular occupation historically
 had a large share of foreign-born workers does not mean that in the future
 that pattern will remain the same, but it is informative about the type of work
 that the U.S. economy currently relies on immigrant workers to do. Given the
 labor market forecast for the next ten years, it is important to recognize that
 foreign-born workers will continue to be an important part of the workforce
 absent drastic changes to the U.S. labor market.

Brookings Institution 19
A ROADMAP FOR IMMIGRATION REFORM | IDENTIFYING WEAK LINKS IN THE LABOR SUPPLY CHAIN

Figure 9. Overall complementarity (centrality) and forecasted growth

Source: Report authors

 The figure is divided into four quarters. The horizontal axis marks the 25th
 percentile of employment growth, while the vertical line is the mean of the
 overall complementarity measure. We thus focus on all observations in the
 upper right quadrant of the graph, which are occupations that are forecast to
 see rapid growth and, at the same time, are highly complementary to the
 existing workforce.

 Table 2 lists those occupations in the upper right quadrant, which are the ones
 we believe deserve the most focus in terms of their needs, their overall
 complementarity, and the large historical reliance on immigrants in some
 cases. These occupations do not need extended preparation or training so
 that immigrants with little to no formal training could fill the demand for these
 positions.

Brookings Institution 20
A ROADMAP FOR IMMIGRATION REFORM | IDENTIFYING WEAK LINKS IN THE LABOR SUPPLY CHAIN

 Table 2. Fast-growing, immigrant-intensive occupations

 Forecast Growth Overall % Foreign-born
Occupation Jobs in 2020
 2020-2030 Complementarity workers (2019)
Food and Beverage Serving Workers 1119.7 k 6135.7 k 0.251 14.50

Cooks and Food Preparation 647.2 k 2977.7 k 0.238 26.40
Workers
Motor Vehicle Operators 528.8 k 3976.4 k 0.242 22.60

Material Moving Workers 465.3 k 6921.9 k 0.228 18.00

Construction Trades Workers 294 k 4430.3 k 0.231 30.40

Other Food Preparation and Serving 281.8 k 1156.4 k 0.214 18.90
Related Workers
Other Protective Service Workers 217.4 k 1495.9 k 0.253 11.80

 Source: Report authors

 An initial step could be to start with low-hanging fruit like the Farm Workforce
 Modernization Act, a bill proposed in the House by Republican Dan Newhouse.
 This would provide a wide range of benefits including reducing food prices
 and ensuring migrant farmworkers are documented.

 Congress should also expand the H-2B visa cap for non-agriculture temporary
 workers while also allowing for approval of multiple years of employment to
 reduce the burden on firms from the annual application process. As of today,
 the program is capped at 66 thousand visas per year, which is clearly far too
 small, even in the context of the occupations listed above that require only
 seasonal work such as those in sectors like construction or hospitality.

 However, the H-2B is clearly insufficient for occupations and employers with
 longer-term employment horizons and there are few other tools that can be
 used by employers to sponsor immigrants with low levels of formal education.
 To address this, the U.S. should start by approving asylum claims at a far
 higher rate, as thousands of deserving applicants are currently denied or
 wrongly expelled. This would require increasing funding for all agencies
 responsible for the processing of asylum seekers and streamlining the inter-
 agency asylum process and provision of wraparound services. Admitting
 additional asylum seekers would serve both labor market and humanitarian
 goals.

 Another option would be to add state-based visas to the policy toolkit.
 Congressional legislation to pilot this type of visa program has been proposed
 previously. State-based visas would allow states to issue temporary or

 Brookings Institution 21
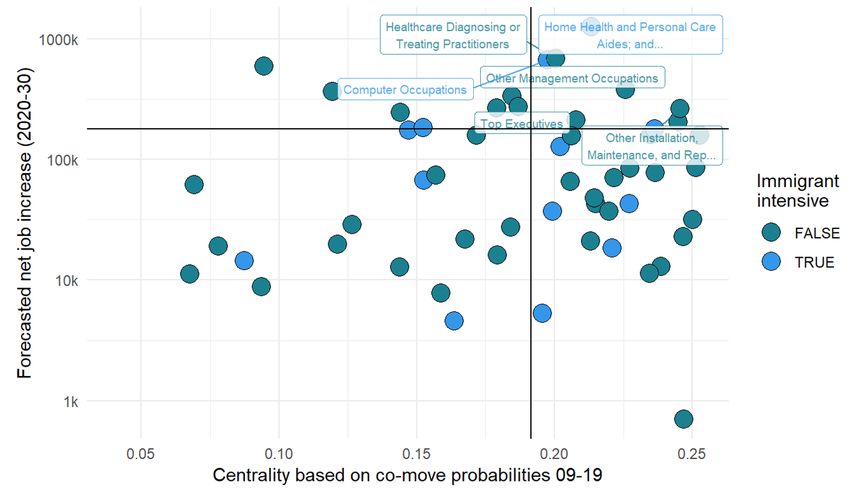
A ROADMAP FOR IMMIGRATION REFORM | IDENTIFYING WEAK LINKS IN THE LABOR SUPPLY CHAIN

 permanent work visas (depending on the legislation), giving them the flexibility
 to admit the number of immigrants that serve state-level needs. Benefits
 include the ability to more easily target regions of the country with labor
 supply shortages; the potential for an easing of undocumented border
 crossings; and the potential to lower the temperature on the immigration
 debate by giving states more control over immigration policy. In fact, similar
 policies are in place in Canada and Australia and could be adapted for the U.S.
 The primary downside is that this policy also restricts the movement of
 immigrants within the country, which would be costly.

 Occupations for which prior and substantive training is required

 Figure 9 below presents an analogous visualization but focuses on
 occupations that require significant prior training (those in Job Zones Three to
 Five), which are also in high demand, and are highly complementary to the
 overall workforce. Again, our focus is on the occupations in the upper right
 quadrant. As can be seen, some of these occupations are intensive in foreign-
 born workers, having a share of immigrant workers that exceeds the national
 share of 17 percent as of 2019.

Figure 10. Overall complementarity (centrality) and forecasted growth, training required

Source: Report authors

Brookings Institution 22
A ROADMAP FOR IMMIGRATION REFORM | IDENTIFYING WEAK LINKS IN THE LABOR SUPPLY CHAIN

 Table 3 below lists eight occupations that make the cut according to our
 analysis, sorted from largest to smallest in terms of their forecast growth until
 2030. The first two in the list are “home health and personal care aides; and
 nursing assistants, orderlies, and psychiatric aides” and “health care
 diagnosing or treating practitioners.” This is not a surprise given that
 healthcare workers are in high demand and immigrants could play a
 significant role in filling those vacancies. In fact, over 25 and 16 percent of all
 workers in those two occupations were foreign-born. They are also very large
 occupations–with about 10 million jobs combined in 2020—and are expected
 to grow by nearly 2 million over the next decade. Both are highly
 complementary occupations to the workforce in general.

 “Personal care and service workers” also make the list and will grow by nearly
 180 thousand workers by 2030, up from the current 2.4 million.

 Table 3. Fast-growing, immigrant-intensive occupations, training required

 Forecast
 Overall % Foreign-born
Occupation Growth 2020- Jobs in 2020
 Complementarity workers (2019)
 2030
Home Health and Personal Care Aides; and
Nursing Assistants, Orderlies, and
Psychiatric Aides 1252.4 k 4677.8 k 0.213 25.40
Health care Diagnosing or Treating
Practitioners 685.9 k 5611.6 k 0.201 16.70

Computer Occupations 667.6 k 4368 k 0.197 26.90

Other Management Occupations 377 k 2569.9 k 0.226 14.70
Other Installation, Maintenance, and Repair
Occupations 265.2 k 2932.8 k 0.246 13.90

Top Executives 213.4 k 2601.1 k 0.208 13.20

Other Teachers and Instructors 204.7 k 1086.8 k 0.245 13.20

Other Personal Care and Service Workers 179.4 k 2401.7 k 0.236 17.30

 Source: Report authors

 Our analysis offers important directions for migration policy over the next
 decade, as the U.S. government must plan enough legal pathways to attract
 immigrants to fill the demand in these fast-growing occupations. If we
 combine forecast growth with the current immigrant shares and focus only on
 the list in Table 3, the U.S. will require nearly 800 thousand additional high-
 skilled, immigrant workers. And this does not include any of the other
 occupations that will also need foreign workers.

 Brookings Institution 23
A ROADMAP FOR IMMIGRATION REFORM | IDENTIFYING WEAK LINKS IN THE LABOR SUPPLY CHAIN

 As of today, the H-1B visa program—the visa for high-skill workers in the U.S.—
 is capped at 65 thousand workers a year, plus another 20 thousand workers
 who had completed graduate school in the U.S. This cap has not been
 adjusted since the early 2000s, despite economic growth and the natural
 growth of the workforce. Companies in the need of these workers, particularly
 the ones in our list which include occupations that are highly complementary
 to the workforce, will not be able to meet demand without a significant
 increase in the cap for these workers, affecting the U.S. economy at large.

 The nature of these occupations also makes them a perfect candidate for the
 Global Skills Partnership concept envisioned by Michael Clemens (CITE).
 Clemens proposes that as part of its global development strategy the U.S.
 could invest in the skills of potential immigrants while they are still in their
 home countries and could specifically target the skills needed to fill high-
 demand jobs in the U.S. This training could then be linked to visa programs in
 a way that is coherent and consistent with those needs. Our framework
 provides a guide for identifying the jobs that could be targeted in such a
 program.

Brookings Institution 24
A ROADMAP FOR IMMIGRATION REFORM | IDENTIFYING WEAK LINKS IN THE LABOR SUPPLY CHAIN

 Conclusions
 A thriving workforce will always be growing, as new workers enter to fill
 opportunities at the bottom rungs of the career ladder and more experienced
 workers move up. But this process has broken down, with strong upward
 mobility for U.S. workers over the past two years leaving few workers willing
 to do relatively low-paid work. In some sectors—like child care and
 hospitality—this has been the situation for many years but has reached
 extreme levels post-pandemic. These sectors, and others, are now entirely
 dysfunctional, supplying far fewer of their services than are demanded. This
 represents a significant loss for society and could be easily fixed by relaxing
 any number of constraints on current levels of immigration.

 We have also shown that this problem will only worsen, as BLS estimates of
 employment growth over the next 10 years will be disproportionately within
 immigrant-intensive occupations. This is potentially a crisis in the making
 given that severe labor shortages will raise prices; reduce women’s labor
 supply; reduce the quantity and quality of child and elder care; reduce the
 competitiveness of U.S. innovation; hamper small business growth; and
 reduce the variety of goods and services, among other outcomes. In short,
 without a significant increase in immigration over the next few years,
 Americans’ standard of living will fall.

 This report has highlighted these problems while also providing a guide to
 understanding where the greatest labor market pressures currently are and
 where they will grow over the next decade. We hope that our Occupational
 Opportunity Network and the broader discussion presented here can be useful
 for motivating and directing needed immigration policy.

Brookings Institution 25
A ROADMAP FOR IMMIGRATION REFORM | IDENTIFYING WEAK LINKS IN THE LABOR SUPPLY CHAIN

References
 1. “A-31. Unemployed Persons by Industry, Class of Worker, and Sex.” Accessed August 27,
 2022. https://www.bls.gov/web/empsit/cpseea31.htm.
 2. Borjas, George J., Jeffrey Grogger, and Gordon H. Hanson. “COMMENT: ON ESTIMATING
 ELASTICITIES OF SUBSTITUTION.” Journal of the European Economic Association 10, no.
 1 (2012): 198–210.
 3. Card, David. “Immigration and Inequality.” American Economic Review 99, No. 2 (April 1,
 2009): 1–21. https://doi.org/10.1257/aer.99.2.1.
 4. Card, David, and Thomas Lemieux. “Can Falling Supply Explain the Rising Return to
 College for Younger Men? A Cohort-Based Analysis.” QUARTERLY JOURNAL OF
 ECONOMICS, n.d., 47.
 5. Clemens, Michael, and Katelyn Gough. “Global Skill Partnerships: A Proposal for
 Technical Training in Settings of Forced Displacement,” n.d., 45.
 6. Social Security Administration Research, Statistics, and Policy Analysis. “Coping with the
 Demographic Challenge: Fewer Children and Living Longer.” Accessed August 27, 2022.
 https://www.ssa.gov/policy/docs/ssb/v66n4/v66n4p37.html.
 7. Goldin, Claudia, and Lawrence F. Katz. The Race Between Education and Technology.
 Belknap Press for Harvard University Press, 2008.
 8. US-Mexico Foundation. “Labor Mobility.” Accessed August 27, 2022.
 https://www.usmexicofoundation.org/labormobility.
 9. Ottaviano, Gianmarco I. P., and Giovanni Peri. “RETHINKING THE EFFECT OF
 IMMIGRATION ON WAGES.” Journal of the European Economic Association 10, No. 1
 (2012): 152–97.
 10. Peri, Giovanni. “Immigrants, Productivity, and Labor Markets.” Journal of Economic
 Perspectives 30, no. 4 (November 1, 2016): 3–30. https://doi.org/10.1257/jep.30.4.3.
 11. ———. “The Effect Of Immigration On Productivity: Evidence From U.S. States.” Review of
 Economics and Statistics 94, no. 1 (February 2012): 348–58.
 https://doi.org/10.1162/REST_a_00137.
 12. “Table 1. Job Openings Levels and Rates by Industry and Region, Seasonally Adjusted -
 2022 M06 Results.” Accessed August 27, 2022.
 https://www.bls.gov/news.release/jolts.t01.htm.

Brookings Institution 26
A ROADMAP FOR IMMIGRATION REFORM | IDENTIFYING WEAK LINKS IN THE LABOR SUPPLY CHAIN
Appendix
Complementarity measure
The first step to compute the share of employment of each occupation in each industry is as
follows:
!"#
ℎ !"# =
∑" !"#
Where i indexes an industry, o indexes an occupation, and t indexes time. With our time
variation, we then can compute for each occupation and industry the difference in shares,
organized in an industry-occupation matrix, defined as:
Δ!"# = ℎ !",%&'( − ℎ !",%&&(
We then create two binary matrices. The first one, !" !)*+,-., where entries are defined as 1 if
the share of occupation o in industry i increased between 2009 and 2019, or 0 if otherwise.
Formally:
1 Δ!" > 0
!" !)*+,-., = -
0 ℎ
We also create a second matrix, !" 0,*+,-., , where entries are defined as 1 if the share of
occupation o in industry i decreased between 2009 and 2019, or 0 if otherwise. Formally:
1 Δ!" < 0
!" 0,*+,-., = -
0 ℎ
Matrix !" !)*+,-., is used to create an occupation-occupation matrix, Φ","1 !)*+,-., , where each
cell represents the minimum probability that occupations o and o’ increased their shares within
the same industry, across all industries. Formally:
Φ","1 !)*+,-., , = min { > !" !)*+,-., = 1? !"1 !)*+,-., = 1@, { > !"1 !)*+,-., = 1? !" !)*+,-., = 1@}
Analogously, we do the same thing using matrix !" 0,*+,-., as an input to compute the
analogous matrix Φ","1 0,*+,-., .
These two matrices capture the complementarity of two occupations. The first one !" !)*+,-.,
is based on two occupations growing in shares at the same time within an industry, while the
second one, !" 0,*+,-., , is based on two occupations shrinking at the same time. This is
important because we want to capture complementarity using both mechanisms.
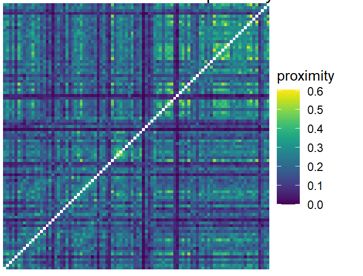
Brookings Institution 27A ROADMAP FOR IMMIGRATION REFORM | IDENTIFYING WEAK LINKS IN THE LABOR SUPPLY CHAIN Then, we come up with a single complementarity measure, matrix Φ","1 , which takes the minimum value between the two matrices described above. Formally: Φ","1 = min (Φ","! !)*+,-., , Φ","! 0,*+,-., ) By taking the minimum we are being conservative in constructing our measure. Φ","1 is the main component of our network. A visualization of this occupation-occupation matrix is presented in Figure A1, where darker colors imply less complementarity and lighter (yellow) colors represent more complementarity between occupations, according to our measure. Its values, being a probability, distribute between zero and one. Figure A2 visualizes the distribution of Φ","1 , where values distribute between 0 and 0.8, though Φ","1 0.4 approximately.7 Note that our method to compute complementarity is highly inspired by and adapted from the work of Hidalgo et al. (2007) and Hausmann et al. (2014) who compute measures of proximity between industries based on the countries that export them. 7 Throughout our attempts to create a complementarity measure between occupations, we also tried a measure that exploits the continuity of the data when it comes the change in shares, by computing a measure that correlates between the change in shares between 2009 and 2019 across occupations for all. However, using this measure, high positive correlation coefficients would indicate that occupations grew significantly across industries, while negative coefficients would indicate that occupation shares for the most part went in different directions over time. However, this metric presents an important disadvantage: it is biased towards occupation pairs with substantial changes in shares, which in turn is typically common among small occupations. Despite this bias, we do find consistencies Therefore, we decided to use the measure explained above. Brookings Institution 28
A ROADMAP FOR IMMIGRATION REFORM | IDENTIFYING WEAK LINKS IN THE LABOR SUPPLY CHAIN

Figure A1: Pairwise complementarity

Note: This figure visualizes the ","1 matrix, with each cell representing an occupation-occupation
pair. The diagonal is blank as we do not compute the complementarity of an occupation with
itself.
Source: Authors’ calculation.

Figure A2: Occupation Complementarity Distribution

Note: This figure visualizes the distribution of the values of the matrix.
Source: Authors’ calculation.

With these measures, we can create an overall complementarity index (or centrality) by simply
averaging for each occupation all the bilateral complementarities with each other occupation.
Thus, if the measure of overall complementarity for a given occupation is, say, 0.23, it could be
interpreted as when that occupation grows in share, on average, 23 percent of all other

Brookings Institution 29
A ROADMAP FOR IMMIGRATION REFORM | IDENTIFYING WEAK LINKS IN THE LABOR SUPPLY CHAIN

occupations also grow. Occupations with high levels of overall complementarity tend to be
occupations that are quite central in the workforce.

Figure A3 presents some basic correlations between our measure of overall complementarity
and other characteristics of the occupation. In it, we find a positive and significant correlation
with immigration intensity; a slightly negative correlation with median wages for that
occupation, though not statistically significant; a positive and significant correlation with the
total number of employees in that occupation (e.g., complementary occupations employ more
people); and a positive and significant correlation between overall complementarity and ubiquity
of the occupation (defined as the extent to which that occupation is present in a large number
of industries), which simply implies that occupations that are present in more industries are
typically more central to the economy.

Figure A3: Correlations between overall complementarity and occupations characteristics

Note: This figure visualizes the correlations between our measure of overall complementarity for
occupations against a number of other occupation-level characteristics.
Source: Authors’ calculation.

Brookings Institution 30
1775 Massachusetts Ave NW
Washington, DC 20036
(202) 797-6000
www.brookings.edu
You can also read