A recovery network leads to the natural recolonization of an archipelago and a potential trailing edge refuge
←
→
Page content transcription
If your browser does not render page correctly, please read the page content below
Ecological Applications, 0(0), 2021, e02416
© 2021 by the Ecological Society of America

        A recovery network leads to the natural recolonization of an
              archipelago and a potential trailing edge refuge
 MATTHEW M. SMITH     ,1,9 JONATHAN H. GILBERT,2 ERIK R. OLSON,3 KIM T. SCRIBNER,4,5 TIMOTHY R. VAN DEELEN,1
       JULIE F. VAN STAPPEN,6 BRONWYN W. WILLIAMS,4,5,7 JAMES E. WOODFORD,8 AND JONATHAN N. PAULI1
                 1
                  Department of Forest and Wildlife Ecology, University of Wisconsin, Madison, Wisconsin 53706 USA
                           2
                            Great Lakes Indian Fish and Wildlife Commission, Odanah, Wisconsin 54861 USA
                         3
                           Department of Natural Resources, Northland College, Ashland, Wisconsin 54806 USA
                 4
                   Department of Fisheries and Wildlife, Michigan State University, East Lansing, Michigan 48824 USA
                   5
                     Department of Integrative Biology, Michigan State University, East Lansing, Michigan 48824 USA
                       6
                        Apostle Islands National Lakeshore, National Park Service, Bayfield, Wisconsin 54814 USA
               7
                Research Laboratory, North Carolina Museum of Natural Sciences, Raleigh, North Carolina 27699 USA
     8
       Bureau of Natural Heritage Conservation, Wisconsin Department of Natural Resources, Rhinelander, Wisconsin 54501 USA

             Citation: Smith, M. M., J. H. Gilbert, E. R. Olson, K. T. Scribner, T. R. Van Deelen, J. F. Van Stappen, B. W.
             Williams, J. E. Woodford, and J. N. Pauli. 2021. A recovery network leads to the natural recolonization of an
             archipelago and a potential trailing edge refuge. Ecological Applications 00(00):e02416. 10.1002/eap.2416

                 Abstract. Rapid environmental change is reshaping ecosystems and driving species loss
             globally. Carnivore populations have declined and retracted rapidly and have been the target of
             numerous translocation projects. Success, however, is complicated when these efforts occur in
             novel ecosystems. Identifying refuges, locations that are resistant to environmental change,
             within a translocation framework should improve population recovery and persistence. Ameri-
             can martens (Martes americana) are the most frequently translocated carnivore in North
             America. As elsewhere, martens were extirpated across much of the Great Lakes region by the
             1930s and, despite multiple translocations beginning in the 1950s, martens remain of regional
             conservation concern. Surprisingly, martens were rediscovered in 2014 on the Apostle Islands
             of Lake Superior after a putative absence of >40 yr. To identify the source of martens to the
             islands and understand connectivity of the reintroduction network, we collected genetic data
             on martens from the archipelago and from all regional reintroduction sites. In total, we geno-
             typed 483 individual martens, 43 of which inhabited the Apostle Islands (densities 0.42–
             1.46 km−2). Coalescent analyses supported the contemporary recolonization of the Apostle
             Islands with progenitors likely originating from Michigan, which were sourced from Ontario.
             We also identified movements by a first-order relative between the Apostle Islands and the
             recovery network. We detected some regional gene flow, but in an unexpected direction: indi-
             viduals moving from the islands to the mainland. Our findings suggest that the Apostle Islands
             were naturally recolonized by progeny of translocated individuals and now act as a source back
             to the reintroduction sites on the mainland. We suggest that the Apostle Islands, given its pro-
             tection from disturbance, complex forest structure, and reduced carnivore competition, will act
             as a potential refuge for marten along their trailing range boundary and a central node for
             regional recovery. Our work reveals that translocations, even those occurring along southern
             range boundaries, can create recovery networks that function like natural metapopulations.
             Identifying refuges, locations that are resistant to environmental change, within these recovery
             networks can further improve species recovery, even within novel environments. Future
             translocation planning should a priori identify potential refuges and sources to improve short-
             term recovery and long-term persistence.
               Key words: American marten; Apostle Islands National Lakeshore; coalescence; heterogeneity; Martes
             americana; population genetics; reintroduction.

                                                                     the combination of land-use and climate change have
                          INTRODUCTION
                                                                     isolated and extirpated numerous vertebrate populations
   Rapid environmental change is reshaping the compo-                (Laliberte and Ripple 2004). Recovering these popula-
sition and structure of ecosystems globally. In particular,          tions has motivated conservation biologists for over a
                                                                     century (Seddon et al 2014). Environmental change pre-
                                                                     sents challenges for conservation because recovery must
  Manuscript received 10 February 2021; accepted 22 March
2021; final version received 13 July 2021. Corresponding Editor:
                                                                     occur in novel ecosystems—systems that are dissimilar
Paul C. Cross.                                                       to historical baselines and often without analog else-
  9
    E-mail: mmsmith9@wisc.edu                                        where (Radeloff et al. 2015). A species response to

                                                        Article e02416; page 1
Ecological Applications
Article e02416; page 2                       MATTHEW M. SMITH ET AL.                                          Vol. 0, No. 0

novelty is often unknown, and complicates efforts to          2007). This historic legacy has left contemporary forests
recover declining or extirpated populations (Hobbs et al.     in the Great Lakes region that are different in composi-
2006). Species recovery, then, represents a “wicked prob-     tion and structure: 44% loss of medium- to large-
lem” in conservation, in which multiple and complex dri-      diameter trees, a threefold increase in early successional
vers need to be simultaneously addressed to arrive at         species, and a near complete loss of eastern hemlock
potential solutions (Defries and Nagendra 2017).              (Tsuga canadensis) and pine (Pinus spp.) forest cover
   Translocations are used to repatriate species to areas     (22% to 1% [White and Mladenoff 1994, Rhemtulla et
once occupied or augment existing populations (Griffith       al. 2009]). Concomitant with regional forest change and
et al. 1989, Seddon et al. 2007). Although identifying        homogeneity, a number of forest carnivores that were
factors that lead to translocation success can be difficult   once widespread—American martens (Martes ameri-
(Fischer and Lindenmayer 2000), successful transloca-         cana), fishers (Pekania pennanti), Canada lynx (Lynx
tions generally occur in high-quality habitat, featuring a    canadensis), gray wolves (Canis lupus)—were extirpated
large number of incipient individuals (Deredec and            from most of the Great Lakes region (Petersen et al.
Courchamp 2007, Tracy et al. 2011). However, many             1977, Thiel 1987, Mech 1995, Williams et al. 2007) or
translocations are unsuccessful, because they increas-        persisted in small and isolated populations (De Vos
ingly occur in novel ecosystems and fail to mitigate con-     1964).
ditions that led to the initial extirpation (Armstrong and       Because of the disproportionate effects of carnivores
Seddon 2008, Osborne and Seddon 2012). To improve             on ecosystems (Estes et al. 2011, Ritchie et al. 2012) and
translocation success, biogeographical concepts like          their global decline in abundance and distribution (Rip-
metapopulation dynamics are increasingly being inte-          ple et al. 2014), carnivores are among the most fre-
grated into reintroduction biology, especially to the iden-   quently translocated species (Seddon et al. 2005).
tification of potential refugia (Armstrong and Seddon         However, because of slow life histories, large spatial
2008).                                                        requirements, and low population densities, transloca-
   Refuge or “pseudosource” (Vuilleumier et al. 2007,         tions are often unsuccessful (Griffith et al. 1989, Miller
Elkin and Possingham 2008) populations are large and          et al. 1999). American martens are the most frequently
demographically growing populations that provide con-         translocated (>50 times) carnivore in North America,
sistent immigrants that can enhance recruitment for the       yet translocation success rate is low (
Xxxxx 2021 RECOLONIZATION OF A POTENTIAL REFUGE Article e02416; page 3
photographic records dating martens back to 2010. To that were used for the most recent augmentation into
date, martens have been detected on 8 of 22 islands Wisconsin (Woodford et al. 2013, Manlick et al. 2016),
(Allen et al. 2018). and harvested martens from Ontario (N = 61; 2004–
Since 2004, martens have been noninvasively geno- 2005 [Manlick et al. 2016, Grauer et al. 2017]). Lastly,
typed (Pauli et al. 2010) across the Great Lakes region, we used samples of Pacific martens from Colorado
resulting in the genetic tagging of >800 individuals (Wil- (N = 29 [Grauer et al. 2017]), as this is the most likely
liams et al. 2009, Williams and Scribner 2010, Koen et species that was translocated to the Apostle Islands in
al. 2012, Manlick et al. 2016, Grauer et al. 2017, Man- the 1950s (Woodford and Dumyahn 2011). In total, 440
lick et al. 2018, Grauer et al. 2019). Genetic tagging of genotyped martens from the recovery network were
martens has quantified the demographic attributes and included in our analyses (Fig. 1a). On the Apostle
processes of subpopulations (Williams et al. 2009, Man- Islands (WI-AI), we collected hair samples from nonin-
lick et al. 2016, Grauer et al. 2019), impact of augmenta- vasive hair traps (modified from Pauli et al. [2008]) set
tion on a reintroduced population (Manlick et al. 2016), at random locations with a minimum of 500 m apart in
influence of immigration on recovering populations 2017 and 2018. Given the discrete nature of the popula-
(Grauer et al. 2019), effect of founding populations tions, historical translocation events, and local manage-
(Williams and Scribner 2010, Grauer et al. 2017, Man- ment strategies, we maintained the use of previously
lick et al. 2018), and landscape features that influence identified and geographic populations in our analyses.
genetic structure (Koen et al. 2012, Howell et al. 2016).
Despite extensive research on individual translocations,
Genotyping and individual identification
it is unclear how well these subpopulations are con-
nected and how the relationships of these subpopula- We extracted DNA from hair samples using QIAamp
tions could create a recovery network and aid in species DNA micro kit (Qiagen, Valencia, California, USA) in a
recovery along this trailing range boundary. room dedicated to low-quality DNA samples. We devel-
Herein, we describe a recovery network following oped a species-specific quantitative polymerase chain
extensive translocations and explore the potential role of reaction (PCR) assay for American marten designed
sites to act as a current and future refuge for recovery. from previously published mitochondrial DNA
We employed a combination of genetic data and coales- (mtDNA) sequences obtained from GenBank (see
cence simulations to identify the source and timing of Appendix S1: Table S1 and Supporting Methods for
marten recolonization of the Apostle Islands, estimate detailed description). Samples that were positive for
the genetic structure and diversity of each subpopulation marten mitochondrial DNA were genotyped at 14 poly-
and across all subpopulations, and to quantify the morphic microsatellite loci: Ma1, Ma2, Ma5, Ma7,
degree of and directionality of connectivity within the Ma8, Ma11, Ma14, Ma19, Gg3, Gg7, and Tt4 (Davis
potential recovery network. Ultimately, through our and Strobeck 1998); and Mer022, Mer041, and Mvis072
regional analysis, we aimed to understand how decades (Fleming et al. 1999). We combined microsatellite loci
of disjunct translocations can shape species recovery at into two multiplexes (MP1: Ma1, Ma2, Ma11, Ma14,
regional and landscape scales and assess the differential Gg7, Mer022; MP2: Ma5, Ma7, Ma8, Ma19, Tt4, Gg3,
importance that individual subpopulations play in spe- Mer041, Mvis072) and validated amplification and frag-
cies recovery. Additionally, we explored the fundamental ment lengths from previously genotyped individuals. For
attributes leading to the colonization and expansion of Multiplex 1, PCRs were conducted in 10-μL reactions
a repatriated species to inform future translocation containing 2 μL of DNA, 2X Multiplex PCR Mastermix
planning. (Qiagen), and labeled primers (FAM, VIC, and NED)
with the following concentrations: Ma1 (0.2 μmol/L),
Ma2 (0.2 μmol/L), Ma11 (0.15 μmol/L), Ma14 (0.5
METHODS
μmol/L), Gg7 (0.08 μmol/L), and Mer022 (0.5 μmol/L).
For Multiplex 2, PCRs were conducted in 10-μL reac-
Sampling
tions containing 2 μL of DNA, 2X Multiplex PCR
To quantify levels of genetic diversity within and levels Mastermix (Qiagen), 1XL Q-solution (Qiagen), and
of differentiation among subpopulations, and gene flow labeled primers (FAM, VIC, and NED) with the follow-
within a recovery network, we used previously geno- ing concentrations: Ma5 (0.2 μmol/L), Ma7 (0.2 μmol/
typed individuals from seven putative subpopulations L), Ma8 (0.2 μmol/L), Mer041 (0.2 μmol/L), Mvis072
(Fig. 1a). We used genetic samples from individuals in (0.2 μmol/L), Gg3 (0.15 μmol/L), Ma19 (0.1 μmol/L),
two geographically disjunct subpopulations in Wiscon- and Tt4 (0.05 μmol/L). PCR conditions for both multi-
sin (WI-CF: N = 48 and WI-NF: N = 46; 2007–2017 plexes included an initial denature at 94°C for 15 min,
[Manlick et al. 2016, Grauer et al. 2017]), three putative 40 cycles of 94°C for 30 s, 57 for 90 s, 72°C for 60 s, and
subpopulations in Michigan identified from genetic a final elongation at 60°C for 30 min. We analyzed sam-
assignment tests (MI-Central, MI-Eastern, MI-Western; ples on an ABI 3730xl DNA analyzer (Applied Biosys-
N = 65 per population; 2004 [Williams and Scribner tems, Foster City, California, USA), and scored
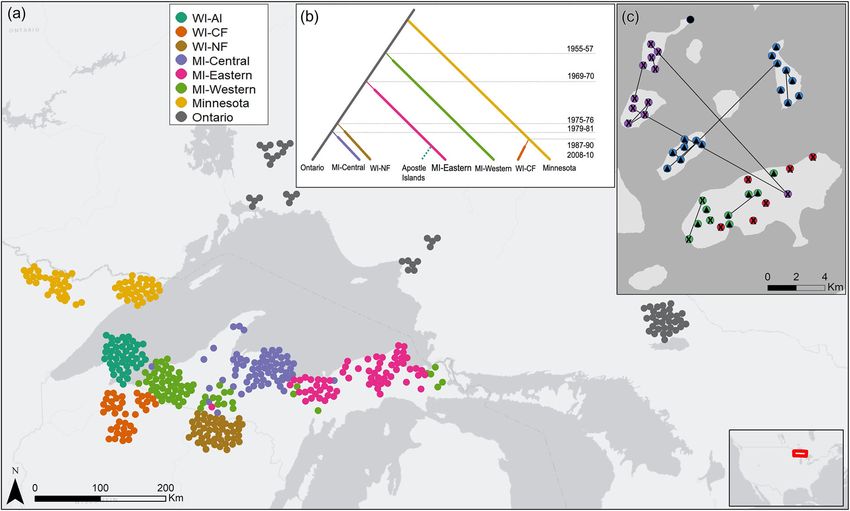
2010]), individuals from Minnesota (N = 61; 2008–2010) microsatellite alleles using GeneMapper® Software 5Ecological Applications Article e02416; page 4 MATTHEW M. SMITH ET AL. Vol. 0, No. 0 FIG. 1. Map of American marten (Martes americana) samples collected from the regional recovery network: Apostle Islands, Wisconsin, United States (WI-AI), Chequamegon National Forest, Wisconsin, United States (WI-CF), Nicolet National Forest, Wisconsin, United States (WI-NF), central Upper Michigan (MI-Central), eastern Upper Michigan (MI-Eastern), western Upper Michigan (MI-Western), Minnesota, and Ontario used to identify source and connectivity. A location jitter was placed on individ- ual points for viewing (a). An example diagram of the tree topology used to test alternate colonization scenarios with dates of his- torical translocation events (b). For full set of scenarios see Appendix S1: Fig. S1. Individual clustering assignments of American marten (Martes americana) sampled from the Apostle Islands, Wisconsin, United States (WI-AI) from STRUCTURE using the admixture ancestry model with correlated allele frequencies. Different colors represent unique genetic clusters from K = 4 with black circle representing individuals that had q values 3 loci, but
Xxxxx 2021                          RECOLONIZATION OF A POTENTIAL REFUGE                            Article e02416; page 5

observed and expected heterozygosity with packages           (3) contemporary colonization. A pre-extirpation hold-
DiveRsity (Keenan et al. 2013) and poppr (Kamvar et al.      out would be a relic lineage that has persisted undetected
2014) in R (R Development Core Team 2020). Addition-         since before regionwide extirpation and would represent
ally, we estimated genetic diversity measures within five    an evolutionary significant unit and a high priority for
of the Apostle Islands as well as contemporary effective     conservation efforts. In contrast, a 1950s translocation
population size (Ne) using the linkage disequilibrium        holdout from human-aided translocation, featuring a dif-
method with random mating (Waples 2006, Waples and           ferent and exotic species of marten (Pacific marten),
Do 2010) implemented in NeESTIMATOR (Do et al.               would complicate future management decisions and dis-
2014). We evaluated estimates of Ne with allele frequen-     qualify the archipelago as a refuge for American marten.
cies greater than >0.02 and >0.01 to account for poten-      A contemporary colonization would signify that martens
tial upward bias due to rare alleles (Waples and Do          have dispersed to the islands from the mainland and in
2010). The Linkage disequilibrium method assumes dis-        recent time suggest the Apostle Islands are an important
crete generations, random mating, and closed popula-         refuge for martens. Both a pre-extirpation holdout and
tions (Waples and England 2011); however, this method        contemporary colonization would signify an important
can perform well when Ne is small, as observed in these      subpopulation within the recovery network. We defined a
populations (Robinson and Moyer 2013).                       pre-extirpation scenario as a single model that had the
   To identify genetic differentiation between subpopula-    marten population on the Apostle Islands splitting from
tions, we first calculated pairwise G0ST (Hedrick 2005), D   an Ontario source before regional extirpation in the
(Jost 2008), and FST (Weir and Cockerham 1984) with          1920s. We modeled a contemporary recolonization with
95% confidence intervals using 5,000 permutations in         six different scenarios where the marten population on
DiveRsity (Keenan et al. 2013). We used a discriminant       the Apostle Islands split from a source within the recov-
analysis of principle components (DAPC) on multilocus        ery network after 1920. We tested competing scenarios in
genotypes to visualize and predict group membership of       an approximate Bayesian computational (ABC) frame-
individuals from the Apostle Islands with individuals        work (Beaumont 2010, Bertorelle et al. 2010).
from the other subpopulations. We constructed a DAPC
that only included putative subpopulations in the recov-
                                                              Simulations, model selection, and parameter estimation
ery network and predicted placement of individuals
from the Apostle Islands by centering and scaling indi-         We modeled all colonization scenarios with the known
viduals to the DAPC constructed from individuals from        source and timing of translocation events of martens in
the mainland (Jombart 2008, Jombart et al. 2010). We         the region (Williams et al. 2007), but varied by the loca-
calculated the optimal number of principle components        tion and timing of the branch leading to the current
to retain using the alpha-score optimization (Jombart        sample of individuals from the Apostle Islands for a
2008, Jombart et al. 2010).                                  total of seven potential models (Fig. 1b; see Appendix
   In addition, to quantify genetic relationships within     S1: Fig. S1 for all tree topologies). We included parame-
the archipelago, we inferred genetic clusters of martens     ters of the contemporary effective population size, tim-
on the Apostle Islands to identify genetic similarities      ing of translocation or splitting event, reintroduction
across islands. We implemented clustering algorithms in      effective population size, and duration of the bottleneck
Structure v2.3.4 with 500,000 Markov chain Monte             following reintroduction (Table 1, Fig. 1b). We simu-
Carlo iterations after 100,000 burn-in using admixture       lated historical parameters from a uniform distribution
ancestry model with correlated allele frequencies (Pritch-   and the minimum and maximum values were obtained
ard et al. 2000). We ran 10 replicates for each K = 1–10     from demographic data and records on reintroduction
and the most supported K was determined by examining         events (Table 1). Specifically, priors on current effective
the change in the mean posterior probability across K        population size for the Wisconsin and Upper Michigan
(mean Ln P(K)) and by estimating ΔK (Evanno et al.           populations were informed by abundance estimates or
2005). Replicate runs at each supported K were merged        genetic data (Skalski et al. 2011, Manlick et al. 2016,
and aligned using CLUMPP (Jakobsson and Rosenberg            Grauer et al. 2019). We used the timing of reintroduc-
2007). We assigned individuals to genetic clusters when      tion events and the number of martens released during
admixture proportions were ≥0.5 otherwise individuals        reintroduction to inform priors on timing parameters
were left unassigned. Bayesian clustering was conducted      (t2, t3, t4, t5, t6) and reintroduction effective population
using functions or wrapper functions in the R package        size (Table 1; Williams et al. 2007). Consequently, the
strataG (Archer et al. 2017, R Development Core Team         timing of colonization for the Apostle Islands had to
2020).                                                       occur concurrent with or after the establishment of the
                                                             mainland population given the scenario. All timing
                                                             parameters were estimated in generations and we consid-
             Evaluation of colonization scenarios
                                                             ered a generation time of 5 yr for martens (Clark et al.
  To identify the most likely source of martens on the       1987). We implemented a generalized stepwise mutation
Apostle Islands, we tested three hypotheses: (1) pre-        model, and the mean mutation rate was bound between
extirpation holdout, (2) 1950s translocation holdout, and    8.1 × 10⁻³ and 8.0 × 10⁻⁵ as extreme values observed in
Ecological Applications
Article e02416; page 6 MATTHEW M. SMITH ET AL. Vol. 0, No. 0
mammalian microsatellites (Peery et al. 2012). We sum- evaluated model selection and inference by comparing
marized data sets with all available one- and two-sample classification votes, prior error rates, and recording out-
summary statistics in DIY ABC (see Cornuet et al. of-bag error rates that assess the proportion of data sets
[2014] for complete list) and simulated 30,000 replicates that are misassigned to alternate models. We also per-
per candidate model (N = 210,000) in DIYABC (Cor- formed a linear discriminant analysis on the simulated
nuet et al. 2014). and observed data sets to visualize model fit to the
We used a random forest method for model selection observed data in the R package abcrf (Pudlo et al. 2016,
and estimate posterior probabilities of competing mod- R Development Core Team 2020). We conducted poste-
els using 500 trees for each random forest analysis imple- rior model checking in DIYABC by simulating 100,000
mented in the package abcrf (Pudlo et al. 2016, Raynal data sets of the most supported model and selected a
et al. 2019) in R (R Development Core Team 2020). We posterior sample of 10,000 closest to the observed data
included all summary statistics (N = 256) and the linear following a rejection step and local regression treatment
discriminant analysis axes in the random forest analysis (Cornuet et al. 2010). We estimated summary statistics
as model selection is robust to the choice of summary from 1,000 new simulated data sets drawn from the pos-
statistics (Pudlo et al. 2016, Fraimout et al. 2017). We terior distribution. We compared simulated summary
TABLE 1. Description of parameters and priors used for all colonization scenarios and estimated parameter values from the most
supported model from the approximate Bayesian computation analysis.
Posterior estimate
Parameter Population Description Prior Median Q2.5 Q97.5
N1 Apostle Island Contemporary effective population size 1–25 14 3 24
N2 WI-CF Contemporary effective population size 10–100 52 12 98
N3 MI-Central Contemporary effective population size 10–1,000 424 18 957
N4 Minnesota Contemporary effective population size 10–10,000 5,753.14 589 9,760
N5 WI-NF Contemporary effective population size 10–250 102 14 245
N6 Ontario Contemporary effective population size 10–10,000 4,875 777.875 9,449
N7 MI-Western Contemporary effective population size 10–1,000 425 21 977
N8 MI-Eastern Contemporary effective population size 10–1,000 424 22 977
t1 Apostle Island Timing of colonization from source 1–10,000 4 2 9
t2 WI-CF Time of reintroduction 1–6 3 1 6
t3 MI-Central Time of reintroduction 6–8 7 6 8
t4 WI-NF Time of reintroduction 6–8 7 6 8
t5 MI-Eastern Time of reintroduction 9–10 9 9 10
t6 MI-Western Time of reintroduction 11–12 12 11 12
t7 Minnesota Split from Ontario 50–500 234 58 478
N3r MI-Central Reintroduction effective population size 5–500 91 13 465
N5r WI-NF Reintroduction effective population size 5–500 213 21 489
N8r MI-Eastern Reintroduction effective population size 5–250 28 5 226
N7r MI-Western Reintroduction effective population size 5–100 56 12 96
N2r WI-CF Reintroduction effective population size 5–500 238 35 480
rb(WI-CF) WI-CF Duration of reintroduction bottleneck 1–6 4 1 6
rb(MI-C) MI-Central Duration of reintroduction bottleneck 1–8 5 1 8
rb(WI-NF) WI-NF Duration of reintroduction bottleneck 1–8 5 1 8
rb(MI-E) MI-Eastern Duration of reintroduction bottleneck 1–10 6 2 10
rb(MI-W) MI-Western Duration of reintroduction bottleneck 1–12 7 2 12
Notes: Prior values are minimum and maximum simulated values from a uniform distribution. Contemporary effective popula-
tion sizes were informed by current population size estimates or genetic data (Skalski et al. 2011, Manlick et al. 2016, Grauer et al.
2019). Historical release dates and the number of released individuals informed parameters for the timing of reintroductions and
reintroduction effective population sizes (Williams et al. 2007). Priors for the duration of reintroduction bottleneck was set as the
time of reintroduction to present. All timing parameters are in generations. Contemporary effective population size for the Apostle
Islands, Wisconsin, United States (N1), Chequamegon National Forest, Wisconsin, United States (N2), central Upper Michigan
(N3), Minnesota (N4), Nicolet National Forest, Wisconsin, United States (N5), Ontario (N6), western Upper Michigan (N7), and
eastern Upper Michigan (N8). Translocation time or population splitting are labeled t1 for the Apostle Islands, t2 for Che-
quamegon National Forest, Wisconsin, United States, t3 for central Upper Michigan, t4 for Nicolet National Forest, WI, t5 for
eastern Upper Michigan, t6 for western Upper Michigan, and t7 for Minnesota. Timing parameters with “rb” represent duration of
bottleneck following translocation to the Chequamegon National Forest, WI (rb(WI-CF)), central Upper Michigan (rb(MI-C)),
Nicolet National Forest, Wisconsin, United States (rb(WI-NF), eastern Upper Michigan (rb(MI-E)), and western Upper Michigan
(rb(MI-W)). Effective population size of translocated population in the Chequamegon National Forest, WI (N2r), central Upper
Michigan (N3r), Nicolet National Forest, WI (N5r), western Upper Michigan (N7r), and eastern Upper Michigan (N8r).Xxxxx 2021 RECOLONIZATION OF A POTENTIAL REFUGE Article e02416; page 7
statistics to observed summary statistics by computing Gene flow
posterior predictive P values that identified the probabil-
Pairwise gene flow was quantified to assess the degree
ity that simulated summary statistics are more extreme
of connectivity within the recovery network. By identify-
than observed statistics (Bertorelle et al. 2010, Cornuet
ing differences in the directionality of gene flow, we can
et al. 2010).
explore relationships (i.e., sources) between subpopula-
Lastly, we estimated posterior parameter densities
tions. We estimated the direction and rate of contempo-
from the most supported model using a random forest
rary gene flow among pairs of populations. Using
regression with 500 trees from 30,000 simulated data sets
Bayesian posterior probabilities, we estimated recent
(Raynal et al. 2019). We evaluated our ability to estimate
gene flow (2–3 generations) by assigning individuals to
parameters by comparing the correlation between simu-
source populations based on population allele frequen-
lated and predicted parameter values from the random
cies while accounting for inbreeding (BAYESASS 3.0
forest regression. We visually compared prior and poste-
[Wilson and Rannala 2003]). We did not include histori-
rior parameter densities from the most supported
cal reintroduction sources (Minnesota and Ontario), as
model.
geographical distance and barriers would make gene
flow implausible. We used 107 Markov chain Monte
Relatedness and dispersal detection Carlo replications after a burn-in of 106 runs. Mixing
parameters were adjusted to achieve recommended
To identify interisland connectivity, we used estimates
acceptance rate (a = 0.25, f = 0.30 [Wilson and Rannala
of relatedness between individuals to infer likely pedi-
2003]). We generated 10 independent runs with random
gree relationship. On the Apostle Islands, we estimated
starting seeds and evaluated trace files to confirm con-
relatedness and identified first-order relationships (i.e.,
vergence and consistency across runs.
parent–offspring pairs or full-sibships) consistent at 95%
To explore directionality of contemporary gene flow
confidence using a maximum-likelihood approach in
among our sampled sites, we generated a network graph
ML-RELATE (Kalinowski et al. 2006). We also ana-
of relative gene flow. Following Sundqvist et al. (2016),
lyzed a combined data set following the same procedure
we compared pairwise measures of genetic differentia-
in ML-RELATE (Kalinowski et al. 2006) that included
tion between combined population pairs (i.e., pooled
individuals from the closest subpopulation with the
individuals) to each separate population of the pair. Rel-
islands. We included the combined data set due to the
ative gene flow within the network (i.e., gene flow scaled
proximity and previous sampling effort (2012–2013) that
to the highest relative value) was estimated from GST
estimated >65% of the population (N = 22.6 [confidence
(Nei and Chesser 1983) and significant directionality
interval (CI) 16.89–37.03] [Manlick et al. 2018]). Related
was tested using 95% confidence limits from 1,000 boot-
individuals would suggest recent movement between the
strap iterations using the divMigrate function in the R-
two locations and that contemporary connectivity
package DiveRsity (Keenan et al. 2013, R Development
occurs.
Core Team 2020).
Relatedness estimation relies on the frequency of alle-
les in the population, but often the true frequency of
alleles is unknown from observed genetic data. Thus,
RESULTS
pedigree relationships can be influenced by the number
of alleles, sampling effort, and population structure. We
Genetic diversity and differentiation
assessed our power given our observed alleles and sensi-
tivity under alternate allele frequency distributions to We identified 43 unique individuals from 303 hair
infer relationships with simulations (see Appendix S1: samples collected on five Apostle Islands. Genotyping
Table S6 and Supporting Methods for more details). For error rate per locus ranged from 0% to 6.3% across PCR
the Apostle Island data set and the combined data set of replicates (i.e., the ratio between observed allelic differ-
the Apostle Islands and the closest subpopulation, we ences between replicates and the total number of com-
simulated individuals with known relationships from our parisons) for all noninvasive hair samples collected on
observed allele frequencies and compared simulated the Apostle Islands. We had high power to discriminate
group means in the R-package related (Pew et al. 2015, individuals with PID and PIDSIB values of 5 × 10⁻⁸ and
R Development Core Team 2020). For the combined 6 × 10⁻⁴, respectively. The martens on the Apostle
data set of the Apostle Islands and closest subpopula- Islands had the lowest levels of genetic diversity com-
tion, we also evaluated the consistency in relationships pared to subpopulations in the recovery network: allelic
under two alternate allele frequencies that do not assume richness (Ar; range 2.29–6.43), observed heterozygosity
Hardy–Weinberg proportions to estimate expected geno- (Ho; range 0.51–0.67), and expected heterozygosity (He;
typic frequencies. We tested the sensitivity of our first- range 0.49–0.79). We did not observe any private alleles
order relationships by simulating pedigree relationships between the Apostle Islands and other subpopulations
from observed allele frequencies and two alternate allele (Appendix S1: Table S2). The effective population size
frequency distributions (uniform and triangular) of our estimated for the Apostle Islands was 12.2 (95% CI: 8.8–
observed alleles. 16.9) and 6.8 (4.0–9.4), with rare allele thresholds ofEcological Applications Article e02416; page 8 MATTHEW M. SMITH ET AL. Vol. 0, No. 0 0.02 and 0.01, respectively. Contrary to marten popula- substantial genetic differentiation from Pacific martens tions on the mainland, the observed heterozygosity was (G0ST : 0.48; D: 0.39; Appendix S1: Table S4). larger than expected for martens on the individual We identified population genetic structure between islands. Comparing genetic diversity within the Apostle islands of the archipelago and ΔK showed support for Islands revealed that martens on Stockton Island had the two and four genetic clusters that occurred across islands highest percentage of private alleles (Pa: 24.1%) and (Appendix S1: Fig. S2). For K = 4, two sets of two highest allelic richness (Ar; 2.62; Appendix S1: Table S3). islands clustered together, and Stockton Island, the lar- Martens on the Apostle Islands clustered closely gest colonized island (40 km2) in the archipelago, had (Fig. 2) and exhibited low pairwise genetic differentia- two additional genetic clusters (Fig. 1c). We observed tion (G0ST : 0.08–0.20; D: 0.02–0.11; Appendix S1: Table generally concordant grouping of islands when K = 2 S4) to all other subpopulations, and exhibited the closest clusters were considered with martens on Stockton relationship to marten from MI-Eastern subpopulation. Island having membership to both clusters (Fig. 1c). Martens from the Apostle Islands differed the most from Average membership (q values) to a given cluster was Minnesota and WI-CF (Fig. 2b). In addition, all sub- high regardless of whether 2 (q = 0.92) or 4 (q = 0.84) populations were discrete (Fig. 2a) and showed clusters was considered (Appendix S1: Fig. S3). FIG. 2. Discriminant analysis of principle components of American marten (Martes americana) populations from the regional recovery network: Chequamegon National Forest, Wisconsin, United States (WI-CF), Nicolet National Forest, Wisconsin, United States (WI-NF), central Upper Michigan (MI-Central), eastern Upper Michigan (MI-Eastern), western Upper Michigan (MI- Western), Minnesota, Ontario, and with (a) and without (b) Pacific marten (Martes caurina). Predicted position of martens from the Apostle Islands (WI-AI) within the discriminant functions are symbolized with squares. Scatterplots of individuals along the first two discriminant functions. Included insets show the number of principal components analysis axis retained and discriminant functions eigenvalues.
Xxxxx 2021 RECOLONIZATION OF A POTENTIAL REFUGE Article e02416; page 9
Evaluation of colonization scenarios Relatedness and detection of dispersal
We compared results from our two general coloniza- We estimated relatedness and pedigree relationships to
tion scenarios of the Apostle Islands (pre-extirpation identify connectivity within the islands and between the
holdout vs. contemporary recolonization) based on the other subpopulations. Our power analysis revealed that
number classification votes for all random forest trees for both data sets first-order relationships could be dis-
for each scenario in our ABC framework. Given that tinguished from half siblings and unrelated individuals
genetic differentiation and clustering revealed a translo- (Appendix S1: Supporting Methods). We identified 21
cation holdout from the 1950s was implausible, we elimi- first-order relationships in the Apostle Islands with three
nated Pacific marten from the ABC analysis. We found occurring across different islands, which suggests that
little support for a pre-extirpation model (14% of votes), marten dispersal occurs between islands (Fig. 1c). Most
whereas a contemporary colonization scenario was of the first-order relationships occurred within individ-
strongly supported with various models receiving 86% of ual islands, creating family groups that were also sup-
the votes. The most supported contemporary source was ported by fine-scale genetic structuring across the
from eastern Upper Michigan (36% of votes; posterior archipelago (Fig. 1c). We identified a single first-order
probability = 0.54) and two times the votes as the next relationship between the Apostle Islands and the closest
closest model. The out-of-bag error rates (range 0–0.20) subpopulation (WI-CF) and was consistently identified
revealed some uncertainty in distinguishing between dif- as a first-order relationship at 95% confidence in ML-
ferent contemporary mainland sources (Appendix S1: relate with a simulated uniform and triangular allele fre-
Table S5). Simulated summary statistics of the top quency distributions (Appendix S1: Supporting Meth-
model generally captured the observed data in both the ods).
linear discriminate analysis and posterior predictive P
values with 22 out of 256 summary statistics had P val-
Gene flow
ues ≤0.05. We estimated contemporary effective popula-
tion size of the Apostle Islands (N1) at 14 (95% highest Estimates of recent dispersal rates revealed limited
density interval [HDI]: 3–24; Table 1) and the timing of gene flow among sub-populations. Only two pairwise
colonization (t1) at four generations (95% HDI: 2–9; comparisons showed recent gene flow that did not over-
Table 1). The posterior distribution for N1 and t1 lap zero with a 95% confidence limit (Fig. 3). Recent
showed clear peaks above prior values and high correla- gene flow and significant directionality in relative gene
tion between simulated and predicted values (r ≥ 0.82; flow was observed from the Apostle Islands back to the
Appendix S1: Figs. S4, S5). However, N1 and t1 had recovery network (Fig. 3; Appendix S1: Fig. S7). In
estimated 95% posterior distributions that encompassed addition, we estimated recent gene flow between two
the range of prior values (Table 1). subpopulations in Michigan and significant directional
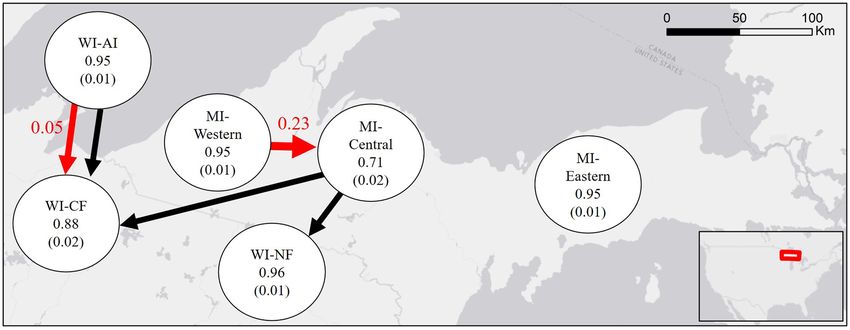
FIG. 3. Indirect gene flow between subpopulation pairs of American marten (Martes americana) within a regional recovery net-
work: Apostle Islands (WI-AI), Chequamegon National Forest, Wisconsin, United States (WI-CF), Nicolet National Forest, Wis-
consin, United States (WI-NF), central Upper Michigan (MI-Central), eastern Upper Michigan (MI-Eastern), and western Upper
Michigan (MI-Western). Values in nodes represent proportion of sampled population from source population with standard devia-
tion in parentheses and red values and arrows represent estimated recent gene flow that did not overlap zero at 95% confidence
interval from BAYESASS. Black arrows represent significant directionality of relative gene flow between populations estimated
from GST with 95% confidence from divMigrate.Ecological Applications
Article e02416; page 10 MATTHEW M. SMITH ET AL. Vol. 0, No. 0
gene flow from central Michigan to two subpopulations Archipelagic marten we identified shared a first-order
in Wisconsin (Fig. 3; Appendix S1: Fig. S7). The Apos- relative on the mainland >85 km distant. Given the sam-
tle Islands showed a high percentage of the sampled ple dates of the related individuals (2013 for the main-
population that originated from the Apostle Islands land and 2017 for the Apostle Islands), it seems
(0.95; SD = 0.01) and the central subpopulation in plausible that we identified a mainland disperser. If true,
Michigan having the lowest (0.71; SD = 0.02). Results this would indicate that the recolonization of the Apostle
are consistent with the estimated high rate of recent gene Islands occurred via a stepping-stone process across the
flow from the western population in Upper Michigan. entire network of reintroduction. Martens translocated
from Ontario to Upper Michigan dispersed to northern
Wisconsin mainland and eventually to Stockton Island.
DISCUSSION
It is worth noting, however, that our relatedness assign-
We found that decades of disjunct translocations have ment cannot identify directionality of movement. Alter-
formed a recovery network featuring multiple subpopu- natively, it is possible that we detected a dispersing
lations occupying areas of varying habitat quality, demo- individual from the archipelago to the mainland.
graphic potential, and connectivity. Within this recovery Despite their small body size, martens can disperse long
network we identified a potential refuge, a location resis- distances (Pauli et al. 2012) and even instances of disper-
tant to environmental change, that may play a dispro- sal >150 km have been observed (Slough 1989, Johnson
portionate role in population recovery along a trailing et al. 2009). The proximity of the Chequamegon
range boundary. Our results corroborate the observation National Forest area to the Apostle Islands within the
that, following a long absence, American martens recovery network makes it a likely step in the recoloniza-
recently recolonized the Apostles Islands from a neigh- tion process. The mainland population appears to be in
boring mainland population. A translocation holdout decline (Manlick et al. 2016), but may still be important
from the 1950s is extremely unlikely, given that none of for overall connectivity of the region. Stockton Island,
the individuals from the Apostle Islands clustered with the closest of the Apostle Islands known to have marten,
Pacific martens and that there was substantial genetic isXxxxx 2021 RECOLONIZATION OF A POTENTIAL REFUGE Article e02416; page 11 across their distributional range, appear to be the most We hypothesize that physical space limitations on each abundant of all small mammal species (Mallinger et al. of the small islands necessitates the movement of indi- 2019). Despite being logged in the past, the Apostle viduals among islands and to the mainland, even across Islands have forest composition and complexity that is an unequivocally hostile matrix of ice cover. more similar to pre-European settlement and pre- Our estimated directionality of contemporary disper- extirpation of martens that may be attributed to an sal from the islands to the mainland was unexpected. absence or low intensity of deer herbivory, fire, and for- Indeed, both analyses for contemporary gene flow est disturbance (Beals and Cottam 1960). Indeed, revealed low levels of directional dispersal from the Canada yew (Taxus canadensis), functionally extirpated Apostle Islands to the mainland. We hypothesize that from the mainland because of white-tailed deer (Odo- this movement of individuals from the archipelago back coileus virginianus) herbivory and fire (Windels and Flas- to the mainland is a result of demographic pressure from pohler 2011), and mountain maple (Acer spicatum) are a growing marten population that is spatially con- abundant in the understory because of the absence or strained by island size. Interestingly, a paradigm shift in low density of deer on most islands. In addition, Canada island biogeography has emerged that suggests island- yew is sensitive to fire and forest disturbance (Windels to-mainland colonization might be more common than and Flaspohler 2011), and the Apostle Islands may also previously assumed (Bellemain and Ricklefs 2008), and provide refuge from disturbance regimes (i.e., timber has been observed among diverse taxa (Jønsson et al. extraction) on the mainland. The structural complexity 2010, Tavares et al. 2018, Rowe et al. 2019). Thus, the likely drives both prey availability (Thompson and Col- traditional view of islands as vulnerable sinks may not gan 1987, Carey and Johnson 1995) and marten foraging hold in novel systems that have risen from rapid environ- success (Andruskiw et al. 2008) as well as reduced pre- mental change where the isolation from mainland distur- dation risk (Thompson and Colgan 1994). The Apostle bances, competition, and disease can act as important Islands, then, may possess historic forest heterogeneity refuges. Indeed, the isolation afforded by islands has that simultaneously attenuates predation and enhances been used in the extreme to avert extinction by “maroon- foraging and acts as an important refuge for this endan- ing” threatened species (Williams 1977, Abbott 2000, gered species. Whether this immediate refuge translates Saunders and Norton 2001). Rather than a last resort, into a refugia, a site that is resilient to long-term land- we believe that such islands can act as particularly scape and climate change, is yet to be seen. important subpopulations in a recovery network when Even though marten density on each island appears to they possess the attributes of a refuge. be high, the number of overall individuals and effective Carnivore translocations are a primary tool for con- population size is low and, thus, vulnerable to stochastic servation and management (Linnell et al. 1997, Lewis et events. It is likely that the Apostle Islands have the low- al. 2012) and identifying refuges a priori would likely est effective population size within the recovery network improve persistence, recovery, and success. Decades of due to isolation and limitations on available habitat. regional translocations have operated as a landscape- Thus, within the recovery network, subpopulations in scale experiment in the processes that influence the Michigan will be essential to persistence because of the recovery of an extirpated carnivore. Subpopulations in large area of continuous forest. It is also notable that we the recovery network display different levels of establish- did not detect contemporary gene flow from the recovery ment and persistence, yet even underperforming subpop- network to the Apostle Islands; however, the temporal ulations (i.e., pseudo-sinks) can play a role in the differences in samples between the Apostle Islands and expansion of recovery across the landscape. Although other samples may have contributed to our nondetec- carnivore life histories generally complicate transloca- tion. Although samples from across the recovery net- tion success, vagile species with great dispersal power work were sampled asynchronously, they were all have the potential to expand the area of recovery after collected within at least three generations of each other, establishment and improve regional persistence. so allele frequencies of subpopulations were likely unaf- Our work reveals the potential of a reintroduction net- fected. If our observation of limited dispersal back to work to precipitate a natural and unexpected coloniza- the islands is correct, there is limited potential for demo- tion. In addition, the natural recolonization likely graphic or genetic rescue from the mainland populations contributes to the overall regional viability by both (Whiteley et al. 2015). Given the small population size expanding and strengthening the network of recovery and the low genetic diversity on the archipelago, popula- via directional flow of individuals back into the original tion declines, or genetic inbreeding should be monitored, network. It appears that natural recolonization occurred as they increase the probability of extinction (Mills and in an ideal spot within the recovery network for Smouse 1994). However, we did identify interisland improved regional viability and constitutes a refuge movement of first-order relatives, revealing that discrete exhibiting connectivity to the network, a high density of island-bound groups are not completely isolated. It is individuals, and high-quality habitat that resembles his- possible that the islands may function as a metapopula- toric conditions that are protected from both human tion that is demographically independent but exhibits and natural perturbations. Importantly, conservation some degree of functional connectivity (Hanski 1991). efforts would benefit from identifying putative refuges a
Ecological Applications
Article e02416; page 12                           MATTHEW M. SMITH ET AL.                                                 Vol. 0, No. 0

priori and targeting them for translocations. The identi-            Bertorelle, G., A. Benazzo, and S. Mona. 2010. ABC as a flexi-
fication of such areas should extend beyond habitat suit-              ble framework to estimate demography over space and time:
ability, and included an assessment of ecological novelty,             some cons, many pros. Molecular Ecology 19:2609–2625.
                                                                     Boudjemadi, K., J. Lecomte, and J. Clobert. 1999. Influence of
resistance to future environmental change, connectivity                connectivity on demography and dispersal in two contrasting
to remnant populations or other translocation sites, and               habitats: an experimental approach. Journal of Animal Ecol-
demographic potential. In general, these targeted refuges              ogy 68:1207–1224.
represent valuable targets, especially at range bound-               Buskirk, S. W., and L. W. Ruggiero. 1994. American marten.
aries, for species recovery and long-term persistence. The             Pages 7–37 in L. F. Ruggiero, K. B. Aubry, S. W. Buskirk, J.
complex problem of species recovery in novel ecosystems                L. Lyon, and W. J. Zielinski, editors. The scientific basis for
                                                                       conserving forest carnivores: American marten, fisher, lynx,
will require the continued identification and evaluation
                                                                       and wolverine in the western United States. General Technical
of various strategies, including refuges, and conservation             Report RM-254. U.S. Department of Agriculture, Forest Ser-
biologists should be prepared for the emergence of new                 vice, Rocky Mountain Forest and, Range Experiment Sta-
and even unexpected mechanisms that promote regional                   tion, Fort Collins, Colorado, USA.
recovery.                                                            Carey, A. B., and M. L. Johnson. 1995. Small mammals in man-
                                                                       aged, naturally young, and old-growth forests. Ecological
                      ACKNOWLEDGMENTS                                  Applications 5:336–352.
                                                                     Carlson, J. E., J. H. Gilbert, J. W. Pokallus, P. J. Manlick, W. E.
   This work was supported by the National Institute of Food           Moss, and J. N. Pauli. 2014. Potential role of prey in the
and Agriculture, United States Department of Agriculture,              recovery of American martens to Wisconsin. Journal of Wild-
Hatch project 1012910. Wisconsin Department of Natural                 life Management 78:1499–1504.
Resources provided financial support, and particular thanks to       Clark, T. W., E. Anderson, C. Douglas, and M. Strickland.
Skyler Vold. The Apostle Islands National Lakeshore provided           1987. Martes americana. Mammalian Species:1–8.
financial and logistical support; thanks to Peggy Burkman,           Conner, M. M., T. R. Stephenson, D. W. German, K. L. Mon-
David Cooper, Kyleleen Cullen, Ken Pemble, and the seasonal            teith, A. P. Few, and E. H. Bair. 2018. Survival analysis:
park technicians who helped with data collection. In addition,         informing recovery of Sierra Nevada bighorn sheep. Journal
thanks to Sean Burns assistance in the field, Clare Knife for lab-     of Wildlife Management 82:1442–1458.
oratory help, and Phillip J. Manlick, Jennifer A. Grauer, Jeff       Cornuet, J. M., P. Pudlo, J. Veyssier, A. Dehne-Garcia, M. Gau-
Bowman, and Erin L. Koen for previous research that con-               tier, R. Leblois, J. M. Marin, and A. Estoup. 2014. DIYABC
tributed data to this manuscript.                                      v2.0: a software to make approximate Bayesian computation
                                                                       inferences about population history using single nucleotide
                       LITERATURE CITED                                polymorphism, DNA sequence and microsatellite data.
                                                                       Bioinformatics 30:1187–1189.
Abbott, I. 2000. Improving the conservation of threatened and        Cornuet, J. M., V. Ravigné, and A. Estoup. 2010. Inference on
  rare mammal species through translocation to islands: case           population history and model checking using DNA sequence
  study Western Australia. Biological Conservation 93:195–             and microsatellite data with the software DIYABC (v1.0).
  201.                                                                 BMC Bioinformatics 11:401.
Akçakaya, H. R., G. Mills, and C. P. Doncaster. 2006. The role       Davis, C. S., and C. Strobeck. 1998. Isolation, variability, and
  of metapopulations in conservation. Pages 64–84 in D.                cross-species amplification of polymorphic microsatellite loci
  MacDonald and K. Service, editors. Key topics in conserva-           in the family mustelidae. Molecular Ecology 7:1776–1778.
  tion biology. Wiley-Blackwell, Hoboken, New Jersey, USA.           de Vos, A. 1964. Range changes of mammals in the Great Lakes
Allen, M. L., M. J. Farmer, J. D. J. Clare, E. R. Olson, J. Van        region. American Midland Naturalist 71:210–231.
  Stappen, and T. R. Van Deelen. 2018. Is there anybody out          Defries, R., and H. Nagendra. 2017. Ecosystem management as
  there? Occupancy of the carnivore guild in a temperate archi-        a wicked problem. Science 356:265–270.
  pelago. Community Ecology 19:272–280.                              Deredec, A., and F. Courchamp. 2007. Importance of the Allee
Andruskiw, M., J. M. Fryxell, I. D. Thompson, and J. A. Baker.         effect for reintroductions. Ecoscience 14:440–451.
  2008. Habitat-mediated variation in predation risk by the          Do, C., R. S. Waples, D. Peel, G. M. Macbeth, B. J. Tillett, and
  American marten. Ecology 89:2273–2280.                               J. R. Ovenden. 2014. NeEstimator v2: re-implementation of
Archer, F. I., P. E. Adams, and B. B. Schneiders. 2017. STRA-          software for the estimation of contemporary effective popula-
  TAG: an R package for manipulating, summarizing and ana-             tion size (Ne) from genetic data. Molecular Ecology
  lysing population genetic data. Molecular Ecology Resources          Resources 14:209–214.
  17:5–11.                                                           Elkin, C. M., and H. Possingham. 2008. The role of landscape-
Armstrong, D. P., and P. J. Seddon. 2008. Directions in reintro-       dependent disturbance and dispersal in metapopulation per-
  duction biology. Trends in Ecology and Evolution 23:20–25.           sistence. American Naturalist 172:563–575.
Assel, R. A. 2009. Contemporary Lake Superior ice cover clima-       Estes, J. A., et al. 2011. Trophic downgrading of planet earth.
  tology. Pages 51–66 in M. Munawar and I. F. Munawar, edi-            Science 333:301–306.
  tors. State of Lake Superior. First edition. Aquatic Ecosystem     Evanno, G., S. Regnaut, and J. Goudet. 2005. Detecting the
  Health & Management Society, Burlington, Ontario, Canada.            number of clusters of individuals using the software STRUC-
Beals, E. W., and G. Cottam. 1960. The forest vegetation of the        TURE: a simulation study. Molecular Ecology 14:2611–2620.
  Apostle Islands, Wisconsin. Ecology 41:743–751.                    Fischer, J., and D. B. Lindenmayer. 2000. An assessment of the
Beaumont, M. A. 2010. Approximate Bayesian computation in              published results of animal relocations. Biological Conserva-
  evolution and ecology. Annual Review of Ecology, Evolution,          tion 96:1–11.
  and Systematics 41:379–406.                                        Fleming, M. A., E. A. Ostrander, and J. A. Cook. 1999.
Bellemain, E., and R. E. Ricklefs. 2008. Are islands the end of        Microsatellite markers for American mink (Mustela vison)
  the colonization road? Trends in Ecology and Evolution               and ermine (Mustela erminea). Molecular Ecology 8:1352–
  23:461–468.                                                          1354.
Xxxxx 2021 RECOLONIZATION OF A POTENTIAL REFUGE Article e02416; page 13 Foster, D., F. Swanson, J. Aber, I. Burke, N. Brokaw, D. Tilman, Kalinowski, S. T., M. L. Taper, and T. C. Marshall. 2007. Revis- and A. Knaap. 2003. The importance of land-use legacies to ing how the computer program CERVUS accommodates ecology and conservation. BioScience 53:77–88. genotyping error increases success in paternity assignment. Fraimout, A., et al. 2017. Deciphering the routes of invasion of Molecular Ecology 16:1099–1106. Drosophila suzukii by means of ABC random forest. Molecu- Kalinowski, S. T., A. P. Wagner, and M. L. Taper. 2006. ML- lar Biology and Evolution 34:980–996. RELATE: a computer program for maximum likelihood esti- Francis, G. R., and A. B. Stephenson. 1972. Marten ranges and mation of relatedness and relationship. Molecular Ecology food habits in Algonquin Provincial Park, Ontario. Research Notes 6:576–579. Report 91. Ontario Ministry of Natural Resources, Toronto, Kamvar, Z. N., J. F. Tabima, and N. J. Gr̈unwald. 2014. Poppr: Ontario, Canada. an R package for genetic analysis of populations with clonal, Galpern, P., M. Manseau, P. Hettinga, K. Smith, and P. Wilson. partially clonal, and/or sexual reproduction. PeerJ 2:e281. 2012. Allelematch: an R package for identifying unique mul- Keenan, K., P. Mcginnity, T. F. Cross, W. W. Crozier, and P. A. tilocus genotypes where genotyping error and missing data Prodöhl. 2013. DiveRsity: an R package for the estimation may be present. Molecular Ecology Resources 12:771–778. and exploration of population genetics parameters and their Grauer, J. A., J. H. Gilbert, J. E. Woodford, D. Eklund, S. associated errors. Methods in Ecology and Evolution 4: Anderson, and J. N. Pauli. 2017. Unexpected genetic compo- 782–788. sition of a reintroduced carnivore population. Biological Keppel, G., K. P. Van Niel, G. W. Wardell-Johnson, C. J. Yates, Conservation 215:246–253. M. Byrne, L. Mucina, A. G. T. Schut, S. D. Hopper, and S. E. Grauer, J. A., J. H. Gilbert, J. E. Woodford, D. Eklund, S. Franklin. 2012. Refugia: identifying and understanding safe Anderson, and J. N. Pauli. 2019. Modest immigration can havens for biodiversity under climate change. Global Ecology rescue a reintroduced carnivore population. Journal of Wild- and Biogeography 21:393–404. life Management 83:567–576. Koen, E. L., J. Bowman, C. J. Garroway, S. C. Mills, and P. J. Griffith, B., J. M. Scott, J. W. Carpenter, and C. Reed. 1989. Wilson. 2012. Landscape resistance and American marten Translocation as a species conservation tool: status and strat- gene flow. Landscape Ecology 27:29–43. egy. Science 245:477–480. Kohn, B. E. and R. G. Eckstein. 1987. Status of marten in Wis- Hall, B., G. Motzkin, D. R. Foster, M. Syfert, and J. Burk. consin, 1985. Research Report 143. Wisconsin Department of 2002. Three hundred years of forest and land-use change in Natural Resources, Bureau of Research, Madison, Wisconsin, Massachusetts, USA. Journal of Biogeography 29:1319–1335. USA. Hanski, I., and M. Gilpin. 1991. Metapopulation dynamics: Laliberte, A. S., and W. J. Ripple. 2004. Range contractions of brief history and conceptual domain. Biological Journal of North American carnivores and ungulates. BioScience the Linnean Society 42:3–16. 54:123–138. Hastings, A., and L. W. Botsford. 2006. Persistence of spatial Lewis, J. C., R. A. Powell, and W. J. Zielinski. 2012. Carnivore populations depends on returning home. Proceedings of the translocations and conservation: insights from population National Academy of Sciences of the United States of Amer- models and field data for fishers (Martes pennanti). PLoS ica 103:6067–6072. One 7:e32726. Hedrick, P. W. 2005. A standardized genetic differentiation Linnell, J. D. C., R. Aanes, J. E. Swenson, J. Odden, and M. E. measure. Evolution 59:1633–1638. Smith. 1997. Translocation of carnivores as a method for Hobbs, R. J., et al. 2006. Novel ecosystems: theoretical and managing problem animals: a review. Biodiversity & Conser- management aspects of the new ecological world order. Glo- vation 6:1245–1257. bal Ecology and Biogeography 15:1–7. Lonsinger, R. C., and L. P. Waits. 2015. ConGenR: rapid deter- Howell, P. E., E. L. Koen, B. W. Williams, G. J. Roloff, and K. mination of consensus genotypes and estimates of genotyping T. Scribner. 2016. Contiguity of landscape features pose barri- errors from replicated genetic samples. Conservation Genetics ers to gene flow among American marten (Martes americana) Resources 7:841–843. genetic clusters in the Upper Peninsula of Michigan. Land- Mallinger, E., L. Gottwig, B. Khadka, M. J. Morales, M. Mor- scape Ecology 31:1051–1062. rison, E. R. Olson, J. Van Stappen, and T. Van Deelen. 2019. Jakobsson, M., and N. A. Rosenberg. 2007. CLUMPP: a cluster Inventory of the small mammal community within the Apos- matching and permutation program for dealing with label tle Islands National Lakeshore—2018. Technical Report. switching and multimodality in analysis of population struc- Northland College, Ashland, Wisconsin, USA. ture. Bioinformatics 23:1801–1806. Manlick, P. J., M. C. Romanski, and J. N. Pauli. 2018. Dynamic Johnson, C. A., J. M. Fryxell, I. D. Thompson, and J. A. Baker. colonization history in a rediscovered Isle Royale carnivore. 2009. Mortality risk increases with natal dispersal distance in Scientific Reports 8:12711. American martens. Proceedings of the Royal Society B Manlick, P. J., J. E. Woodford, J. H. Gilbert, D. Eklund, and J. 276:3361–3367. N. Pauli. 2016. Augmentation provides nominal genetic and Jombart, T. 2008. Adegenet: a R package for the multivariate demographic rescue for an endangered carnivore. Conserva- analysis of genetic markers. Bioinformatics 24:1403–1405. tion Letters 10:178–185. Jombart, T., S. Devillard, and F. Balloux. 2010. Discriminant Mech, L. D. 1995. The challenge and opportunity of recovering analysis of principal components: a new method for the anal- wolf populations. Conservation Biology 9:270–278. ysis of genetically structured populations. BMC Genetics Mech, L. D., and L. L. Rogers. 1977. Status, distribution, and 11:94. movements of martens in northeastern Minnesota. Research Jønsson, K. A., R. C. K. Bowie, R. G. Moyle, L. Christidis, J. Paper NE-143. U.S. Department of Agriculture, Northern A. Norman, B. W. Benz, and J. Fjeldså. 2010. Historical bio- Forest Experiment Station, Radnor, Pennsylvania, USA. geography of an Indo-Pacific passerine bird family (Pachy- Miller, B., K. Ralls, R. P. Reading, M. Scott, and J. Estes. 1999. cephalidae): different colonization patterns in the Indonesian Biological and technical considerations of carnivore translo- and Melanesian archipelagos. Journal of Biogeography cation: a review. Animal Conservation 2:59–68. 37:245–257. Mills, L. S., and P. E. Smouse. 1994. Demographic conse- Jost, L. 2008. GST and its relatives do not measure differentia- quences of inbreeding in remnant populations. American tion. Molecular Ecology 17:4015–4026. Naturalist 144:412–431.
You can also read