A Policy Framework for Green Transportation in Georgia
←
→
Page content transcription
If your browser does not render page correctly, please read the page content below
Public Disclosure Authorized

                               Report No. 70290-GE

                               A Policy Framework for
                               Green Transportation in Georgia
Public Disclosure Authorized

                               Achieving Reforms and Building Infrastructure for Sustainability
Public Disclosure Authorized
Public Disclosure Authorized

                               June 2012

                               Sustainable Development Department
                               Europe and Central Asia Region
                               The World Bank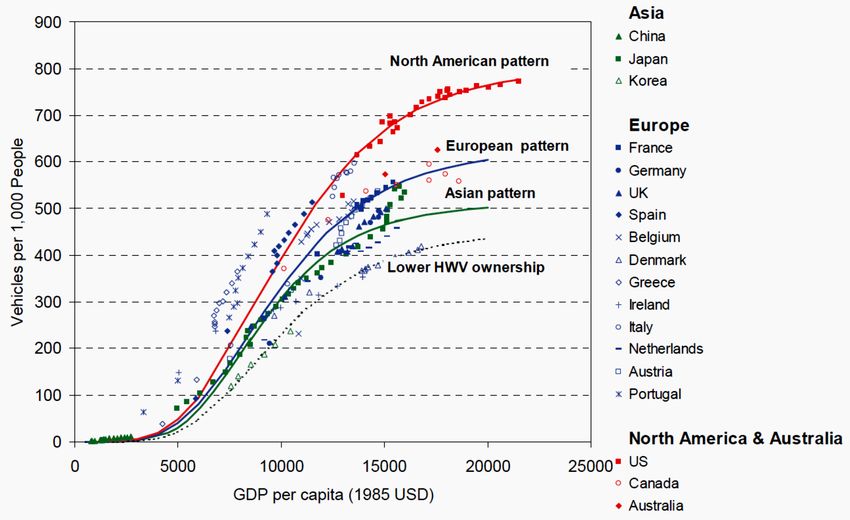
Abbreviations and Acronyms

BRT      Bus rapid transit                    MoE     Ministry of Energy
CHF      Swiss Franc                          MoEnv   Ministry of Environment
CO       Carbon monoxide                      MoESD   Ministry of Economy and
CO2      Carbon dioxide                               Sustainable Development
EC       European Commission                  MoRDI   Ministry of Regional Development
EEV      Enhanced Environmentally-friendly            and Infrastructure
         Vehicles                             NOX     Mono-nitrogen oxide
EFFECT   Energy Forecasting Framework and     NTA     National Tourism Agency
         Emissions Consensus                  OECD    Organization for Economic Co-
EPA      Environmental Protection Agency              operation and Development
ESMAP    Energy Sector Management             PM      Particulate matter
         Assistance Program                   Ro-Mo   Rolling Motorway
EU       European Union                       Ro-Ro   Rolled-on and rolled-off
EV       Electric vehicles                    RUC     Road user charges
GDP      Gross Domestic Production            SO2     Sulfur dioxide
GEL      Georgian lari                        TPD     Transport Policy Department within
GHG      Green house gas                              the MoESD
GIZ      Deutsche Gesellschaft für            TRACECA Transport Corridor Europe-
         Internationale Zusammenarbeit                Caucasus-Asia
HC       Hydro carbon                         TWh     Terawatt-hour
IEA      International Energy Agency          UNFCCC United Nations Framework
ITS      Intelligent transportation systems           Convention on Climate Change
LLC      Limited Liability Company            VOC     Volatile organic compounds
LRT      Light rail transit                   WDI     World Development Indicators
LTA      Land Transport Agency

                  Regional Vice President:     Philippe H. Le Houérou, ECAVP
                        Country Director:      Asad Alam, ECCU3
                          Sector Director:     Laszlo Lovei, ECSSD
                         Sector Manager:       Henry G. R. Kerali, ECSSD
                       Task Team Leader:       Jung Eun Oh, ECSSD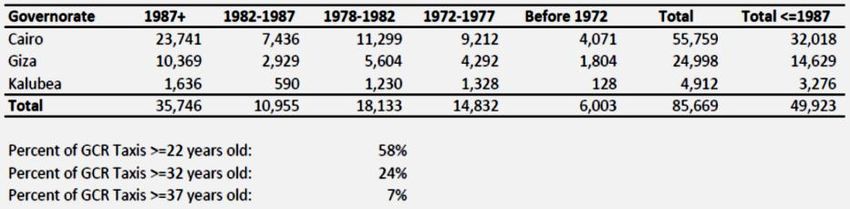
Table of Contents

Acknowledgement ....................................................................................................................................... v

Executive Summary ................................................................................................................................... vi

I.        Framing the Policy Questions ........................................................................................................ 1
     A.   What is Green Transportation? ......................................................................................................... 1
     B.   What is the Rationale for Green Transportation? ............................................................................. 1
     C.   What is the Rationale for Government’s Involvement in Greening Transportation? ....................... 5

II.       Defining the Goal, Principle, Instruments and Scope .................................................................. 8
     A.   Goal: Reduce Total Cost of Transportation ...................................................................................... 8
     B.   Principle: Influence and Improve Transport User Choices ............................................................... 8
     C.   Instruments: Tools to Influence and Improve Transport User Choices ............................................ 9
     D.   Scope: Transport Network and Key Sub-sectors in Georgia .......................................................... 12

III.      Policy Framework for Green Transportation in Georgia ......................................................... 14
     A.   Integrate Environmental Concerns into Transport Policy ............................................................... 14
     B.   Achieve and Maintain a Greener Vehicle Fleet .............................................................................. 18
     C.   Promote Low Emission Freight Transport Modes .......................................................................... 25
     D.   Support Commercial Development of Intercity Passenger Transport Services .............................. 32
     E.   Transform Minibuses and Taxis into Modern Urban Transport Modes ......................................... 37
     F.   Support Sustainable Development of Urban Transport .................................................................. 42

IV.       Summary and Roadmap of Priority Actions .............................................................................. 47
     A.   Summary of the proposed Green Transportation Policy Framework ............................................. 47
     B.   Business-As-Usual vs. Green Transportation Scenarios ................................................................. 49
     C.   How to Implement the Policy Framework: Roadmap for Green Transportation ............................ 53

ANNEX 1: EFFECT Analysis Methodology .......................................................................................... 56
     A.   EFFECT: Energy Forecasting Framework and Emissions Consensus Tool ................................... 56
     B.   Data used in the analysis ................................................................................................................. 58
     C.   Assumptions used in the analysis.................................................................................................... 67

ANNEX 2: London’s Electric Vehicle Deployment Program ............................................................... 69

                                                                                                                                                        i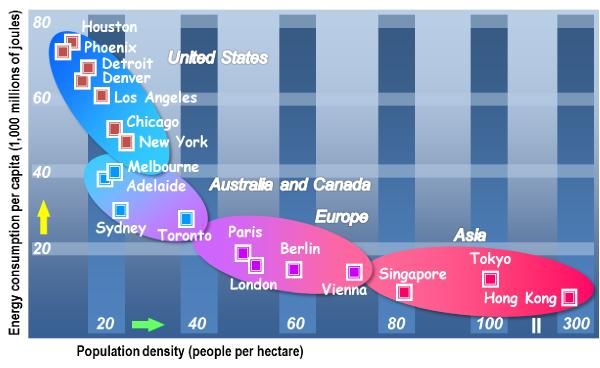
A.      Policy Drivers ................................................................................................................................. 69
   B.      Charging Infrastructure ................................................................................................................... 69
   C.      Vehicle Technology ........................................................................................................................ 70
   D.      Implementation ............................................................................................................................... 70

ANNEX 3: Review of Vehicle Replacement and Retrofit Programs .................................................... 72
   A.      Scrapping and Relocation Programs ............................................................................................... 72
   B.      Vehicle Replacement ...................................................................................................................... 73
   C.      Retrofit Programs ............................................................................................................................ 74

References .................................................................................................................................................. 76

                                                                                                                                                              ii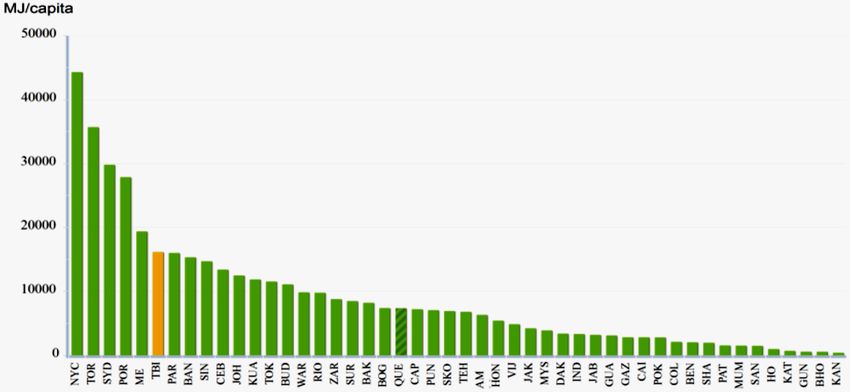
List of Figures and Tables
Figure 1: Oil imports as a substantial share in overall merchandise imports ............................................... 2
Figure 2: Georgia’s hydropower share in overall energy production is high ............................................... 3
Figure 3: Road Transport is Responsible for a Major and Growing Share of Emissions ............................ 4
Figure 4: Vehicle ownership growth trajectories vary greatly by country even at same income level ........ 5
Figure 5: Possible trajectories of motorization rate growth in Georgia ....................................................... 6
Figure 6: International Transport Corridors and Major Intermodal Junctions in Georgia ......................... 13
Figure 7: European Union Vehicle Emission Standards for HC and NOx ................................................ 15
Figure 8: Correlation between fuel prices and transport fuel consumption in OECD countries ................ 17
Figure 9: Gasoline prices in Georgia lower than the Region’s median...................................................... 17
Figure 10: Relatively high gasoline prices in Georgia as a share of monthly income per capita............... 17
Figure 11: Significantly higher average age of vehicle fleet in Georgia comparing to EU-27 countries .. 18
Figure 12: Vehicle Fleet Age Distribution by Vehicle Type ..................................................................... 18
Figure 13: Strong positive correlation between GDP and motor vehicle ownership ................................. 19
Figure 14: Vehicle ownership growth much faster than GDP growth between $4,000-8,000 per capita .. 19
Figure 15: The growing share of transit cargo of total international road transport .................................. 25
Figure 16: The decreasing share of railway transport† of total transit cargo.............................................. 25
Figure 17: Containerized cargo volume handled in Georgian seaports has increased rapidly ................... 26
Figure 18: Minibuses fleet in Georgia is old and getting older over time................................................. 37
Figure 19: Total Transportation Energy Use per Capita (MJ/person)....................................................... 42
Figure 20: Comparison of first hour on-street parking charges in Tbilisi and Western European cities .. 42
Figure 21: Strong inverse correlation between population density and energy consumption per capita .. 43
Figure 22: International comparison of public transport mode: Capacity vs. Capital Costs ...................... 45
Figure 23: Vehicle-kilometers-traveled under the business-as-usual scenario .......................................... 49
Figure 24: Vehicle-kilometers-traveled under the green transportation scenario ...................................... 49
Figure 25: Motor fuel consumption under the business-as-usual scenario ................................................ 50
Figure 26: Motor fuel consumption under the green transportation scenario ............................................ 50
Figure 27: CO2 emissions from road transport under the business-as-usual scenario ............................... 50
Figure 28: CO2 emissions from road transport under the green transportation scenario ........................... 50
Figure 29: Modular Structure of EFFECT ................................................................................................. 56
Figure 30: EFFECT Modeling Framework ............................................................................................... 58
Figure 31: Winfrey S3 Survival Curves ..................................................................................................... 62
Figure 32: Projection of on-road vehicle fleet ........................................................................................... 64

Table 1: Transport modal share in Georgia ................................................................................................ 12
Table 2: Measures that promote cleaner fuels in Eastern Europe, South Caucasus and Central Asia ....... 16
Table 3: Comparing Vehicle Scrapping Programs ..................................................................................... 20
Table 4: Schedule of Compulsory Motor Vehicle Inspection in Singapore by Vehicle Age ..................... 24
Table 5: Comparing transit charges for heavy vehicles ............................................................................. 26
Table 6: Comparing passenger transport modes between major destinations ............................................ 32
Table 7: Taxi regulations in high-income countries ................................................................................... 38
Table 8: Summary of the Proposed Green Transportation Policy Framework .......................................... 47
Table 9: Comparison of business-as-usual and green transportation scenario for 2012-2027 ................... 51

                                                                                                                                           iii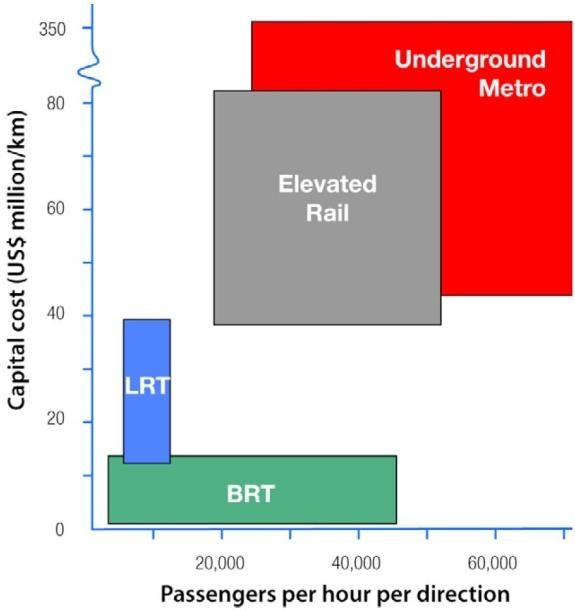
Table 10: Green transportation scenario: fuel consumption and emissions reductions by contributing
factors.......................................................................................................................................................... 52
Table 11: EFFECT input data and sources ................................................................................................. 58
Table 12: Vehicle classification used in EFFECT ..................................................................................... 59
Table 13: Assumptions on vehicle standards ............................................................................................. 60
Table 14: Technological advancements considered in EFFECT ............................................................... 65

                                                                                                                                                                 iv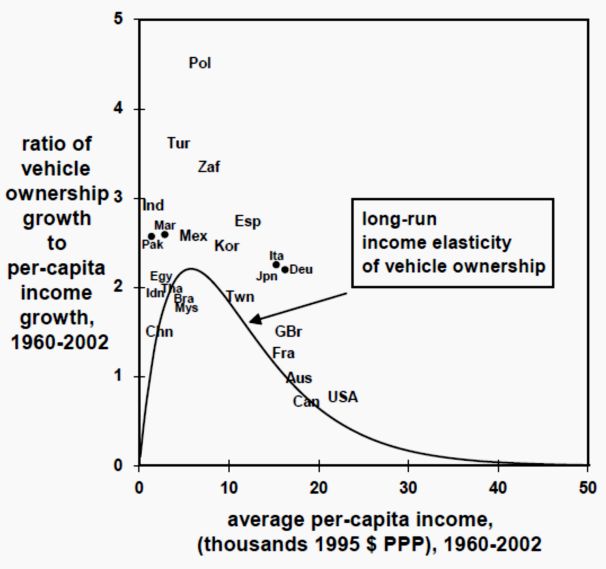
Acknowledgement

This report was prepared by the World Bank team led by JungEun Oh (Task Team Leader, Transport
Economist, ECSS5) and including Andreas Kopp (Lead Transport Economist, TWITR) and Irina Trukhan
(Junior Professional Associate, ECSS5). Pedzi Makumbe (Infrastructure Specialist, SEGES) provided
support on data processing and input parameters for the EFFECT analysis, and wrote Annex 2. Michael
Butler (Junior Professional Associate, ECSS5) assisted on literature review and data collection. The
management support and oversight was provided by Asad Alam (Country Director, ECCU3), Henry
Kerali (Sector Manager, ECSS5), and Ahmed Eiweida (Country Sector Coordinator, ECSSD). The paper
was peer-reviewed by Uwe Deichmann (Senior Environmental Specialist, ECACE), Roger Gorham
(Transport Economist, AFTTR), and Jordan Z. Schwartz (Lead Economist, LCSSD).

The World Bank team is grateful for the support provided by the Ministry of Economy and Sustainable
Development of Georgia throughout this study. The analysis in this report greatly benefited from the
discussions with the senior officials of the various ministries and other government agencies of Georgia,
including the Ministry of Economy and Sustainable Development, Ministry of Finance, Ministry of
Interior Petrol Police, Ministry of Environment Protection, Ministry of Energy and Natural Resources,
Ministry of Regional Development and Infrastructure, National Tourism Agency, Land Transport
Agency, Georgian Railway, Tbilisi City Hall, Batumi City Hall, Kutaisi City Hall, Rustavi City Hall,
Georgian International Road Carrier Association, and Union of Oil Products Importers and consumers.

                                                                                                       v
Executive Summary

              What is green transportation and why is it important for Georgia?
The Government of Georgia has long recognized that improving transport infrastructure and services is a
critical prerequisite to enhance competitiveness and achieve long-term sustainable economic growth. In
addition to investing in developing transport infrastructure, Government is also considering improving
the efficiency and quality of transport services, and mitigating the negative environmental and health
impacts of transportation by greening transportation.
The rationale for greening transportation in Georgia goes beyond the need to reduce greenhouse gas
emissions, which is typically the primary objective of the emerging framework of green and low-carbon
development. In fact, in Georgia the additional economic and development challenges are the growing
fossil fuel imports that contribute to a large current account deficit and the increasing air pollution caused
by road transport that add to healthcare costs. Despite these challenges, Georgia has opportunities to
achieve the greening objective while at the same time reducing the economic impact of fossil fuel
imports: the country has abundant indigenous energy sources, mainly hydropower, and although
motorization rates are rising, it is still early enough to take actions—through policies and investments—to
reshape longer-term patterns in the transport sector and in consumer choices.
Therefore, for the purpose of this study, “green transportation” refers to reduced intensity of fossil fuel
use and increased reliance on the country’s indigenous energy sources (mainly hydropower), as well as
minimized adverse impacts on the global and local environment through reduced emissions of greenhouse
gases and local pollutants. This paper argues that Government interventions are essential for green
transportation because the current transport market lacks a mechanism to reduce the large negative
externalities (emissions and congestion), and infrastructure and consumer patterns established now would
take long to change. By pursuing a green transportation strategy, the Government of Georgia aims to
achieve the following development objectives:
Reducing reliance on energy imports. Georgia relies entirely on imported energy to meet its
transportation needs; the import bill for petroleum fuels comprises a significant share of the overall
import bill, has substantial impacts on balance of trade, contributes to a large current account deficit and
results in foreign currency shortages for other imports that Georgia requires for national development.
Petroleum fuel imports, used almost entirely for transportation, increased about ten-fold during 1999-
2008. During 2010, the total import bill for petroleum and hydrocarbon fuels was about US$832 million,
or 16 percent of total imports and more than 7.0 percent of gross domestic product (GDP). During
January-May 2011, the import bill for gasoline alone grew by 27 percent compared to the same period in
2010, primarily due to global price increases. Green transportation measures will help reduce fossil fuel
consumption and increase the share of hydropower use for transportation, which supplies about 90
percent of total national electricity needs. Georgia has potential to expand current capacity: it is estimated
that only 23 percent of the economically feasible potential of 32 TWh is now being used.
Reversing the growing menace of air pollution. In Georgia the main source of air pollution is road
transport, which emits a major and growing share of pollutants, including carbon monoxide (CO),
hydrocarbons—mostly volatile organic compounds (VOC) and methane, nitrogen oxides (NOx), sulfur
dioxide (SO2), soot, benzopyrene and carbon dioxide (CO2) These pollutants are present in areas with

                                                                                                           vi
intensive trafficlarge urban areas and along main road corridorsmost acutely observed in Tbilisi.
Georgia’s cities have lower levels of individual vehicle use, but minibus fleets have high emission
intensity, contribute to congestion and disrupt traffic; emissions are also rising from other vehicles.
Strengthening Georgia’s position as a regional trade hub and tourism destination by developing
efficient and clean transport services. Georgia’s position along an important international transit corridor
gives it an important role in international trade and transportation. Georgia’s tourism sector has grown
rapidly in recent years; its natural endowment and rich cultural heritage is expected to fuel further growth.
Improved transport services are critical to these sectors. Better transport infrastructure and services
would: (i) strengthen the competitiveness of Georgian goods; (ii) lower prices for Georgian consumers;
(iii) strengthen Georgia’s position as an international transshipment country for the region; (iv) improve
access to tourism destinations; (v) improve regional integration; and (vi) enhance rural communities’
access to markets and social services.
Proposed Policy Framework for Greening Transportation
Goal: Reduce transportation costs. The primary goal of a green transport policy framework would be to
reduce the total cost of transportation including all direct and indirect costs, while maintaining total social
welfare benefits. Direct and indirect costs borne by private parties would be lowered through improved
infrastructure, and fair competition among modes and operators. Indirect costs, borne by society, would
be reduced by mechanisms that internalize quantifiable external costs.
Principle: Influence and Improve consumer choices. At the heart of green transportation is consumer
choice about whether to move, when to move, which route to take, which mode and vehicle to use and so
forth. In the aggregate, transport user decisions establish the degree of green transportation, which in turn
affects levels of environmental impact and economic development, national dependence on petroleum
products, air pollution, transport costs, and labor productivity. Therefore Government needs to adopt
policies that provide incentives for greener transportation and improve options available to consumers.
Georgia has made significant progress toward a market economy, and greening policy measures should
not undermine the market economy.
Instruments. Various instruments, institutions and planning, regulations and enforcement, fiscal policy
and pricing, and investments need to be balanced to achieve the following six policy objectives:
A. Integrate environmental concerns into transport policy. Although road transport is the major
contributor to air pollution, Georgia’s environmental objectives are not yet reflected in transport policies
and the existing regulatory framework is not enforced. Government aspires to achieve green
transportation but Georgia’s existing transport policy fails to acknowledge the growing environmental
damage inflicted by the transport sector. An integrated transport policy should specify air pollution
reduction as an objective and set achievable target emission levels. Inter-ministerial collaboration is
critical to share data, exchange knowledge, make and implement policies.
B. Achieve and maintain a greener vehicle fleet. A growing influx of older vehicles coupled with
rising demand for private cars is causing rapid deterioration of air quality. As a time-bound policy,
Government can consider various fiscal measures, including a vehicle scrapping-and-recycling program,
vehicle retrofitting program, and other financial incentives for use of cleaner vehicles. Also importantly,
viicurrent vehicle inspection that is limited to operators that provide international transport services needs to
be expanded to other commercial operators. Enforcement capacity needs to be strengthened.
C. Promote Low Emission Freight Transport Modes. Georgia needs to develop a comprehensive
transport policy to promote low emission freight transport modes, particularly rail transport, through
improved intermodal connectivity and international collaboration with key trading partners and
neighboring countries. This requires a national transport strategy, investment programs that coordinate all
modes, and a strategic vision to improve intermodal connectivity and lower overall transportation costs
and harmful effects on the environment. High priority investments include rail-road transshipment
facilities, port development, and container handling facilities.
D. Support commercial development of intercity passenger transport services. The under-regulated and
under-developed intercity passenger transport market is fragmented; transport services are irregular and
unattractive to consumers, and because technical inspections are rare, vehicle condition is poor. Georgia
should introduce measures to require operators of intercity bus services to renew and upgrade their
vehicle fleet and consolidate all intercity bus services in an integrated passenger information service,
participation in which can be made a tool to control market entry. Government through the National
Tourism Agency and the Land Transport Agency could select strategic routes and control and monitor
service quality on those routes.
E. Transform minibuses and taxis into modern urban transport modes. Minibuses are essential to the
daily life of average Georgians but existing services are an inferior mode of transport lacking comfort,
privacy and safety, hence are used by a captive clientele without other options. The taxi market is
unregulated with respect to market entry, vehicle condition, service quality, and fares. Improving urban
transport choices requires strategic planning toward a coherent multimodal public transport system,
including legal and regulatory frameworks, competitive tendering, and gross-cost based contracting. To
lower the costs of public transport services—including operating costs and externalities—while ensuring
service quality, a legal framework should establish conditions for competition among service providers,
including municipal companies and private sector participants.
F. Support sustainable development of urban transport. The Georgian urban transport sector,
particularly in Tbilisi, consumes more energy per capita than many other cities in developed and
developing countries. Building a sustainable urban transport system requires comprehensive planning in
addition to balanced and multi-modal transport infrastructure development driven by a long-term vision
with a mix of fiscal incentives, regulatory policies and investment in multi-modal urban transport
systems. Although municipal authorities are responsible for urban transport, Government can establish a
national policy framework, legal and regulatory framework, and national technical standards. Government
can facilitate knowledge-sharing and technical capacity building, and allocate budgetary resources to
promote technological innovations and generation of national public goods.
viiiSummary of the Proposed Green Transportation Policy Framework
Institutions and Planning Regulations and Enforcement Fiscal Policy and Pricing Investments
A. Integrate Environmental Concerns into Transport Policy
Integrate transport policy Reinstate fuel quality inspection Revise taxes on motor fuels
and environmental to be differentiated by
monitoring quality as incentives for
cleaner fuel choices
Maintain high fuel prices
relative to income levels as
a long-term policy
B. Achieve and Maintain a Greener Vehicle Fleet
Strengthen institutions for Expand vehicle inspection Scrap and recycle the old Subsidize the scrapping
effective enforcement requirements to include all and polluting vehicle fleet and recycling of old and
commercial and non- Tax credits and other polluting vehicles
commercial vehicles financial incentives for
higher fuel-efficiency and
technological
improvements of vehicles
C. Promote Low Emission Freight Transport Modes
Develop a coherent Apply vehicle inspection Differentiate charges on Develop multimodal, green
transport policy that regime to domestically transit trucks according to transit corridors by
focuses on intermodality registered trucks and to vehicle emission class and improving intermodal
and international Georgian transport companies axle loads connectivity, eliminating
collaboration with key Introduce and enforce Allocate revenues to the bottlenecks and supporting
trading partners and regulations on vehicle maintenance of road containerization
neighboring countries emissions and axle loads for network assets and green
foreign registered transit transport investments
vehicles
D. Support Commercial Development of Intercity Passenger Transport Services
Improve the convenience Control market entry through Improve quality of
of and access to intercity regulations and enforcement of infrastructure and
bus services through vehicle and emission standards consumer amenities
coordinated marketing Introduce competitive tendering through public and private
strategy and passenger for strategic intercity routes and investments
information services manage service quality
E. Transform Minibuses and Taxis into Modern Urban Transport Modes
Develop a strategic vision Minibus market: introduce Refrain from direct
and strengthen market competitive tendering and budgetary support for
competition for minibuses gross-cost based contracting vehicle improvement
and taxis Taxi market: introduce partial Oblige commercial entities
Develop a strategy for regulations that control fare and to maintain their vehicle
coherent multimodal quality but allow free market- fleet quality
public transport system entry
F. Support Sustainable Development of Urban Transport
Develop a national-level Make private car use less Make private car use more Invest in high-quality and
urban transport policy convenient by introducing expensive through competitive alternatives to
framework parking restrictions in urban appropriate forms of road private transport
Institute integrated city centers user charges Introduce intelligent
development and transport transportation systems for
planning efficient traffic
management and better
user services in urban areas
ixExpected benefits: positive fiscal implications. In addition to the environmental benefits estimated in the
analysis below, the policy framework would help reduce fuel imports, and hence, the current account
deficits. At the same time, the proposed fiscal and pricing measures would not be inconsistent with the
current administrative philosophy that pursues small government. The proposed taxes and subsidies do
not automatically lead to bigger government or increased tax burden on households and firms. Income
(households) and cost (firms) effects of such fiscal measures can partly be compensated for by allocating
revenues on developing green transport modes or reducing taxes that have negative effects on economic
growth. Appropriate levels of taxes and other charges need to be identified through a follow-up research.
Implementation: public outreach and phased approach. Public outreach and phased approach would
mitigate political risks and administrative difficulties during implementation of the framework. Public
acceptance of fiscal and regulatory measures can be won through a public outreach strategy that
highlights the service-fee nature of certain pricing measures and the social costs of environmental
externalities. The proposed fiscal and pricing measures target the sources of pollution and inefficient use
of motor fuels and can easily be formulated and communicated as “fees” that need to be paid for polluting
the environment or for using transport infrastructure and services, instead of “taxes” on vehicles or fuels.
In addition, to minimize the contact between public officials and the public, phased implementation of
regulatory measures is recommended, starting with fuel quality inspection, which poses lowest
governance risks, and expanding vehicle inspection to include all commercial operators.
Economic and Environmental Benefits of Greening Transportation
The economic and environmental benefits of the proposed framework for green transportation have been
estimated for a 15-year period (2012-2027) using the EFFECT (Energy Forecasting Framework and
Emissions Consensus Tool) framework by comparing two scenarios: business-as-usual or adopting the
green transportation policy framework. The EFFECT framework predicts future vehicle ownership and
transport demand on the basis of the baseline ownership and transport data, future economic and
population growth, fuel prices, mode choice patterns, and anticipated improvements and changes in
vehicle technologies. Under the green transportation scenario, it is estimated that Georgians will drive
about 4.0-6.0 percent less than under the business-as-usual scenario, which would reduce motor fuel
consumption by about 1,746 to 1,825 million tons over the 15 year period, equivalent to 9 billion GEL of
fuel cost savings (discounted net present value). The CO2 emissions would drop by an estimated 2,797 to
5,338 million tons and most local pollutant emissions would be substantially reduced: a 22 to 67 percent
drop in CO emissions, 26 to 54 percent drop in VOC emissions, and 11 to 23 percent drop in NOx
emissions. Other indirect benefits, while not quantitatively measured, would include reduced traffic
congestion, road traffic casualties, and healthcare costs.
xVehicle-kilometers-traveled
Business-as-usual Green transportation
billion vehicle-km/ year billion vehicle-km/ year
25 25
HCV LCV PC HCV LCV PC
3W 2W 3W 2W
20 20
15 15
10 10
5 5
0 0
Motor fuel consumptions
Business-as-usual Green transportation
million tons / year million tons / year
2.2 2.2
HCV LCV PC HCV LCV PC
2.0 2.0
3W 2W 3W 2W
1.8 1.8
1.6 1.6
1.4 1.4
1.2 1.2
1.0 1.0
0.8 0.8
0.6 0.6
0.4 0.4
0.2 0.2
0.0 0.0
xiCO2 emissions from road transport
Business-as-usual Green transportation
million tons / year million tons / year
7.0 7.0
HCV LCV PC HCV LCV PC
3W 2W 3W 2W
6.0 6.0
5.0 5.0
4.0 4.0
3.0 3.0
2.0 2.0
1.0 1.0
0.0 0.0
Comparison of business-as-usual and green transportation scenario for 2012-2027
Business-as- Green Transportation
Indicators
usual Moderate Aggressive
Total vehicle-km on road (million) 258,235 249,319 (-4%) 244,075 (-6%)
Total fuel consumption (thousand tons) 23,492 21,746 (-7%) 21,667 (-8%)
Total fuel costs, excluding electricity
96,226 87,434 (-9%) 87,331 (-9%)
(million GEL)a
Total electricity use (GWh) 46,249 63,255 (+37%) 75,992 (+64%)
Total passenger-km by road (million) 730,502 664,955 (-9%) 689,451 (-6%)
Total passenger-km by rail and electric
30,490 62,600 (+105%) 77,633 (+155%)
public transport (million)
Total ton-km by road (million) 524,924 489,010 (-7%) 453,096 (-14%)
Total ton-km by rail (million) 154,504 190,420 (+23%) 226,335 (+47%)
Total CO2 emissions (thousand tons) 71,793 68,996 (-4%) 66,455 (-7%)
Total CO emissions (thousand tons) 1,200 392 (-67%) 941 (-22%)
Total VOC emissions (thousand tons) 178 82 (-54%) 131 (-26%)
Total NOx emissions (thousand tons) 458 351 (-23%) 406 (-11%)
Note: All values are aggregate sums for the period 2012-2027
a
Discounted
xiiRoadmap of Priority Actions
Measures proposed in the above policy framework can be prioritized based on urgency and sequencing.
The proposed roadmap below lays out priority actions for the short-term (2012-2014), medium-term
(2015-2020), and longer-term (after 2020).
Short-Term (2012-2014): Institutional Capacity and Preparatory Tasks
Objectives Actions Responsible Entities
Strengthen the 1.1) Include environmental objectives and targets in (Lead) MoEnv;
institutions and national and municipal transport policies (Support) TPD
policies at national 1.2) Develop and implement an environmental monitoring (Lead) MoEnv;
and municipal level framework, including ambient air quality measurement (Support) TPD
1.3) Update regulatory framework stipulated in Presidential (Lead) LTA;
Decree No. 302, introducing phased implementation plans (Support) MoEnv, MoE,
with defined targets at each phase, streamline administrative MoESD
procedures with a plan to outsource actual implementation.
1.4) Strengthen inter-agency collaboration among Council of Ministers
ministries, and between national government and municipal
authorities
Carry out 1.5) Assess appropriate levels of transit truck charges by (Lead) TPD, MoRDI;
preparatory work emission class and weight, and possibly by distance, devise (Support) MoESD
and studies for an implementation plan, including an electronic toll
medium-term collection system
actions 1.6) Carry out green logistics study, assessing feasibility of (Lead) TPD;
containerization and transshipment facilities such as Ro-Mo (Support) MoRDI,
and Ro-Ro and identify investment needs Georgian Railway
1.7) Develop strategy for intercity passenger transport (Lead) TPD;
based on ongoing market analysis (Support) NTA
1.8) Develop strategy for minibus reform, identifying steps (Lead) TPD;
to introduce competitive tendering and evaluating feasibility (Support) Municipalities
of gross-cost vs. net-cost contracting
1.9) Research taxi regulations, investigating current market (Lead) LTA;
condition and identifying appropriate level of regulations (Support)
Municipalities, TPD
1.10) Develop urban transport strategic plans in cities other (Lead) Municipalities;
than Tbilisi (Support) TPD
1.11) Carry out alternative analysis and/or feasibility (Lead) Municipalities;
studies for public transport modes in Georgian cities, (Support) TPD
including trams, ropeways, LRT, BRT
Note: MoESD (Ministry of Economy and Sustainable Development), TPD (Transport Policy Department within the MoESD),
MoEnv (Ministry of Environment), MoE (Ministry of Energy), MoRDI (Ministry of Regional Development and Infrastructure),
LTA (Land Transport Agency) NTA (National Tourism Agency), Ro-Mo (rolling motorway), Ro-Ro (rolled-on and rolled-off)
xiiiMedium-Term (2015-2020): Enforcement, Market Reforms, and Infrastructure
Objectives Actions Responsible Entities
Implement the 2.1) Based on updated regulatory framework developed (Lead) LTA or a new
improved under (1.3), enforce fuel quality standards designated agency;
regulatory (Support) MoEnv, MoE
framework 2.2) Expand vehicle inspections to all commercial vehicles, (Lead) LTA, Police;
including those providing domestic services (Support) MoEnv
2.3) Institute administrative procedures for periodic vehicle (Lead) Police, LTA;
registration combined with compulsory safety and emissions (Support) TPD, MoEnv
inspection for all privately owned vehicles
2.4) Establish test facility for technical inspection and start (Lead) LTA, Police;
pilot implementation in selected cities and regions Support municipalities
Promote market 2.5) Implement intercity passenger transport strategy (Lead) NTA, TPD
competition developed under (1.8) (Support) MoF
through key sub- 2.6) Implement in-city minibus market reform strategy (Lead) Municipalities
sector reforms developed under (1.9) (Support) TPD
2.7) Based on the findings from (1.10), implement reforms (Lead) Municipalities
of the urban taxi market, starting in a pilot city (Support) LTA, TPD
Develop 2.8) Implement revised transit truck charges based on the (Lead) MoRDI or a
infrastructure for assessment and implementation plan prepared under (1.5) designated entity;
lasting (Support) TPD
transformation 2.9) Based on study results from (1.6), prepare and (Lead) MoRDI, Georgian
implement infrastructure investment projects for new Railway, Port authorities,
intermodal facilities, transshipment terminals, capacity municipalities
expansion, etc. (Support) TPD, MoF
2.10) Based on study outcomes from (1.11), prepare and (Lead) Municipalities
implement public transport capital investment projects: (Support) TPD, MoF
possible projects include fleet renewal, new investments in
public transport trunk corridor development, infrastructure
and facility for non-motorized transport, and ITS measures
Note: MoF (Ministry of Finance), MoESD (Ministry of Economy and Sustainable Development), TPD (Transport Policy
Department within the MoESD), MoEnv (Ministry of Environment), MoE (Ministry of Energy), MoRDI (Ministry of Regional
Development and Infrastructure), LTA (Land Transport Agency). NTA (National Tourism Agency)
Long-Term (2020 and after): Transformation
Objectives Actions
Transform mobility 3.1) Institute financial incentives to adopt technologies to improve fuel efficiency
using advanced 3.2) Evaluate alternative propulsion technology options including electric vehicles
technologies
3.3) Invest in infrastructure and facilities to support deployment of new technologies
Shape green mobility 3.4) Introduce appropriate road pricing measures, including congestion pricing
patterns 3.5) Incorporate environmental considerations in the existing taxation structure
xivI. Introduction: Framing the Policy Questions
A. What is Green Transportation?
The Government of Georgia is considering options for reducing fossil fuel imports in favor of introducing
large scale use of domestic energy sources for public and private transportation. However, this must be
considered within the overall context of green transportation—which would generate benefits well
beyond the substitution of fossil fuels with domestic energy sources.
The concept of green transportation has emerged in response to growing concerns about climate change;
typically this refers to a transportation system characterized by low carbon emissions, i.e., green house
gasses (GHG). In the context of Georgia, two other important development issues in green transportation
in addition to GHG emissions are fossil fuel consumption and air pollution. For the purpose of this study,
therefore, green transportation in Georgia refers to reducing the intensity of fossil fuel use and
increasing reliance on indigenous energy sources (mainly hydropower), as well as minimizing
adverse impacts on the global and local environment through reduced emissions of GHG and local
pollutants.
Greening transportation would create “co-benefits”: (i) reducing fossil fuel use would help improve the
balance of trade and energy security; and (ii) employing measures to avoid unnecessary trips and using
fewer vehicles for the same number of trips (i.e., public transportation) would reduce traffic congestion
on the road network, particularly in urban areas.
B. What is the Rationale for Green Transportation?
Role of the Transport Sector in Georgia’s Growth
Developing transport infrastructure and services is essential to realize Georgia’s growth potential.
Improved transport and services would support development of sectors that are key to national economic
growthexports, tourism, and agriculture. Well-developed transport infrastructure and services would:
(i) improve the competitiveness of Georgian goods; (ii) lower prices for Georgian consumers; (iii)
strengthen Georgia’s position as an international transshipment country for the region; (iv) improve
access to tourism destinations; (v) improve regional integration; and (vi) enhance rural communities’
access to markets and social services. Access to and affordability of transport services would foster
transformational changes of the Georgian economy. Increasing transport sector efficiency helps create
jobs and improve job quality, and generates productivity increases in agriculture, manufacturing and the
services sector. This relates not only to market prices for transport services, but also to travel times,
reliability and quality of transport services, and a connectivity between the different service providers.
Low transport costs, which can be attained by well-developed infrastructure and competitive transport
services, will help generate jobs and gradually improve productivity, first in agriculture and increasingly
in manufacturing and in high-value services.
Government has long recognized the importance of upgrading national transport infrastructure to
international standards of serviceability and has allocated substantial public resources for this. In 2011
more than 50 percent of Government’s total planned capital investment was allocated for transport
infrastructure or about 580 million GEL out of about 1.0 billion GEL (including donor funding).
However, to achieve the goals of improving local industries’ competitiveness and achieving long-term
sustainable economic growth, Government must also invest in the modernization of transport services.
1Balance of Trade and Energy Security
By greening transportation, Georgia could Figure 1: Oil imports as a substantial share in overall
reduce the total import bill for petroleum merchandise imports
products, thereby improving the balance of ($ billion) (million tons)
7 1.0
trade and energy security. Georgia relies Merchandise imports (current US$)
entirely on imported energy to meet its 6 Fuel imports (current US$)
Fuel imports (million tons) 0.8
transportation needs; the import bill for 5
petroleum fuels comprises a significant share 0.6
4
of the overall import bill, has substantial
impacts on balance of trade, contributes to a 3 0.4
large current account deficit (above -10 2
percent of gross domestic product (GDP) 0.2
1
since 2003, except in 2004, peaking at -23
percent in 2008), and results in foreign 0 0.0
currency shortages for other imports Georgia
needs for national development. Petroleum
Source: World Bank Development Indicators 2011, the Union of Oil
fuel imports, used almost entirely for Products Importers and Customers of Georgia
transportation, increased about ten-fold
during 1999-2008; although during the same period the share in overall merchandise imports fell from 23
percent to around 18 percent. Fuel import volumes are also steadily increasing since the global financial
crisis (Figure 1). During the financial crisis overall imports plummeted but have been recovering. In 2010,
the total import bill for petroleum and hydrocarbon fuels—including about 810 million liters of gasoline
and diesel—was about US$832 million, or about 16 percent of total imports and more than 7.0 percent of
GDP. Also in 2010, the import bill increased by 17 percent from US$710 million in 2009; its share of
GDP also increased from 6.6 to 7.2 percent; the import bill for gasoline alone grew by 27 percent between
January and May 2011, compared to the same period in 2010, primarily due to global price increases.
Catalyst for Service Sector Development
Increasing international trade in the region provides opportunities for Georgia’s transport sector to
increase national foreign currency earnings. According to the statistics for international trade in
services, transport services, including deflated values of freight and passenger transport, account for more
than 50 percent of Georgia’s commercial services exports. The tourism sector, a key service industry in
Georgia, critically depends on improving transport connectivity and developing efficient transport
services. Recently, tourist numbers have expanded rapidlyup about 45 percent during January-June
2011 over the same period in 2010. Tourism sector annual export value reached almost US$500 million
by end-2010, or about 4.0 percent of GDP. New developments for the sector are ongoing throughout
Georgia, which calls for more transport infrastructure development to provide reliable and high-quality
transport services at lower costs.
Potential for Increasing Hydropower Generation
Greening transportation would provide an opportunity to utilize national hydropower potential
more efficiently for economic growth. Georgia exports hydro-generated electricity and has potential to
expand existing capacity, which supplies about 90 percent of total national electricity needs (Figure 2)
2and is estimated to be only 23 percent of the economically feasible potential of 32 TWh. However hydro-
generated electricity supply is seasonal; during summerhigh seasongeneration is about 160 percent of
domestic demand and part of the surplus—now about 1 TWh—is exported, mainly to Turkey. During the
winter season, supply shortages are supplemented by thermal generation and an electricity-swap with
Turkey. In the longer-term, Government aspires to meet Georgia’s electricity demand solely from
hydropower and to increase exports of excess supply. To achieve this, five hydropower plants are now
under construction and contracts have been signed for another 16. An additional 20 new plants under
consideration would increase electricity
Figure 2: Georgia’s hydropower share in overall energy
generation capacity by about 3000 MW. This production is high
increased capacity, plus the future completion 9
of transmission grids, led to Government 8
expectations of being able to increase 7
electricity exports to Turkey by as much as 10 6
to 15 times current levels. Electricity 5
production from hydropower sources has 4
gradually increased and makes up about 86
3
percent of total production, but this has not led Electricity production (TWh)
2
to reduced dependence on imported energy. Electricity production from hydroelectric sources (TWh)
1
Instead, the share of imported energy in
0
overall energy use has increased and reached 1999 2000 2001 2002 2003 2004 2005 2006 2007 2008
almost 70 percent of all energy use before the
Source: World Bank Development Indicators 2011
financial crisis.1
Negative Impacts of Road Transport on the Global and Local Environmental
Greening transportation would lower greenhouse gas emissions from road transport, contributing
to the global public goods. Transport sector accounts for about 40 percent of Georgia’s CO2 emissions.
According to International Energy Agency (IEA), in 2009, CO2 emissions from road transport were 2
million tons and other transport sectors 0.2 million tons, of the total of 5.7 million tons. The share of
transport sector is expected to grow as mitigation in other sectors, such as building and industry, is
relatively easier.
Also lowered would be vehicle emissions of major local air pollutants thereby reducing health costs
and improving the quality of life for Georgians. In Georgia the main source of air pollution is road
transport, which emits a major and growing share of most pollutants, including carbon monoxide (CO),
hydrocarbons (volatile organic compounds and methane), nitrogen oxides (NOx), sulfur dioxide (SO2),
soot, benzopyrene and particulate matter (PM) (Figure 3). These pollutants are present in areas with
intensive trafficlarge urban areas and along main road corridorsmost acutely observed in Tbilisi,
where emissions of these pollutants incur substantial health costs. They contribute to eye irritation,
respiratory diseases, cardio-pulmonary damage and premature death.2 A comparative example is Mexico
City; a World Bank study estimated that reducing local ozone concentrations and emissions of particulate
matters by only 10 percent would save annual health costs up to US$1,607 million for Mexico City
1
WDI (2011)
2
ENVSEC (2011)
3metropolitan area.3 Although Georgia’s cities have lower levels of individual vehicle use, minibus fleets
have high emission intensity, contribute to congestion and disrupt traffic; emissions from other vehicles
are also rising.
Figure 3: Road Transport is Responsible for a Major and Growing Share of Emissions
CO Emissions by Sector NO Emissions by Sector
Industry
Energy
Road Transport
SO2 Emissions by Sector PM10 Emissions by Sector
Source: Ministry of Environment Protection (2009)
Future Prices of Petroleum Fuels and Carbon Emissions
Policies for green transportation would prepare the Georgian economy for future changes in fuel
prices and a potential international agreement on pricing carbon emissions. Either scenario is likely
for the global economy in the near future. First, continued economic growth and rising demands for
private vehicles and energy in developing countries would continue to drive oil prices higher, which
would raise the oil import bill for Georgia. Second, internationally coordinated climate change mitigation
efforts would set a high price on carbon emissions, which could curtail oil price rises. To stabilize the
GHG concentration in the atmosphere to a level that limits the global temperature increase to within 2ºC,
the U.S. Department of Energy estimates that the global carbon price, implemented as a global carbon tax,
would need to be US$50 per ton today and increased to US$700 by 2100. This lower bound of carbon
prices assumes an immediate international agreement and global compliance. Delay in implementing a
carbon pricing regime would lead to much more rapid increases of future carbon prices.4 On the other
hand, estimates from the International Energy Agency assumed that tightening private vehicle technical
standards would achieve a 30 percent reduction in fossil fuel use by transport by 2050, although stricter
private vehicle emission standards means higher capital costs for private vehicles, estimated at US$4,500
billion by 2050.5 Such costs will affect lower-income households disproportionately, including Georgian
consumers, compared to the effect on consumers in higher-income countries.
3
Cropper et al. (2002)
4
Edmonds, Clarke, Wise and Lurz (2007)
5
IEA (2009)
4In either case, Georgia and other non oil-producing countries are likely to face high costs for fossil fuel
usagepaid at the pump, through high carbon prices or through higher vehicle prices due to stricter
technical standards. Therefore, investing now in infrastructure for low-emission modes will help insulate
Georgia from the almost inevitable rise in oil and carbon prices, reduce transportation costs, and improve
national energy security.
C. What is the Rationale for Government’s Involvement in Greening Transportation?
Because of its long life, investing in transport infrastructure will shape transport modal choices and
hence potentially lock in the long-run trajectory of transportation costs. Transportation planning and
infrastructure development affects spatial development, generation of agglomeration economies, and
consumer choices and behavior; the long lifespan of infrastructure would have a persistent effect on
transport system emission intensity. Development of transport infrastructure, which lowers transportation
cost, would ultimately encourage spatial concentration of production centers. International experience
also suggests that this increases the economic weight of major cities, resulting in higher macroeconomic
productivity.6 Urban land-use policies in particular influence the choice of lower emission modes in a
multi-modal transport system. Transport infrastructure has a long lifespan, thus its modal composition has
a persistent effect on transport system emission intensity.
Figure 4: Vehicle ownership growth trajectories vary greatly by country even at same income level
Source: Argonne National Laboratory (2006)
High-income countries have ended up at very different levels of motorization rates, suggesting that
economic growth and motorization can be decoupled to a certain extent. Figure 4 shows that, for
example at GDP of US$ 7,500 per capita, car ownership of high-income countries ranged between 100
6
World Bank (2009); Ciccone and Hall (1996); Glaeser and Mare (2001)
5and 300 cars per one thousand people. East Asian countries are at the lower bound, North American
countries at the upper bound, and Western European countries in between. What sets them apart includes
transport infrastructure development, spatial development plans, and fiscal policies on fuel use and
transport (see Section II for description of instruments and impacts). This strongly implies that decisions
made now in lower middle-income countries, such as Georgia, regarding planning, infrastructure
development, and policies would establish the direction for development over the longer-term.
When Georgia reaches US$ 7,500 per capita Figure 5: Possible trajectories of motorization rate
GDP, will there be low or high vehicle growth in Georgia
7
ownership, relative to income level? Assuming Private Car ownership per 1000 persons
an average growth rate at 7.0 percent per year, 300
Georgia’s GDP per capita could be around High (>250)
250
US$7,500 in 2027. Figure 5 shows estimated
200 Medium
motor fuel consumption over the next 15 years by (≈220)
motorization scenario. Under a low motorization 150 Low(it affects the modal share between rail and road. Corrections of externalities need to be introduced as
close as possible to their source. Regulating external costs requires establishing technical standards to
implement technology substitution; local pollution should be reduced by charging for emissions of
specific pollutantsfor example, GHG emissions are addressed by fuel taxes and other fiscal measures.
The ideal instruments are often proxied by other measures, which avoids high implementation costs. For
instance, tailpipe pollutants are difficult to monitor, so charges for local emissions are usually
approximated by charges per vehicle-km, differentiated by vehicle type.
7II. Defining the Goal, Principle, Instruments and Scope
A. Goal: Reduce Total Cost of Transportation
Rising demand for transport would increase local pollution from fuels, which would increase health costs
and other environmental impacts for Georgian citizens. Rising levels of congestion would increase travel
times and safety risks.9 If fossil fuels remain the dominant source of energy for transport, Georgia will
continue to be dependent on energy imports and economic growth will be constrained by current account
deficits. Finally, rising GHG emissions would continue to concentrate in the atmosphere, contributing to
global warming.
Therefore the primary goal of the green transport policy framework is to reduce the total cost of
transportation including all direct and indirect costs, while maintaining total social welfare
benefits. Direct and indirect costs borne by private parties would be lowered through fair competition
among modes and operators. Indirect costs borne by society would be reduced by mechanisms that
internalize quantifiable external costs.
B. Principle: Influence and Improve Transport User Choices
At the heart of green transportation is consumer choice—the choices each transport user
faceswhether to move, when to move, which route to take, which mode and vehicle to use and so
forth. In the aggregate, transport user decisions determine how green transportation is, and affect
environmental sustainability and economic development. In Georgia, these choices also affect the levels
of national dependence on petroleum products, air pollution, transport costs, and labor productivity.
Therefore the policy framework for green transportation must shape consumer choices by including
factors that affect their decisions.
This paper proposes a policy framework that will
Influencing Choices
influence and improve transport user choices in ways that
support environmental sustainability and economic Making green transport
attractive to users
development. Georgia has progressed admirably toward a
market economy, thus an important policy goal would be to
minimize negative impacts on the environment and the
Improving Choices
economy from transport choices made by users, but without
Making green transport
undermining the market economy. This requires Government available to users
to intervene to correct market failures and inefficiency by
influencing choiceswithout imposing solutions.
Influencing choices: Government needs to implement demand-side measures that include incentives
for transport users to choose greener transportation, principally by strengthening the regulatory
and fiscal framework. Market inefficiencies are present in several subsectors, including urban
transportation and freight transportation; these inefficiencies reward consumer choices that benefit
individual transport users at the expense of overall society. For instance, a transport service provider that
operates old vehicles is likely to incur low capital cost due to the low value of the vehicles. However,
9
During 2000-2005, vehicle ownership increased from 80 per 1000 inhabitants to 100 per 1000 inhabitants.
(Department of the Patrol Police) Increase vehicle ownership per capita has outstripped road capacity increases.
8You can also read