A new lineage of Galapagos giant tortoises identified from museum samples - Nature
←
→
Page content transcription
If your browser does not render page correctly, please read the page content below
www.nature.com/hdy

                  ARTICLE                  OPEN

                  A new lineage of Galapagos giant tortoises identified from
                  museum samples
                                       ✉
                  Evelyn L. Jensen 1,2 , Maud C. Quinzin 3, Joshua M. Miller 4, Michael A. Russello 5, Ryan C. Garrick6, Danielle L. Edwards7,
                  Scott Glaberman , Ylenia Chiari9, Nikos Poulakakis 10,11, Washington Tapia 12,13, James P. Gibbs14 and Adalgisa Caccone 1
                                  8

                  © The Author(s) 2022

                      The Galapagos Archipelago is recognized as a natural laboratory for studying evolutionary processes. San Cristóbal was one of the
                      first islands colonized by tortoises, which radiated from there across the archipelago to inhabit 10 islands. Here, we sequenced the
                      mitochondrial control region from six historical giant tortoises from San Cristóbal (five long deceased individuals found in a cave
                      and one found alive during an expedition in 1906) and discovered that the five from the cave are from a clade that is distinct
                      among known Galapagos giant tortoises but closely related to the species from Española and Pinta Islands. The haplotype of the
                      individual collected alive in 1906 is in the same clade as the haplotype in the contemporary population. To search for traces of a
                      second lineage in the contemporary population on San Cristóbal, we closely examined the population by sequencing the
                      mitochondrial control region for 129 individuals and genotyping 70 of these for both 21 microsatellite loci and >12,000 genome-
1234567890();,:

                      wide single nucleotide polymorphisms [SNPs]. Only a single mitochondrial haplotype was found, with no evidence to suggest
                      substructure based on the nuclear markers. Given the geographic and temporal proximity of the two deeply divergent
                      mitochondrial lineages in the historical samples, they were likely sympatric, raising the possibility that the lineages coexisted.
                      Without the museum samples, this important discovery of an additional lineage of Galapagos giant tortoise would not have been
                      possible, underscoring the value of such collections and providing insights into the early evolution of this iconic radiation.

                      Heredity (2022) 128:261–270; https://doi.org/10.1038/s41437-022-00510-8

                  INTRODUCTION                                                                             history impacted phylogeographic patterns of diverse native flora
                  Remote oceanic islands and archipelagos have piqued the interest                         and fauna in some predictable ways (Parent et al. 2008; Grant and
                  of evolutionary biologists for decades as these landscapes offer                         Grant 2014; MacLeod et al. 2015; Castañeda-Rico et al. 2019),
                  ideal settings to study colonization and subsequent establishment                        including the Galapagos giant tortoises. Tortoises arrived on the
                  and diversification of species, largely owing to their isolation and                      oldest island and from there colonized the rest of the archipelago
                  discrete boundaries (Gillespie 2007). Moreover, island systems                           by a combination of active dispersal mediated by ocean currents,
                  with well-known geological histories and ages of emergence (e.g.,                        and vicariance closely matching the merging and splitting of
                  Hawaiian and Galapagos archipelagos) can also add a temporal                             islands (Poulakakis et al. 2012; Poulakakis et al. 2020).
                  axis to the study of the emergence of biological diversity (Cowie                           Fourteen species of giant tortoise have been described from the
                  and Holland 2008; Parent et al. 2008; Shaw and Gillespie 2016).                          Galapagos Archipelago, with one additional known but undescribed
                     The Galapagos Archipelago includes 13 major islands larger                            extinct species (Rhodin et al. 2017; Fig. 1). These species are
                  than 10 km2, six smaller islands, and over 200 islets and rocks,                         genetically distinct with generally one species per island, except for
                  located in the Pacific Ocean ~900 km west of the South American                           the tortoises on Isabela and Santa Cruz Islands, where multiple
                  continent and straddling the equator (Dirección del Parque                               species occur in allopatry (Caccone et al. 1999, 2002; Poulakakis et al.
                  Nacional Galápagos 2014). It is volcanic in origin, with islands                         2015). Three of the recognized species have gone extinct in the last
                  formed by orogenetic activity along the Nazca plate, such that                           century, and several others are in danger of extinction because of
                  islands to the west are younger than islands to the east (Geist                          human impacts, including historical overharvesting and habitat
                  1996; Geist et al. 2014). The complex history of the archipelago                         degradation (IUCN 2020). These activities have reduced the number
                  includes the islands drifting, merging and splitting, with some                          of tortoises on the archipelago to 10% of their historical population
                  subsiding into the ocean (Ali and Aitchison 2014). This geological                       levels before humans arrived (Tapia et al. 2021).

                  1
                   Department of Ecology and Evolutionary Biology, Yale University, New Haven, CT, USA. 2School of Natural and Environmental Sciences, Newcastle University, Newcastle Upon
                  Tyne, UK. 3MIT Media Lab, Massachusetts Institute of Technology, Cambridge, MA, USA. 4Department of Biological Sciences, MacEwan University, Edmonton, AB, Canada.
                  5
                   Department of Biology, University of British Columbia, Kelowna, BC, Canada. 6Department of Biology, University of Mississippi, Oxford, MS 38677, USA. 7Department of Life &
                  Environmental Sciences, University of California, Merced, CA, USA. 8Department of Environmental Science and Policy, George Mason University, Fairfax, VA, USA. 9Department of
                  Biology, George Mason University, Fairfax, VA, USA. 10Department of Biology, School of Sciences and Engineering, University of Crete, Irakleio, Greece. 11The Natural History
                  Museum of Crete, School of Sciences and Engineering, University of Crete, Irakleio, Greece. 12Galapagos Conservancy, 11150 Fairfax Boulevard #408, Fairfax, VA 22030, USA.
                  13
                    University of Málaga, Campus Teatinos, Apdo. 59, 29080 Maĺ aga, Spain. 14Department of Environmental and Forest Biology, College of Environmental Science and Forestry,
                  State University of New York, Syracuse, NY, USA. Associate editor: Lounès Chikhi. ✉email: evelyn.jensen@newcastle.ac.uk

                  Received: 10 November 2020 Revised: 2 February 2022 Accepted: 3 February 2022
                  Published online: 25 February 2022
E.L. Jensen et al.
262

      Fig. 1 Map of the Galapagos Archipelago, indicating the locations of each Chelonoidis species, with San Cristóbal Island enlarged in the
      inset map. Island names are in capital letters. The approximate location of the cave where the bones were found in 1906 is marked, as is the
      approximate location where CAS 8133 was collected alive and the region of Punta Pitt.

         In this study, we reconstruct the colonization and evolutionary        2008; Tapia et al. 2021). The contemporary population is found
      history of Galapagos giant tortoises (Chelonoidis spp.) from San          predominantly on the arid, northeastern part of the island.
      Cristóbal Island (formerly Chatham Island, Fig. 1), recognized as         However, tortoises formerly resided on the more humid, south-
      belonging to a single endemic species, C. chathamensis. Previous          western and central parts of the island, where historical records
      phylogenetic work has shown that the radiation of giant tortoises         suggest they were heavily harvested in the mid 1800s, leading to
      likely started from an initial colonization of San Cristóbal, the         their extirpation by 1930 (Banning 1933). It was speculated that the
      oldest emerged island of the archipelago, with founders sourced           southern tortoises represented a distinct species from the northern
      from western central South America (Caccone et al. 1999, 2002;            tortoises on the island (Pritchard 1996). Over time, a small number
      Poulakakis et al. 2012, 2020). Accordingly, understanding past and        of tortoises have recolonized the southwestern and central parts of
      present genetic differentiation of tortoises on San Cristóbal is          the island. Previous studies on a few samples from the
      crucial to understanding the history and pattern of diversification        contemporary population that were primarily collected in the
      of Galapagos giant tortoises as a whole. San Cristóbal may have           northeastern part of the island, found no mitochondrial haplotypic
      been part of a larger landmass 2–3 million years ago (MYA),               diversity based on assaying a section of the typically highly variable
      however during times with higher sea levels its two volcanoes             non-coding mitochondrial control region (Caccone et al. 2002;
      may have been separate islands, that have later re-coalesced into         Poulakakis et al. 2012). Previous studies have also not found
      one island (Geist et al. 2014; Karnauskas et al. 2017). This dynamic      evidence suggesting more than one genetically distinct taxon
      geological history likely influenced connectivity among tortoises          based on microsatellite data (Ciofi et al. 2002; Garrick et al. 2015).
      living on San Cristóbal over time. By extension, this might have             In 1906, an expedition on San Cristóbal led by the California
      impacted the colonization of the other islands.                           Academy of Sciences (CAS) collected a single living tortoise and
         Morphologically, adult Galapagos giant tortoises are character-        found the disjointed remains of approximately 17 individuals that
      ized as possessing either saddleback or domed carapace shapes.            had evidently perished after falling into a cave located near the
      This morphological diversity was recognized by early collectors           middle of the island (Fig. 1). Currently, pieces of six of these cave
      (Van Denburgh 1914; Fritts 1983; Fritts 1984; Pritchard 1996) and         specimens are accessioned at the CAS (Van Denburgh 1914). While
      more recently analyzed using geometric morphometrics (Chiari              the single individual found alive had a domed carapace, the two
      et al. 2009; Chiari 2021). The contemporary population of San             intact carapace remains found in the cave were considered
      Cristóbal tortoises, representing the entire species, C. chathamen-       saddleback, although their morphological characteristics fall within
      sis, has an intermediate carapace morphology that is highly               the variation observed for intermediate shell shapes (see Chiari
      variable among individuals (Chiari 2021).                                 2021). One of these cave specimens (CAS 8127) is the holotype of C.
         On the island today there are ~6700 giant tortoises, having            chathamensis, the endemic species from San Cristóbal.
      recovered from a bottleneck that reduced the population down to              Given the dynamic history of tortoises on San Cristóbal Island,
      500–700 individuals in the 1970s. Population recovery was achieved        and their pivotal role in underpinning the entire tortoise radiation,
      following the elimination of harvesting, removal of invasive species,     we analyzed historical samples and the contemporary population
      and a short-lived but successful captive rearing program (Cayot           in detail. The objectives of this study were to (1) test the

                                                                                                                         Heredity (2022) 128:261 – 270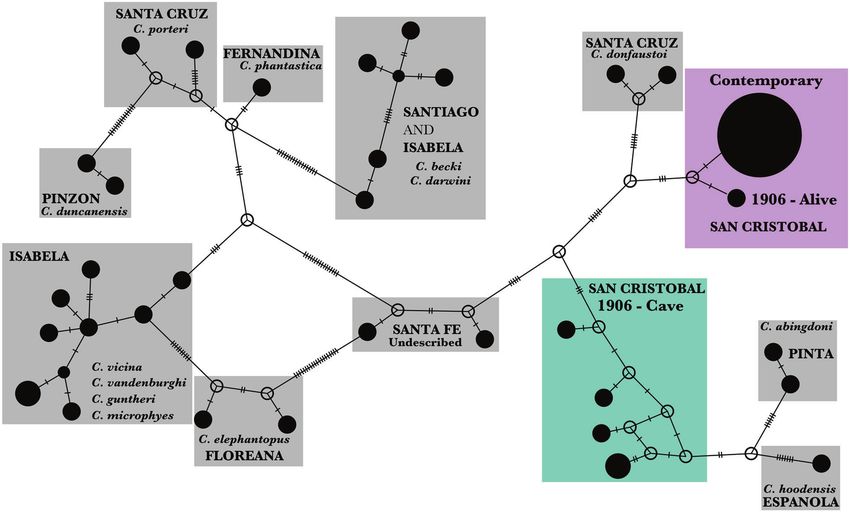
E.L. Jensen et al.
                                                                                                                                                                      263
hypothesis that more than one lineage once lived on the island,                     graphite using the method of (Vogel et al. 1984). Graphite 14C/13C ratios
and (2) describe patterns of genomic variation within the extant                    were measured using the CAIS 0.5 MeV AMS. Sample ratios were compared
population. We collected mitochondrial control region sequence                      to the ratio measured from the Oxalic Acid I standard (NBS SRM 4990).
data from six historical samples and 129 samples from the
contemporary population and compared these data to available                        Contemporary samples. Blood (0.1–1.9 mL) was collected from live
                                                                                    individuals during expeditions to San Cristóbal Island in 1999, 2012 and
sequences from all other extant and extinct Galapagos giant
                                                                                    2016. In 1999, samples were primarily collected from Punta Pitt on the
tortoise species to reconstruct their mitochondrial DNA evolu-                      northeastern point of the island (Fig. 1). In 2012, samples were collected
tionary history. We further assessed the contemporary population                    from adults at the breeding center on San Cristóbal, some of which were
for evidence of multiple lineages or admixture using two types of                   originally found in Punta Pitt, while most were of unknown origin. The
nuclear markers: a panel of 21 microsatellite loci and >12                          sampling in 2016 was conducted as part of a comprehensive census for
000 single nucleotide polymorphisms (SNPs).                                         tortoises on the entire island. In all cases, blood was stored in tubes
                                                                                    containing a lysis buffer (Longmire et al. 1997) at ambient temperature in
                                                                                    the field and at 4 °C upon arrival in the lab. Genomic DNA was extracted
METHODS                                                                             using a DNeasy Blood and Tissue Kit (Qiagen) following the manufacturer’s
Sampling and data collection                                                        protocol for blood.
Historical samples. Bone fragments were obtained from the California                   The same mitochondrial control region fragment targeted in the
                                                                                    historical samples was newly sequenced (n = 72) or obtained from
Academy of Sciences collections for six of the seven specimens collected
                                                                                    previous studies (n = 57) for 129 contemporary samples from San Cristóbal
from San Cristóbal Island in 1906: specimen CAS 8133 was collected alive,
while the other five (CAS 8127 [long bone], CAS 8128 [long bone], CAS                using previously described methods (Caccone et al. 1999).
8129 [long bone], CAS 8130 [skull], CAS 8131 [skull]) were collected from              For a subset of 60 contemporary individuals from the 129 sequenced for
the cave (Fig. 1). One additional specimen collected from the cave in 1906          the control region, double digest Restriction-site Associated DNA (ddRAD)
was not available for this study.                                                   libraries were created following Peterson et al. (2012), as described in Miller
   We used a Nikon XT H 225 ST to produce micro-computed tomography                 et al. (2018), and sequenced using two lanes of Illumina HiSeq 2000 at the
                                                                                    Yale Center for Genome Analysis. Sequences from these new libraries were
(micro-CT) scans of each bone specimen to locate the region with the
                                                                                    combined with previously collected data for an additional 10 contempor-
highest density, and thus the best conditions for DNA preservation. Not all
samples had a high-density region (e.g., CAS 8130 and 8131, the skulls), but        ary San Cristóbal individuals from Miller et al. (2018). These 70 individuals
where possible, we targeted the densest region. In a dedicated ancient              (10 sampled in 1999, 14 in 2006, and 46 in 2016) represent the geographic
DNA facility at Yale University, a Dremel rotary tool with a cutting blade          breadth of sampling locations across San Cristóbal Island. The sequences
was used to scrape off the surface of the bone, and then cut out a small            were processed and aligned to the C. abingdonii reference genome
                                                                                    (assembly ASM359739v1, Quesada et al. 2019) using the PALEOMIX bam
wedge (~300 mg) for DNA extraction. The pieces of bone were powderized
                                                                                    pipeline (version 1.2.14, Schubert et al. 2014). Briefly, we used PALEOMIX as
while submerged in liquid nitrogen using a Spex 6770 freezer mill. The
bone powder was demineralized in a solution of 0.5 M EDTA pH 8.0, 10%               a wrapper to efficiently implement read trimming using AdapterRemoval
SDS, and Proteinase K, that was incubated at 56 °C overnight in a shaking           (version 2.3.1, Lindgreen 2012), alignment using BWA mem (version 0.7.17,
incubator. The resulting lysate was then mixed with 5x volumes of buffer            Li and Durbin 2009), and indel realignment using GATK IndelRealigner
PB (Qiagen) and centrifuged through a MinElute spin column (Qiagen) to              (McKenna et al. 2010). Reads were then filtered to remove any with more
                                                                                    than 4 mismatches to the reference using BAMTOOLS (version 2.5.1,
bind the DNA. The MinElute column was washed twice using buffer PE.
                                                                                    Barnett et al. 2011). Variant detection and genotype calling were
DNA was eluted from the column using 50 ul of ultra-pure water, warmed
                                                                                    performed using BCFtools (Li et al. 2009) mpileup and call, excluding
to 56 °C. All standard precautions to prevent contamination with
contemporary DNA and between historical samples were followed.                      reads with a mapping quality score of less than 30, ignoring indels and
   We sequenced ~700 bp of the mitochondrial control region in four                 outputting only variants. The resulting VCF file was filtered using VCFtools
overlapping fragments using nested PCR and negative controls, as described          (Danecek et al. 2011) to exclude repetitive regions of the genome, sites
in Poulakakis et al. (2008) on an ABI 3730 automated sequencer (Applied             with a sequencing read depth greater than one standard deviation above
                                                                                    the mean depth (mean = 21.5, SD = 19.0), and sites with >20% missing
Biosystems). Multiple amplifications of each fragment were conducted and
                                                                                    data. Only biallelic SNP loci with a minor allele count of three were
sequenced in both directions, which along with the overlapping regions of the
fragments, gave multiple observations of each position along the sequence.          retained. Following these steps, we assessed missingness per individual,
Each position was closely inspected by eye to determine the consensus               and removed six individuals with >50% missing data. Next, we re-filtered
sequence for each individual in GENEIOUS (version 11.05; Kearse et al. 2012).       the original VCF file with only retained individuals, following the steps
   We also attempted to genotype the historical individuals at 12                   above, followed by a filter for Hardy-Weinberg Equilibrium (HWE) using the
                                                                                    correction for false discovery rate described by Benjamini and Yekutieli
microsatellite loci that have been successfully employed in previous studies
                                                                                    (2001) (adjusted p value = 0.004888) and thinned the loci to retain one
of Galapagos giant tortoise museum samples using published protocols
(Russello et al. 2007; Poulakakis et al. 2008; Russello et al. 2010), but in this   SNP per 10,000 bp in order to reduce linkage among SNP loci.
case, they did not yield reliable genotypes.                                           We genotyped these same 70 contemporary individuals from the ddRAD
   A fragment of CAS 8128 was sent to the Center for Applied Isotope                at 21 microsatellite loci, following the procedures described in Quinzin
Studies at the University of Georgia for radiocarbon dating. The sample was         et al. (2019).
mechanically cleaned using a scalpel and wire bristle brush to remove                  To summarize, in the analyses outlined below, a total of 6 historical and
                                                                                    129 contemporary mitochondrial control region sequences were used, and
surface contamination and gently reduced to smaller fragments of
                                                                                    a subset of 70 of the 129 contemporary individuals were also genotyped at
approximately 3–5 mm in size. The bone fragments were demineralized in
cold (4 °C) 1 N HCl for 24 h and rinsed with ultrapure water to neutral. The        the nuclear microsatellites and SNPs (Supplementary Table 1).
demineralized bone fragments were treated with 0.1 M NaOH at room
temperature and rinsed with ultrapure water to neutral. The samples were            Genetic analyses
rinsed with 1 N HCl to eliminate atmospheric CO2, rinsed in ultrapure water         Phylogenetic analyses—mitochondrial DNA. To investigate phylogenetic
to pH 4 (slightly acidic), and heated at 80 °C for 8 h. The resulting solution      relationships among the mitochondrial control region haplotypes found in
was filtered through glass fiber filters to isolate the total acid insoluble           the contemporary and historical individuals sampled from San Cristóbal,
fraction (“collagen”) and freeze-dried.                                             sequences were trimmed in GENEIOUS and aligned using Muscle (Edgar
   Approximately 1 mg of collagen was encapsulated in tin, and the                  2004) along with a representative subset of 28 unique haplotypes
elemental concentrations and stable isotope ratios (δ13C and δ15N) were             previously collected from all extinct and extant Galapagos giant tortoise
measured using an elemental analyzer isotope ratio mass spectrometer (EA-           species (Caccone et al. 2002; Beheregaray et al. 2003; Beheregaray et al.
IRMS). Values are expressed as δ13C with respect to PDB and δ15N with               2004; Caccone et al. 2004; Russello et al. 2005; Poulakakis et al. 2008; Chiari
respect to AIR, with an error of less than 0.1%.                                    et al. 2009; Poulakakis et al. 2012; Edwards et al. 2013). The alignment was
   For accelerator mass spectrometry (AMS) analysis, a 5-mg subsample of            verified by eye, giving a final alignment length of 668 bp, and exported as
collagen was combusted at 575 °C in evacuated and sealed Pyrex tubes in             a nexus file and opened in PopArt (http://popart.otago.ac.nz) where a
the presence of CuO to produce CO2. The CO2 samples were cryogenically              statistical parsimony network (Templeton et al. 1992; Clement et al. 2000)
purified from the other reaction products and catalytically converted to             was reconstructed.

Heredity (2022) 128:261 – 270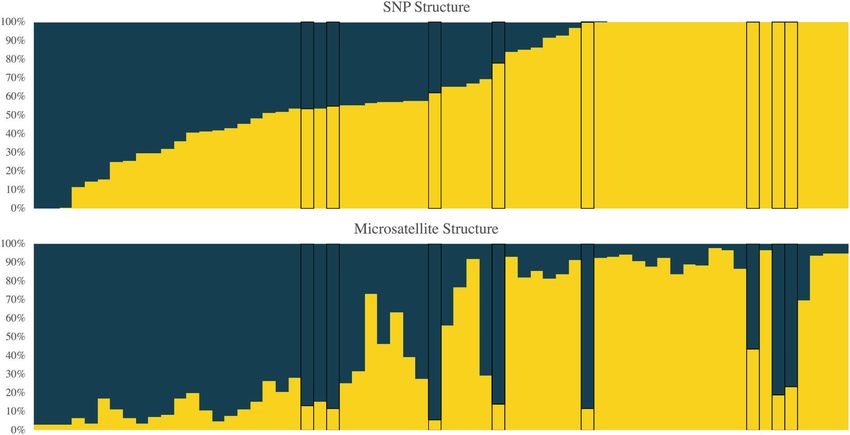
E.L. Jensen et al.
264
         To place the historical mitochondrial haplotypes within the Galapagos            et al. 2010), to evaluate evidence for substructure within the contemporary
      giant tortoise mtDNA-based phylogeny, we used a Bayesian approach                   population. STRUCTURE was run using the admixture model with
      implemented in BEAST2 (Bouckaert et al. 2019). The historical mitochondrial         correlated allele frequencies, considering values of K (the number of
      sequences from San Cristóbal tortoises were aligned with a more expansive           clusters) ranging from one to 10, with 10 iterations per K. For the
      dataset than for the network analysis, consisting of 93 haplotypes previously       microsatellite dataset, each run included 1 million MCMC replicates
      collected from all extinct and extant Galapagos giant tortoise species and the      following a burn-in of 100,000, whereas for the SNPs each run included 200
      three outgroup species from continental South America (Chelonoidis                  000 MCMC replicates after a burn-in of 100 000. To evaluate the support for
      carbonarius, C. denticulatus and C. chilensis) (Caccone et al. 2002, 2004), again   each value of K, we plotted the log probability of the data (ln Pr(X | K)), and
      using Muscle, this time with an alignment length of 718 bp due to gaps              calculated the deltaK statistic (Evanno et al. 2005) using STRUCTURE
      caused by alignment to the outgroup sequences. Genbank accession                    HARVESTER (Earl and vonHoldt 2011). DAPC was implemented using
      numbers are available in Supplementary Table 2. The BEAST input XML file             adegenet (Jombart 2008) in R (R Development Core Team 2010). The best
      was created using BEAUti v. 2.6.2. We used the BModeltest module of BEAST2          value of K was determined using the find.clusters function and based on
      to select the best nucleotide substitution model and tested the four                the K with the lowest Bayesian information criterion (BIC) score. The
      combinations of Birth-Death or Yule model for speciation and a relaxed log-         optimal number of principal components to retain was found with the
      normal or strict clock. Four chains of each analysis were run for 100 million       optim.a.score method, which was 1 for both datasets. We also used a
      Markov chain Monte Carlo (MCMC) replicates, logging the result every 1000           principal components analysis to visualize clustering of genotypes, using
      iterations, with a burn-in of 10%. We viewed the log files in TRACER v1.6            the R package Lea (Frichot and François 2015).
      (Rambaut et al. 2018) to verify that convergence had been achieved and
      effective sample size (ESS) values >200 had been obtained for each chain. The
      tree and log files were combined across the four chains using LogCombiner v.         RESULTS
      2.6.2, discarding a burn-in of 10% and maximum clade credibility trees              Phylogenetic analyses—mitochondrial DNA
      annotated with the mean node heights were generated using TreeAnnotator
      v. 2.6.2. The combined log files were again viewed in TRACER, and the                A single mitochondrial control region haplotype was shared by the
      likelihood of the four models were compared using AICM (Baele et al. 2012).         106 contemporary individuals. None of the six individuals in the
                                                                                          historical sample had this haplotype, but the domed individual
      Population genetic analyses—microsatellites and SNPs. We calculated                 sampled alive in 1906 (CAS 8133) had a haplotype that differed by
      genetic diversity metrics for the contemporary population’s nuclear marker          only three substitutions from the contemporary haplotype. The five
      datasets, including observed and expected heterozygosity and the                    specimens found in the cave, including the type specimen (CAS
      inbreeding coefficient, GIS, using GENODIVE (Meirmans and Van Tienderen              8127), had four novel haplotypes. These haplotypes formed a distinct
      2004). Effective population size (Ne) was estimated using the bias-                 cluster on the statistical parsimony network that links the haplotypes
      corrected method of linkage disequilibrium (Hill 1981; Waples 2006;                 from C. hoodensis and C. abingdonii to the main network. All of the
      Waples and Do 2010), implemented in NeESTIMATOR (Do et al. 2014),
                                                                                          cave haplotypes are distinct from the contemporary and CAS 8133
      excluding alleles with a frequency below 0.05, with confidence intervals
      determined using the jackknife approach.
                                                                                          haplotypes, being separated by 15–20 mutational steps (Fig. 2).
        We used genotypic clustering analyses, STRUCTURE (Pritchard et al.                   The Bayesian Inference phylogenetic analyses for the four
      2000) and discriminant analysis of principal components (DAPC, Jombart              parameter combinations each converged across the four chains,

      Fig. 2 Statistical parsimony haplotype network of the mitochondrial control region (668 bp) for 129 contemporary individuals from San
      Cristóbal and six historical specimens collected in 1906, as well as 28 representative haplotypes from the other species of Galapagos
      giant tortoise. The name of the island where each species occurs is labeled with capital letters, with current taxonomy in italics. Haplotypes
      are represented as black circles on the network, the size of the circle is proportional to the frequency of the haplotype in the analysis. Open
      circles represent unsampled, hypothesized haplotypes, and hash marks indicate a single mutational change. Reticulations reflect uncertainty
      in relationships, or homoplasy.

                                                                                                                                         Heredity (2022) 128:261 – 270
E.L. Jensen et al.
265
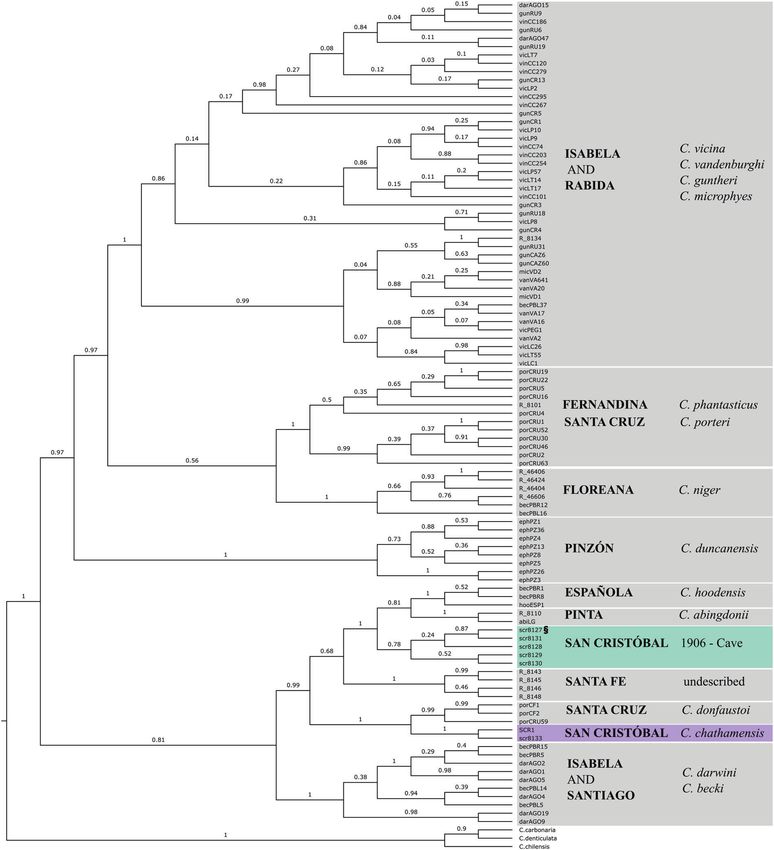
Fig. 3 Bayesian Inference maximum clade credibility cladogram showing relationships among the San Cristóbal historical samples from
the cave and collected alive in 1906, and a reference dataset of 93 Galapagos giant tortoise haplotypes and three outgroups based on
the mitochondrial control region (alignment length 718 bp), estimated using BEAST with a strict clock and Birth Death tree. The numbers
on the branches are the posterior probability support values. § indicates the C. chathamensis type specimen. The name of the island where
each clade is found is in capitals, with current taxonomy in italics.
with combined ESS values greater than 900. The model hoodensis, C. abingdonii, C. donfaustoi and the undescribed species
comparison indicated that the parameter combination of the from Santa Fe. Within this main clade, the five specimens collected
strict clock with a Birth Death tree had the lowest AICM value from the cave are in a clade sister to the one containing C.
(Supplementary Table 3), and thus the best model fit, so this is the abingdonii and C. hoodensis (Fig. 3, posterior probability =1.0). As
version we present and discuss, although the trees produced by seen in the statistical parsimony network, the individual collected
the other models can be found in as Supplementary Fig. 1 A, B and alive in 1906 (CAS 8133) belonged to the same clade as the
C. The phylogeny (Fig. 3) included 93 representatives from all contemporary San Cristóbal haplotype.
other species of Galapagos giant tortoise, the contemporary San
Cristóbal haplotype, the six historical San Cristóbal individuals, and Population genetic analyses—microsatellites and SNPs
the three outgroup taxa. The San Cristóbal haplotypes were Sequencing of the ddRAD libraries resulted in an average of 19.7
placed in the same main clade, along with the species C. million reads per individual that aligned to the reference genome
Heredity (2022) 128:261 – 270E.L. Jensen et al.
266
Table 1.Diversity measures within the contemporary population on San Cristóbal Island based on 21 microsatellite loci and 12 192 SNPs used to
genotype the same 64 individuals.
MARKER NA EFFECTIVE NA HO HE GIS Ne
SNPS 2 1.41 0.280 0.266 −0.053 (p = 0.001) 25.8 (18.2–38.0)
MICROSATELLITES 7.81 3.93 0.665 0.684 0.029 (p = 0.042) 34.2 (22.7–55.4)
GIS p-values are based on 999 permutations. In parentheses for Ne are the 95% confidence intervals based on jackknifing.
NA, mean number of alleles per locus; Effective NA, the number of alleles that would be expected at a locus based on heterozygosity; HO, observed
heterozygosity; HE, expected heterozygosity; GIS, inbreeding coefficient; Ne, effective population size.
Fig. 4 Barplots depicting K = 2 for the STRUCTURE analysis using the SNP (12 192 loci) and microsatellite (21 loci) genotypes for the
contemporary San Cristóbal population (n = 64). Each bar represents an individual and the proportion of the bar that is each color
represents the membership of that individual to the two clusters. The order of individuals is the same in both plots, black boxes around bars
highlight individuals with a greater than 0.4 discrepancy in assignment proportions between the analyses.
(range 5.6–87.9 million reads), which were combined with the 10 and K = 2, but less substantial increases for larger values of K;
individuals sequenced previously (Miller et al. 2018). The final filtered Supplementary Fig. 2A and B) for both the microsatellite and SNP
ddRAD dataset had 64 individuals retained (six individuals were datasets. Although K = 2, 4 or 8 were considered likely by the
dropped due to high levels of missing data) that were genotyped at deltaK statistic for the SNP data (Supplementary Fig. 2C), we were
12,192 loci with a mean depth of 16.5x, and 12% missing data. We unable to estimate deltaK from the microsatellite analysis due to a
omitted these six individuals from the microsatellite analyses in lack of variance in ln Pr(X | K) values between iterations. In some
order to have fully overlapping datasets of the same 64 individuals. cases, the microsatellite and SNP analyses strongly assigned the
The microsatellite dataset of 21 loci had less than 1% missing data. same individuals to alternate STRUCTURE clusters (Fig. 4), and in
There were conflicting signals of heterozygote excess and general there is a cline in membership between the two clusters.
deficit based on the type of nuclear marker assayed, with For DAPC, the BIC scores for K = 2 were just slightly lower than for
microsatellites showing a heterozygote deficit and SNPs showing K = 1, and density plots for the DAPC showed the two clusters as
heterozygote excess (Table 1). For both datasets, GIS values were partially overlapping (Supplementary Fig. 3). The PCA did not
significantly different from zero based on 999 permutations, but in reveal any distinct clustering of individuals (Supplementary Fig. 4).
opposite directions (Table 1). However, for the microsatellite When the PCA is color coded according to STRUCTURE K = 2
dataset, when calculating GIS separately for each locus, none were cluster membership, there is a gradient along PC1, however this
significantly different from zero (Supplementary Table 4). The Ne did not correspond to any identifiable geographic patterns when
value estimated from the microsatellites was higher than for the color coded by sampling region (Supplementary Fig. 4).
SNPs—34.2 versus 25.8, respectively, but the 95% jackknife
confidence intervals were broad and overlapping (Table 1). Radiocarbon dating
The clustering analyses based on microsatellite and SNP CAS 8128 yielded 28.7% collagen, with an atomic carbon to
genotypic data did not produce strong evidence for substructure nitrogen ratio of 3.4. The carbon 14 age was determined to be 410
within the contemporary San Cristóbal population. For STRUC- years old, which corresponds to a calibrated date of 1450–1630
TURE, K = 2 was suggested as most likely when examining the ln AD (95% probability) using the SHCal13 calibration curve (Hogg
Pr(X | K) values (i.e. a large increase in ln Pr(X | K) between K = 1 et al. 2013), as calculated in OxCal (Bronk Ramsey 2009).
Heredity (2022) 128:261 – 270E.L. Jensen et al.
267
DISCUSSION nuclear divergence will be critical to understanding the degree
A new mitochondrial lineage of tortoises on San Cristóbal to which the extinct and contemporary taxa are distinct. Given the
Island geographic proximity of the collection sites for the cave and live
Based on evidence from the mitochondrial control region, we specimens in 1906 (Fig. 1), and the radiocarbon date of CAS 8128
have discovered a new lineage within the Galapagos giant being between 1450 and 1630 AD, it seems likely that the lineages
tortoise radiation. All five of the skeletal remains collected in 1906 were sympatric at least in recent history. Such a situation raises
from the cave on San Cristóbal Island have haplotypes that are the possibility that the lineages come from two different gene
part of a clade that is distinct from the haplotype found in the pools that had fused, resulting in a single population with
contemporary population on the same island (Fig. 3). We mitochondrial haplotypes from both ancestral lineages, that
evaluated mitochondrial control region sequences from 129 became fixed (or very nearly fixed) for the single haplotype
contemporary individuals collected across the island (~1.5% of following the subsequent bottleneck in the 1900s. Lineage fusion
the current estimated population on the island, Tapia et al. 2021), is documented to be occurring in the Galapagos giant tortoise
but found the same single C. chathamensis haplotype previously species C. becki, where secondary contact between descendants of
identified, suggesting that the “cave” lineage has gone extinct. two separate colonizations of Volcano Wolf, both from Santiago
Herein, we refer to this as the “extinct” San Cristóbal lineage. The Island, is resulting in introgressive hybridization (Garrick et al.
sister clade to the extinct lineage is the one including the Pinta 2014). The intermediate carapace morphology of the contempor-
and Española species (C. abingdonii and C. hoodensis). Using the ary San Cristóbal population could be explained by this type of
clade ages from Poulakakis et al. (2020), this would place the scenario, as elsewhere in the Galapagos, intermediate shell
divergence between the extant and extinct lineages from San morphology is likely due to secondary contact among species
Cristóbal at around 0.72 MYA. These data (Fig. 3) clearly show that with different carapace morphology (Fritts 1984; Russello et al.
the extinct and contemporary lineages on San Cristóbal are not 2007; Poulakakis et al. 2008; Chiari 2021).
each other’s closest relatives based on their mitochondrial DNA, To evaluate evidence of possible admixture or substructure in
leaving their origin and relationship to the other Galapagos the contemporary population that might be the legacy of past
tortoise species unclear (Poulakakis et al. 2012, Poulakakis et al. lineage fusion, we examined nuclear genetic markers in the
2020). At this point we can only formulate alternative hypotheses, contemporary population. Using both 21 microsatellites and >12
some more likely than others, based on the known geology of the 000 SNPs from ddRAD sequencing, we found some support for
archipelago, the history of the group, and the data available. One K = 2. This result, if reliable, would suggest the existence of two
possibility we can clearly dismiss is that the two mitochondrial nuclear lineages on the island. However, evaluating the relative
DNA lineages derive from tortoises that colonized Galapagos support for K = 1 and K = 2 can be difficult and it is important to
from the continent at different times, as all the species in the interpret the results in light of the total evidence for genetic
Galapagos tortoise radiation are included in a single clade, subdivision (Janes et al. 2017; Cullingham et al. 2020). In this case,
separated from the continental species of Chelonoidis. A more the SNPs and microsatellites assigned some individuals with high
likely scenario, following from our reconstructed phylogeny (Fig. membership to opposite clusters (Fig. 4), suggesting that there is
3), is that when tortoises initially dispersed from San Cristóbal to not true signal to support the assignment. There is also no
colonize the islands of Santiago, Santa Cruz, and Pinzón, there identifiable biologically meaningful pattern to the K = 2 clusters
was only a single lineage on the island. This lineage may have based on geography, illustrated by the PCA color coded by
subsequently split within San Cristóbal (perhaps due to high sea sampling region (Supplementary Fig. 4), where the single cloud of
levels causing the island to be divided into two), with the points has a random scattering of each color. Taken together,
ancestors of the extinct lineage colonizing Española, while the these results do not constitute strong evidence of population
ancestors of the contemporary lineage colonized Santa Cruz, substructure that would support the continued existence of two
giving rise to C. donfaustoi. Alternatively, it could be that one of nuclear lineages on the island.
the two mitochondrial DNA lineages on San Cristóbal is derived The documented bottleneck down to an estimated 500–700
from a colonization event from nearby islands, thus representing individuals on San Cristóbal in the 1970s has evidently led to the
double colonization from two different sources, at different times fixation of the contemporary population to a single mitochondrial
(i.e., one continental, and subsequently, one intra-archipelago). control region haplotype based on our sequencing of over 125
However, we think that this is relatively unlikely, as the re- individuals. Studies that have compared the levels of nuclear
invasion would have occurred from islands to the West, such as diversity among the Galapagos giant tortoise species have found
Santa Cruz, while all studies so far support an East to West San Cristóbal to have moderate diversity (Garrick et al. 2015; Miller
colonization pattern across the archipelago rather than West to et al. 2018). Compared to our findings here, Garrick et al. (2015)
East (Beheregaray et al. 2004; Poulakakis et al. 2012, 2020). A more found higher expected heterozygosity (0.73 vs 0.68) and effective
likely scenario is that there was potentially a proto-island that population size (68, 95% CI 32–4592 vs 34, 95% CI 23–55, Table 1).
included the two modern islands of Española and San Cristóbal However, Garrick et al. (2015) results were based on 12
when the first tortoises arrived from the continent (Poulakakis microsatellites genotyped for 19 individuals sampled in 1999
et al. 2012, 2020). On this island, tortoises might have from Punta Pitt, whereas ours included 10 of those same
differentiated into two different groups. Once the islands split, individuals plus 54 tortoises sampled from a broader area. It is
there could have been a recolonization event from Española to not possible to directly compare the SNP diversity measures
San Cristóbal, leading to the coexistence of two different taxa calculated here with those from Miller et al. (2018) because that
with different mitochondrial DNA lineages, with the one derived study identified variants across all species of Galapagos giant
from the Española recolonization eventually going extinct, tortoise, thus including many loci that are not variable within the
leaving as its only trace the mitochondrial DNA sequences San Cristóbal population. The difference in GIS calculated between
retrieved from the cave bone remains. To evaluate the likelihood the SNPs and microsatellites in this study is probably due to locus
of these two possibilities we would need additional sequence AGG68, which has only two alleles (Supplementary Table 4), the
data to provide more resolution as well as historical specimens minor with a frequency of just 5%. When this locus is excluded,
from Española Island. the GIS from microsatellites does not significantly differ from zero
(data not shown), and the GIS value for the SNPs, although
Examining the contemporary population significant, is only slightly negative and close to zero.
It is unfortunate that we were unable to obtain microsatellite The estimates of Ne for the current population on San Cristóbal
genotypes from the historical specimens, because assessing are 26 and 34 for the SNPs and microsatellites, respectively.
Heredity (2022) 128:261 – 270E.L. Jensen et al.
268
Although Ne estimates based on the linkage disequilibrium DATA AVAILABILITY
method have been shown to be fraught, especially when the The microsatellite Structure file and SNP vcf file are available on Dryad (doi:10.5061/
assumptions of an ideal population are violated (Waples and dryad.xwdbrv1fp). The demultiplexed ddRAD fastq files are available on the NCBI SRA
Yokota 2007; Waples 2010), we think that the Ne estimates here as BioProject PRJNA802698. The newly generated mitochondrial control region
sequences are available from Genbank (Accession MT899437—MT899442).
are reliable because they are based on a sample size (n = 64) that
is larger than the estimated Ne for both markers, a condition
which provides some extra confidence in the estimate (England REFERENCES
et al. 2006). This is also supported by findings from previous SNP
Ali JR, Aitchison JC (2014) Exploring the combined role of eustasy and oceanic island
analyses in the Pinzón species of giant tortoise (Jensen et al. thermal subsidence in shaping biodiversity on the Galápagos. J Biogeogr
2018a). In that study it was found that Ne estimates based on 41:1227–1241
sample sizes above 60 individuals were relatively consistent. The Baele G, Lemey P, Bedford T, Rambaut A, Suchard MA, Alekseyenko AV (2012)
comparison of SNP-based Ne estimates in these two species offers Improving the accuracy of demographic and molecular clock model compar-
some additional insights into the demographic history of the San ison while accommodating phylogenetic uncertainty. Mol Biol Evolution
Cristóbal tortoises. The Ne estimate for the contemporary Pinzón 29:2157–2167
population (Ne = 59) (Jensen et al. 2018a) is larger than that for Banning GH 1933. Hancock expedition to the Galapagós Islands, 1933. Bulletin of the
San Cristóbal (Ne = 24), despite the former species having the Zoological Society of San Diego 10.
Barnett DW, Garrison EK, Quinlan AR, Stromberg MP, Marth GT (2011) BamTools: a
experienced a much more severe 20th century bottleneck to just
C++ API and toolkit for analyzing and managing BAM files. Bioinformatics
250 individuals. If we use the Ne and bottleneck census size for the 27:1691–1692
Pinzon and San Cristóbal species to calculate Ne:Nc ratios, we Beheregaray LB, Ciofi C, Caccone A, Gibbs JP, Powell JR (2003) Genetic divergence,
obtain dramatically different values (0.24 and 0.03, respectively), phylogeography and conservation units of giant tortoises from Santa Cruz and
providing additional support for San Cristóbal having experienced Pinzón, Galápagos Islands. Conserv Genet 4:31–46
an extremely pronounced bottleneck that led to the fixation of a Beheregaray LB, Gibbs JP, Havill N, Fritts TH, Powell JR, Caccone A (2004) Giant
single mitochondrial haplotype. tortoises are not so slow: rapid diversification and biogeographic consensus in
the Galápagos. Proc Natl Acad Sci USA 101:6514–6519
Benjamini Y, Yekutieli D (2001) The control of the false discovery rate in multiple
testing under dependency. Ann Stat 29:1165–1188
CONCLUSIONS AND FUTURE DIRECTIONS
Bouckaert R, Vaughan TG, Barido-Sottani J, Duchêne S, Fourment M, Gavryushkina A,
Understanding the evolutionary history of giant tortoises on San Heled J, Jones G, Kühnert D, De Maio N, Matschiner M, Mendes FK, Müller NF,
Cristóbal Island may hold further clues to reconstructing the Ogilvie HA, du Plessis L, Popinga A, Rambaut A, Rasmussen D, Siveroni I,
broader tortoise radiation across the Galapagos Archipelago. Due Suchard MA, Wu C-H, Xie D, Zhang C, Stadler T, Drummond AJ (2019) BEAST 2.5:
to the highly degraded nature of the bones found in the cave, we An advanced software platform for Bayesian evolutionary analysis. PLOS
were unable to collect genotypic data from microsatellites in this Computational Biol 15:e1006650
study, despite having used micro-CT scans to identify the region Bronk Ramsey C (2009) Bayesian analysis of radiocarbon dates. Radiocarbon
of bone that should yield the best-preserved DNA. Future efforts 51:337–360
using shotgun sequencing or capture approaches may be able to Caccone A, Gentile G, Burns CE, Sezzi E, Bergman W, Ruelle M, Saltonstall K, Powell JR
(2004) Extreme difference in rate of mitochondrial and nuclear DNA evolution
yield a full mitochondrial genome (e.g., Jensen et al. 2018b),
in a large ectotherm, Galápagos tortoises. Mol Phylogenetics Evolut 31:794–798
reduced representation of nuclear SNP loci (e.g., Gauthier et al. Caccone A, Gentile G, Gibbs JP, Frirts TH, Snell HL, Betts J, Powell JR (2002) Phylo-
2020), or a low-coverage nuclear genome (e.g., Yao et al. 2020), geography and history of giant Galápagos tortoises. Evolution 56:2052–2066
which could provide critical information on the level of divergence Caccone A, Gibbs JP, Ketmaier V, Suatoni E, Powell JR (1999) Origin and evolutionary
between the extinct lineage and other recognized taxa, and shed relationships of giant Galápagos tortoises. Proc Natl Acad Sci USA
light on the possibility of lineage fusion on San Cristóbal. Based on 96:13223–13228
the data in hand, we can confidently conclude that there was a Castañeda-Rico S, Johnson SA, Clement SA (2019) Insights into the evolutionary and
previously unrecognized mitochondrial lineage, but without demographic history of the extant endemic rodents of the Galápagos Islands.
nuclear genetic data, it is unclear whether this lineage persisted Therya 10:213–228
Cayot L (2008) The restoration of giant tortoise and land iguana populations in
as a distinct entity until it’s extinction in the 20th century.
Galápagos. Galápagos Res 65:39–43
The recognition of an additional lineage of giant tortoise on San Chiari Y (2021). Chapter 8 - Morphology. In Gibbs JP, Cayot LJ, Aguilera WT eds.
Cristóbal Island may have implications for the taxonomy of C. Galapagos giant tortoises. Academic Press, p. 139–156
chathamensis. The holotype for C. chathamensis is one of the cave Chiari Y, Hyseni C, Fritts TH, Glaberman S, Marquez C, Gibbs JP, Claude J, Caccone A
specimens (CAS 8127), which has a very distinct mitochondrial (2009) Morphometrics parallel genetics in a newly discovered and endangered
haplotype from the contemporary population, which goes by that taxon of Galápagos tortoise. PLoS One 4:e6272
name. If future evidence based on nuclear genetic markers Ciofi C, Milinkovitch MC, Gibbs JP, Caccone A, Powell JR (2002) Microsatellite analysis
confirms that the extinct lineage warrants species status, a new of genetic divergence among populations of giant Galápagos tortoises. Mol
name and type specimen would be required to represent the Ecol 11:2265–2283
Clement M, Posada D, Crandall KA (2000) TCS: a computer program to estimate gene
lineage still living on San Cristóbal today.
genealogies. Mol Ecol 9:1657–1659
This study also provides important lessons that go beyond their Cowie RH, Holland BS (2008) Molecular biogeography and diversification of the
relevance for this particular group of organisms, highlighting the endemic terrestrial fauna of the Hawaiian Islands. Philos Trans R Soc B: Biol Sci
importance of including a diachronic perspective to reconstruct 363:3363–3376
the evolutionary history of a group. We are aware that this is not Cullingham CI, Miller JM, Peery RM, Dupuis JR, Malenfant RM, Gorrell JC, Janes JK
always possible, as our inference of the evolutionary past is (2020) Confidently identifying the correct K value using the ΔK method: when
routinely inferred from contemporary samples only. This study does K = 2? Mol Ecol 29:862–869
shows what could have been missed if samples collected at two Danecek P, Auton A, Abecasis G, Albers CA, Banks E, DePristo MA, Handsaker RE,
different time points were not included. Without the ability to Lunter G, Marth GT, Sherry ST, McVean G, Durbin R, G. 1000 Genomes Project
Analysis (2011) The variant call format and VCFtools. Bioinformatics
analyze genetic data from bone samples found in the cave
27:2156–2158
together with samples from the contemporary population on the Dirección del Parque Nacional Galápagos (2014) Plan de Manejo de las Áreas Pro-
same island, the new mitochondrial lineage would remain tegidas de Galápagos para el Buen Vivir. Puerto Ayora, Galápagos, Ecuador
unknown. This in turn has opened doors to new research Do C, Waples RS, Peel D, Macbeth GM, Tillett BJ, Ovenden JR (2014) NeEstimator v2:
directions into the taxonomy, systematics, and evolutionary re-implementation of software for the estimation of contemporary effective
history of this iconic radiation. population size (Ne) from genetic data. Mol Ecol Resour 14:209–214
Heredity (2022) 128:261 – 270E.L. Jensen et al.
269
Earl DA, vonHoldt BM (2011) STRUCTURE HARVESTER: a website and program for Li H, Handsaker B, Wysoker A, Fennell T, Ruan J, Homer N, Marth G, Abecasis G, Durbin
visualizing STRUCTURE output and implementing the Evanno method. Conserv R, S. Genome Project Data Processing (2009) The Sequence Alignment/Map
Genet Resour 4:359–361 format and SAMtools. Bioinformatics 25:2078–2079
Edgar RC (2004) MUSCLE: multiple sequence alignment with high accuracy and high Lindgreen S (2012) AdapterRemoval: easy cleaning of next-generation sequencing
throughput. Nucleic Acids Res 32:1792–1797 reads. BMC Res Notes 5:337
Edwards DL, Benavides E, Garrick RC, Gibbs JP, Russello MA, Dion KB, Hyseni C, Longmire J, Maltbie M, Baker R 1997. Use of ‘lysis buffer’ in DNA isolation and its
Flanagan JP, Tapia W, Caccone A (2013) The genetic legacy of Lonesome implication for museum collections. Occasional Papers the Museum Texas Tech
George survives: giant tortoises with Pinta Island ancestry identified in Galá- University:1–3.
pagos. Biol Conserv 157:225–228 MacLeod A, Rodriguez A, Vences M, Orozco-terWengel P, Garcia C, Trillmich F, Gentile
England PR, Cornuet J-M, Berthier P, Tallmon DA, Luikart G (2006) Estimating effective G, Caccone A, Quezada G, Steinfartz S(2015) Hybridization masks speciation in
population size from linkage disequilibrium: severe bias in small samples. the evolutionary history of the Galapagos marine iguana Proc Biol Sci
Conserv Genet 7:303 282:20150425. https://doi.org/10.1098/rspb.2015.0425
Evanno G, Regnaut S, Goudet J (2005) Detecting the number of clusters of individuals McKenna A, Hanna M, Banks E, Sivachenko A, Cibulskis K, Kernytsky A, Garimella K,
using the software STRUCTURE: a simulation study. Mol Ecol 14:2611–2620 Altshuler D, Gabriel S, Daly M, DePristo MA (2010) The genome analysis toolkit:
Frichot E, François O (2015) LEA: An R package for landscape and ecological asso- a MapReduce framework for analyzing next-generation DNA sequencing data.
ciation studies. Methods Ecol Evolution 6:925–929 Genome Res 20:1297–1303
Fritts TH (1983) Morphometrics of Galápagos tortoises: evolutionary implications. In: Meirmans PG, Van Tienderen PH (2004) GENOTYPE and GENODIVE: two programs for
Bowman R, Berson M, Leviton A eds Patterns of Evolution in Galapagos the analysis of genetic diversity of asexual organisms. Mol Ecol Notes 4:792–794
Organisms. Pacific Division of the American Association for the Advancement of Miller JM, Quinzin MC, Edwards DL, Eaton DAR, Jensen EL, Russello MA, Gibbs JP,
Science, San Francisco, CA Tapia W, Rueda D, Caccone A (2018) Genome-wide assessment of diversity and
Fritts TH (1984) Evolutionary divergence of giant tortoises in Galápagos. Biol J Linn divergence among extant Galapagos giant tortoise species. J Heredity
Soc 21:165–176 109:611–619
Garrick RC, Benavides E, Russello MA, Hyseni C, Edwards DL, Gibbs JP, Tapia W, Ciofi C, Parent CE, Caccone A, Petren K (2008) Colonization and diversification of Galapagos
Caccone A (2014) Lineage fusion in Galapagos giant tortoises. Mol Ecol terrestrial fauna: a phylogenetic and biogeographical synthesis. Philos Trans R
23:5276–5290 Soc Lond B Biol Sci 363:3347–3361
Garrick RC, Kajdacsi B, Russello MA, Benavides E, Hyseni C, Gibbs JP, Tapia W, Caccone Peterson BK, Weber JN, Kay EH, Fisher HS, Hoekstra HE (2012) Double digest RADseq:
A (2015) Naturally rare versus newly rare: demographic inferences on two an inexpensive method for de novo SNP discovery and genotyping in model
timescales inform conservation of Galápagos giant tortoises. Ecol Evolution and non-model species. PLoS One 7:e37135
5:676–694 Poulakakis N, Edwards DL, Chiari Y, Garrick RC, Russello MA, Benavides E, Watkins-
Gauthier J, Pajkovic M, Neuenschwander S, Kaila L, Schmid S, Orlando L, Alvarez N Colwell GJ, Glaberman S, Tapia W, Gibbs JP, Cayot LJ, Caccone A (2015)
(2020) Museomics identifies genetic erosion in two butterfly species across the Description of a new Galápagos giant tortoise species (Chelonoidis; Testudines:
20th century in Finland. Mol Ecol Resour 20:1191–1205 Testudinidae) from Cerro Fatal on Santa Cruz Island. PLoS One 10:e0138779
Geist D (1996) On the emergence and submergence of the Galápagos Islands. Poulakakis N, Glaberman S, Russello M, Beheregaray LB, Ciofi C, Powell JR, Caccone A
Noticias de Galápagos 56:5–8 (2008) Historical DNA analysis reveals living descendants of an extinct species
Geist DJ, Snell H, Snell H, Goddard C, Kurz MD (2014) A paleogeographic model of the of Galápagos tortoise. Proc Natl Acad Sci USA 105:15464–15469
Galápagos islands and biogeographical and evolutionary implications. In: Harpp Poulakakis N, Miller JM, Jensen EL, Beheregaray LB, Russello MA, Glaberman S, Boore
KS, Mittelstaedt E, d’Ozouville N, Graham DW eds The Galápagos: a natural J, Caccone A (2020) Colonization history of Galapagos giant tortoises: insights
laboratory for the earth science. John Wiley & Sons, Inc, New Jersey, p 145–166 from mitogenomes support the progression rule. J Zool Syst Evolut Res
Gillespie RG (2007) Oceanic islands: models of diversity. In: Levin SA ed. Encyclopedia 58:1262–1275
of Biodiversity. Elsevier, Oxford, UK Poulakakis N, Russello M, Geist D, Caccone A (2012) Unravelling the peculiarities of
Grant PR, Grant BR (2014) 40 Years of Evolution: Darwin’s Finches on Daphne Major island life: vicariance, dispersal and the diversification of the extinct and extant
Island. Princeton University Press, https://doi.org/10.2307/j.ctt5hhncc giant Galápagos tortoises. Mol Ecol 21:160–173
Hill WG (1981) Estimation of effective population-size from data on linkage dis- Pritchard JK, Stephens M, Donnelly P (2000) Inference of population structure using
equilibrium. Genetical Res 38:209–216 multilocus genotype data. Genetics 155:945–959
Hogg AG, Hua Q, Blackwell PG, Niu M, Buck CE, Guilderson TP, Heaton TJ, Palmer JG, Pritchard PCH (1996) The Galápagos tortoises—nomenclatural and survival status.
Reimer PJ, Reimer RW, Turney CSM, Zimmerman SRH (2013) SHCal13 Southern Chelonian Res Monogr 1:1–85
Hemisphere Calibration, 0–50,000 Years cal BP. Radiocarbon 55:1889–1903 Quesada V, Freitas-Rodríguez S, Miller J, Pérez-Silva JG, Jiang Z-F, Tapia W, Santiago-
IUCN. 2020. The IUCN Red List of Threatened Species. Version 2020-2. https://www. Fernández O, Campos-Iglesias D, Kuderna LFK, Quinzin M, Álvarez MG, Carrero
iucnredlist.org D, Beheregaray LB, Gibbs JP, Chiari Y, Glaberman S, Ciofi C, Araujo-Voces M,
Janes JK, Miller JM, Dupuis JR, Malenfant RM, Gorrell JC, Cullingham CI, Andrew RL Mayoral P, Arango JR, Tamargo-Gómez I, Roiz-Valle D, Pascual-Torner M, Evans
(2017) The K = 2 conundrum. Mol Ecol 26:3594–3602 BR, Edwards DL, Garrick RC, Russello MA, Poulakakis N, Gaughran SJ, Rueda DO,
Jensen EL, Edwards DL, Garrick RC, Miller JM, Gibbs JP, Cayot LJ, Tapia W, Caccone A, Bretones G, Marquès-Bonet T, White KP, Caccone A, López-Otín C (2019) Giant
Russello MA (2018a) Population genomics through time provides insights into tortoise genomes provide insights into longevity and age-related disease. Nat
the consequences of decline and rapid demographic recovery through head- Ecol Evolution 3:87–95
starting in a Galapagos giant tortoise. Evolut Appl 11:1811–1821 Quinzin MC, Sandoval-Castillo J, Miller JM, Beheregaray LB, Russello MA, Hunter EA,
Jensen EL, Miller JM, Edwards DL, Garrick RC, Tapia W, Caccone A, Russello MA Gibbs JP, Tapia W, Villalva F, Caccone A (2019) Genetically informed captive
(2018b) Temporal Mitogenomics of the Galapagos Giant Tortoise from Pinzon breeding of hybrids of an extinct species of Galapagos tortoise. Conserv Biol
Reveals Potential Biases in Population Genetic Inference. J Heredity 33:1404–1414
109:631–640 R Development Core Team (2010) R: A language and environment for statistical
Jombart T (2008) adegenet: a R package for the multivariate analysis of genetic computing. R Foundation for Statistical Computing, Vienna, Austria
markers. Bioinformatics 24:1403–1405 Rambaut A, Drummond AJ, Xie D, Baele G, Suchard MA (2018) Posterior Summar-
Jombart T, Devillard S, Balloux F (2010) Discriminant analysis of principal compo- ization in Bayesian Phylogenetics Using Tracer 1.7. Syst Biol 67:901–904
nents: A new method for the analysis of genetically structured populations. Rhodin AGJ, Iverson JB, Bour R, Fritz U, Georges A, Shaffer HB, van Dijk PP. 2017.
BMC Genet 11:94 Turtles of the world: annotated checklist and atlas of taxonomy, synonymy,
Karnauskas KB, Mittelstaedt E, Murtugudde R (2017) Paleoceanography of the eastern distribution, and conservation status. Pp 1–292 in Rhodin AGJ, Iverson JB, van
equatorial Pacific over the past 4 million years and the geologic origins of Dijk PP, Saumure RA, Buhlmann KA, Pritchard PCH, Mittermeier RA, eds. Con-
modern Galápagos upwelling. Earth Planet Sci Lett 460:22–28 servation Biology of Freshwater Turtles and Tortoises: A Compilation Project of
Kearse M, Moir R, Wilson A, Stones-Havas S, Cheung M, Sturrock S, Buxton S, the IUCN/SSC Tortoise and Freshwater Turtle Specialist Group. Chelonian
Cooper A, Markowitz S, Duran C, Thierer T, Ashton B, Meintjes P, Drummond Research Monographs.
A (2012) Geneious basic: an integrated and extendable desktop software Russello MA, Beheregaray LB, Gibbs JP, Fritts T, Havill N, Powell JR, Caccone A (2007)
platform for the organization and analysis of sequence data. Bioinformatics Lonesome George is not alone among Galápagos tortoises. Curr Biol 17:
28:1647–1649 R317–318
Li H, Durbin R (2009) Fast and accurate short read alignment with Burrows-Wheeler Russello MA, Glaberman S, Gibbs JP, Marquez C, Powell JR, Caccone A (2005) A cryptic
transform. Bioinformatics 25:1754–1760 taxon of Galápagos tortoise in conservation peril. Biol Lett 1:287–290
Heredity (2022) 128:261 – 270You can also read