A Data-Driven Voter Guide for U.S. Elections: Adapting Quantitative Measures of the Preferences and Priorities of Political Elites to Help Voters ...
←
→
Page content transcription
If your browser does not render page correctly, please read the page content below
A Data-Driven Voter Guide for U.S. Elections: Adapting
   Quantitative Measures of the Preferences and Priorities of
   Political Elites to Help Voters Learn About Candidates

   Adam Bonica

   RSF: The Russell Sage Foundation Journal of the Social Sciences,
   Volume 2, Number 7, November 2016, pp. 11-32 (Article)

   Published by Russell Sage Foundation

        For additional information about this article
        https://muse.jhu.edu/article/644572

[ Access provided at 26 Oct 2022 05:39 GMT with no institutional affiliation ]
A Data-Driven Voter Guide for U.S. Elections: Adapting Quantitative Measures of the Preferences and Priorities of Political Elites to Help Voters Learn About Candidates A dam Bon ica Internet-based voter advice applications have experienced tremendous growth across Europe in recent years but have yet to be widely adopted in the United States. By comparison, the candidate-centered U.S. electoral system, which routinely requires voters to consider dozens of candidates across a dizzying array of local, state, and federal offices each time they cast a ballot, introduces challenges of scale to the systematic provi- sion of information. Only recently have methodological advances combined with the rapid growth in publicly available data on candidates and their supporters to bring a comprehensive data-driven voter guide within reach. This paper introduces a set of newly developed software tools for collecting, disambiguating, and merging large amounts of data on candidates and other political elites. It then demonstrates how statistical methods developed by political scientists to measure the preferences and expressed priorities of politicians can be adapted to help voters learn about candidates. Keywords: ideal point estimation, text-as-data, supervised machine learning, voting advice applications The onset and proliferation of web applica- tions have excelled in parliamentary democra- tions that help voters identify the party that cies, which require data on the issue positions best represents their policy preferences, com- for a small number of parties, the multi-tiered, monly known as “voter advice applications,” is candidate-centered U.S. electoral system intro- among the most exciting recent developments duces challenges of size, scale, and complexity in the practice and study of electoral politics to the systematic provision of information. (Alvarez et al. 2014; Louwerse and Rosema 2013; Reformers have long advocated for greater Rosema, Anderson, and Walgrave 2014). After disclosure and government transparency as a their emergence in the early 2000s, they quickly means to inform voters and enhance electoral spread throughout Europe and beyond and accountability. In justifying the value of disclo- have since become increasingly popular among sure in Buckley v. Valeo, the Supreme Court voters. In recent elections in Germany, the wrote that “disclosure provides the electorate Netherlands, and Switzerland, upwards of 30 with information ‘as to where political cam- to 40 percent of the electorates used these tools paign money comes from and how it is spent to vote (Ladner, Felder, and Fivaz 2010). Despite by the candidate’ in order to aid the voters in their growing popularity, voter advice applica- evaluating those who seek federal office. It al- tions have yet to make significant headway in lows voters to place each candidate in the po- the United States. While voter advice applica- litical spectrum more precisely than is often Adam Bonica is assistant professor of political science at Stanford University. He is also co-founder at Crowd- pac Inc. Direct correspondence to: Adam Bonica at bonica@stanford.edu, Stanford University, Encina Hall West, Room 307, 616 Serra St., Stanford, CA 94305-6044.

12 big data in poli t ica l econom y
possible solely on the basis of party labels and same reasons they have proven useful to po-
campaign speeches.”1 Disclosure requirements litical scientists, there could be significant
have long been a central component of cam- value in retooling these quantitative measures
paign finance regulation, churning out mil- of political preferences for a wider audience.
lions upon millions of records each election After providing an overview of the automated
cycle. Yet despite the stringent disclosure re- data collection and entity resolution tech-
quirements and reporting standards, making niques used to build and maintain the data-
data transparent and freely available is seldom base, I introduce a modeling framework devel-
sufficient on its own. More is needed to trans- oped to generate issue-specific measures of
late this raw information into a truly useful re- policy preferences incorporating established
source for voters. methods for analyzing political text, voting re-
Thus far, the use of data-intensive applica- cords, and campaign contributions.
tions in U.S. politics has primarily been in ser-
vice of parties and campaigns. This is perhaps D e m o c r at i z i n g P o li t i ca l Data
best exemplified by the Obama campaign’s The U.S. electoral system imposes consider-
success in leveraging large-scale databases to able informational costs on voters. Even for the
learn about voters and predict their behavior, most sophisticated of voters, filling out a ballot
which was widely lauded following the 2012 is a daunting task. Depending on the state, a
elections (Issenberg 2012). However, the true typical ballot might ask voters to select candi-
potential of the data revolution in U.S. politics dates in dozens of races and decide on multi-
might very well be realized by harnessing its ple ballot measures. The informational costs
power to help voters, donors, and other con- are particularly high in primary elections and
sumers of politics learn about candidates. As other contests where voters are unable to rely
political scientists are well aware, the informa- on partisan cues and other informational
tion available on political elites—through what shortcuts and find themselves unsure about
they say, how they vote, and how they network which candidate is best aligned with their pref-
and fund-raise—is much richer and of higher erences.
quality than the information available on the Information is crucial to effective political
mass public. Delivering on the promise of dis- participation. In the context of elections, an in-
closure requires (1) a means of summarizing formed vote is a matter of being confident in a
the information contained in the raw data into set of predictions about how the candidates un-
a format that is more easily interpreted but still der consideration would behave in office. The
highly informative, and (2) an intuitive plat- uncertainty experienced by voters in the polling
form for accessing data quickly and efficiently. booth can arise from many sources, but much
The first is a familiar problem to social scien- of it is a consequence of information asymme-
tists, who have spent decades developing nu- tries rather than the capriciousness of politi-
merous data reduction methods to summarize cians. Most politicians have well-defined policy
revealed preference data. Only more recently preferences but often lack either the means or
has the possibility of developing a platform to incentives to communicate them clearly to vot-
enable voters to interact with the data come ers. Politicians rarely behave unpredictably
within reach. when presented with familiar choices.
This paper introduces a new database and Even though disclosure data has been sold
modeling framework developed to power as providing a service to voters, those best po-
Crowdpac’s new political information platform sitioned to utilize it have been campaigns, lob-
(Willis 2014). I begin with a discussion of how byists, and special-interest groups. This is re-
methods developed by political scientists to flected in the market for political information.
measure the policy preferences and expressed The most sophisticated data collection and an-
priorities of politicians can be adapted to help alytics have gone into subscription fee–based
voters learn about candidates. For many of the services (such as Legistorm and Catalist) and
1. Buckley v. Valeo 96 S. Ct. 612; 46 L. Ed. 2d 659; 1976 U.S. LEXIS 16; 76-1 U.S. Tax Cas. (CCH) P9189.2.
r s f : t h e ru s s e l l s a g e f o u n d at i o n j o u r n a l o f t h e s o c i a l s c i e n c e s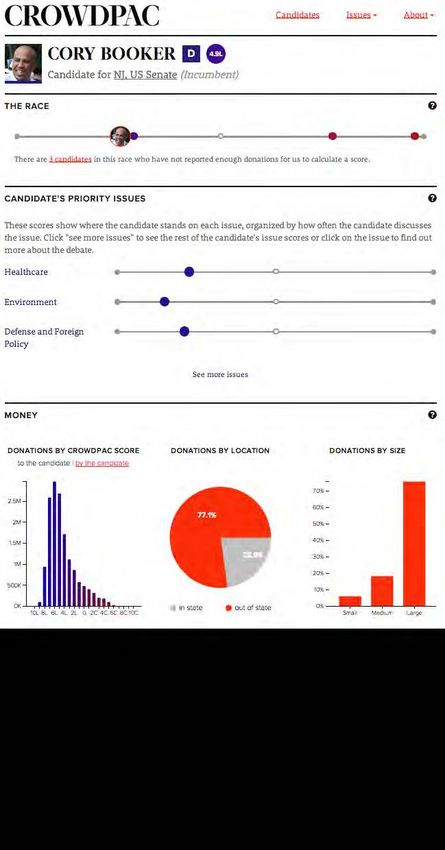
a d a t a - d r i v e n v o t e r g u i d e 13
are targeted at these groups. Insider knowledge the compiling and updating of the database,
about which politicians are power brokers, transforming the raw data into a usable format
which races are likely to be competitive, and presented its own challenges. In particular, a
where to direct contributions is a service that solution was needed for merging and disam-
lobbyists provide to high-powered clients. biguating data drawn from difference sources.
Past efforts to build a comprehensive po- This was managed with customized automated
litical information platform for voters in U.S. identity resolution and record-linkage algo-
elections have all struggled with the problem rithms supplemented by strategic use of
of conveying meaningful signals about the pol- human-assisted coding when identifying per-
icy preferences of non-incumbents and office- sonal contributions made by candidates. Each
holders beyond a select group of legislative of the three data sources is described in this
bodies. In the 1990s, Project Vote Smart ad- section.
opted an innovative strategy for dealing with
this asymmetry with respect to incumbency Political Text
status. The National Political Awareness Test Political text is any written or transcribed pub-
(NPAT) was a major effort to compile policy po- lic statement by a political actor. In its current
sitions by surveying candidates. Unfortunately, state, the database of text largely comprises
after a decline in response rates, due in part to documents originating from legislation and
active discouragement by party leaders, NPAT the Congressional Record, which contains tran-
achieved only limited success. Project Vote scripts of all proceedings, floor debates, and
Smart has since shifted strategies and begun extensions of remarks in Congress. Congres-
to code issue positions manually, based on sional bill text is taken from Congress.gov. Ad-
candidates’ public statements. This approach ditional contextual data on legislation, such as
has shown some promise but is limited by is- information on sponsorship, co-sponsorship,
sues of scalability, completeness, and coder re- and committee activity, are also collected. Im-
liability. portantly, the Congressional Research Service
There are three main challenges in creating (CRS) provides subject codes for each bill.
such a resource for the public: (1) automating These tags are used to train the topic model
the collection and maintenance of a large-scale discussed later. The Congressional Record is
database drawn from numerous sources; (2) taken from the Federal Digital System (FDsys)
devising effective ways to summarize and visu- of the U.S. Government Printing Office (GPO).
alize data on candidates; and (3) designing a Each document in the database is linked to a
user interface that is easy to understand and candidate ID and, when applicable, a bill ID.
follow for those with varying levels of political Bill authorship is attributed to the sponsor(s).
sophistication. This paper introduces a set of Speeches made during floor debates are attrib-
data-driven strategies to address these chal- uted to the speaker and, when applicable, any
lenges. bills specifically referenced during the speech.
The text database currently includes over half
Data A r c h i t ec t u r e a million documents.
This section introduces the new database that
serves as a central repository for data on can- Legislative Voting
didates and political elites. The database draws Congressional voting records are downloaded
on three main sources of data: political text, from voteview.com via the W-NOMINATE R
voting and legislative behavior, and campaign package (Poole et al. 2011). Bills and amend-
contributions. ments are assigned unique identifiers that pro-
A system of automated scrapers is used to vide a crosswalk to other tables in the data-
collect and process new data as they become base.
available. To ensure scalability, a new data
source is not included until the feasibility of Campaign Contributions
maintaining it with minimal human supervi- Contribution records are drawn from an aug-
sion has been established. Beyond automating mented version of the Database on Ideology,
r s f : t h e ru s s e l l s a g e f o u n d at i o n j o u r n a l o f t h e s o c i a l s c i e n c e s14 big data in poli t ica l econom y
Figure 1. Data Architecture of Database on Ideology, Money, and Elections (DIME)
Contribution Database Donor ID Donor Database
125 million itemized 13.4 million individuals
contribution records from and
federal and state organizational donors
reporting agencies
D
Do
no rI
rI no
Re
cipi
D Do
en
t ID
Recipient Database
Candidates and
committees
Re
Recipient ID
ID c ipi
t en
ien t ID
cip
Re
Text Database Legislative Behavior Election Database
Bill ID
500,000 documents from Database District and race-specific
Recipient ID
bills and amendments, Roll call, co-sponsorship, characteristics
floor debates, candidate and sponsorship records
websites, and social
media
Source: Author’s calculations.
Money, and Elections (DIME) (Bonica 2014).2 identifiers for candidates, donors, and bills
Since nearly every serious candidate for state serve as crosswalks between the tables. Each
or federal office engages in fund-raising (either line in the figure indicate a crosswalk between
as a recipient or a donor), campaign finance two tables.
data provide the scaffolding for constructing The recipient table plays a central role in
the recipient database. Figure 1 presents a vi- structuring the data. It can be mapped onto
sual representation of the data architecture. each of the other databases by one or more
The database consists of six tables correspond- crosswalks. It contains variables for numerous
ing to the different record types. The unique characteristics, including the office sought, bi-
2. For information on access to the database and reference documentation, see Adam Bonica, Database on
Ideology, Money in Politics, and Elections (DIME): public version 1.0 (computer file) (Stanford, Calif.: Stanford
University Libraries, 2013), http://data.stanford.edu/dime (accessed May 31, 2016).
r s f : t h e ru s s e l l s a g e f o u n d at i o n j o u r n a l o f t h e s o c i a l s c i e n c e sa d a t a - d r i v e n v o t e r g u i d e 15
ographical profiles, past campaigns and offices Ov e r a ll M e a s u r e s o f
held, fund-raising statistics (for example, to- Ca nd i dat e Id eo lo gy
tals by source or amounts raised from donors Beginning in the late 1970s, political scientists
within the district), committee assignments, began combining techniques from economet-
and various other data rendered on the site. rics and psychometrics to study the prefer-
Each row represents a candidate-cycle observa- ences of political elites (Aldrich and McKelvey
tion. The recipient table currently includes 1977; Poole and Rosenthal 1985). This pioneer-
360,173 rows extending back to 1979, covering ing work found that low-dimensional mapping
105,967 distinct candidates and 38,689 political is highly predictive of congressional roll call
committees. Additional identity resolution voting. With the exception of a few periods in
processing is applied to candidates who have American history, a single dimension explains
run for state and federal office to ensure that the lion’s share of congressional voting out-
each one is linked to a single identifier. comes (Poole and Rosenthal 1997). Ideal point
The contribution table contains records of estimation methods have since been used to
more than 125 million itemized contributions measure the preferences of political actors
to state and federal elections. Each record serving in institutions other than Congress, in-
maps onto the recipient database via the cor- cluding the courts (Epstein et al. 2007; Martin
responding recipient ID. Contribution records and Quinn 2002) and state legislatures (Shor
can also be linked to the originating candidate and McCarty 2011).
or committee for the set of recipients who have The various applications have revealed elite
donated via the contributor IDs. The donor ta- preferences to be low-dimensional across a
ble summarizes and standardizes the informa- wide range of political institutions and dem-
tion in the contribution database into a more onstrated that positions along a liberal-
usable format with a single row per donor. conservative dimension are informative sig-
The text table includes documents scraped nals about policy preferences. However, relying
from legislative text for bills and amendments, on voting records to measure preferences pre-
floor speeches, candidate web pages, and so- cludes generating ideal points for non-
cial media accounts. Every document is linked incumbent candidates and most nonlegislative
to either a candidate from the recipient table office-holders.
or a bill or amendment from the legislative ta- A particular challenge has been in compar-
ble—or both in the case of sponsored legisla- ing ideal points of actors across voting institu-
tion. tions (Bailey 2007; Shor and McCarty 2011). In
By combining these data sources, a single recent years, political scientists have devel-
database query can return a wealth of informa- oped methods to measure preferences from
tion on a candidate, including information on various other sources of data, including candi-
the candidate’s ideology, fund-raising activity, date surveys (Ansolabehere, Snyder, and Stew-
and donors, his or her personal donation his- art 2001; Burden 2004), campaign contribu-
tory, sponsored and co-sponsored legislation, tions (McCarty and Poole 1998), political text
written and spoken text, voting records, elec- (Laver, Benoit, and Garry 2003; Monroe and
toral history, personal and political biogra- Maeda 2004; Monroe, Colaresi, and Quinn
phies, and more. All of the data sources needed 2008; Slapin and Proksch 2008), co-sponsorship
to replicate the database schema are available networks (Peress 2013), voter evaluations (Hare
for download as part of DIME or as part of a et al. 2014), and Twitter follower networks (Bar-
supplemental database of legislative text and berá 2015).
votes titled DIME+.3 The model used here to generate scores for
The remaining sections explain the model- candidates overcomes this problem by scaling
ing framework applied to the database. campaign contributions using the common-
3. See note 2. The supplemental legislative database is hosted on Harvard Dataverse at http://dx.doi.org/10.7910
/DVN/BO7WOW (accessed May 31, 2016).
r s f : t h e ru s s e l l s a g e f o u n d at i o n j o u r n a l o f t h e s o c i a l s c i e n c e s16 big data in poli t ica l econom y
space DIME methodology (Bonica 2014). The are ρ = 0.97 overall, ρ = 0.92 among Democrats,
key advantages of this approach are its inclu- and ρ = 0.94 among Republicans. Third, the
siveness and scalability. The vast intercon- scores for individual donors and recipients are
nected flows of campaign dollars tie American robust to controlling for candidate character-
politics together. The resulting data make it istics related to theories of strategic giving,
possible to track a broad range of candidates, such as incumbency status and electoral com-
including non-incumbent candidates who petitiveness.
have not previously held elected office, and to An important claim made here is that the
reach much further down the ballot. The data fund-raising activities of non-incumbents are
also provide estimates of how liberal or con- predictive of how they will behave if elected to
servative individual donors are and place them office. One way to assess the non-incumbent
in a common space with other candidates and estimates is to compare scores recovered for
organizations spanning local, state, and fed- successful challenger and open-seat candi-
eral politics. dates with their future scores as incumbents.
The correlations between non-incumbent and
Campaign Finance Measures incumbent CFscores is r = 0.96 overall, r = 0.93
Ideal point estimates for donors and candi- for Republicans, and r = 0.88 for Democrats.
dates are recovered from campaign finance This is consistent across candidates for state
data using the common-space DIME method- and federal office (Bonica 2014).
ology (Bonica 2014). I refer to Bonica (2014) for In order for the model to estimate a score
a complete treatment of the methodology. for a candidate, the candidate must have re-
Here I provide a general overview of the mea- ceived contributions from at least two distinct
surement strategy and validation. donors who also gave to at least one other can-
The measurement strategy is relatively didate. This covers the vast majority of candi-
straightforward. It relies on donors’ collective dates running for state and federal offices. The
assessments of candidates as revealed by their model also assigns scores to all donors who
contribution patterns. The core assumption is contributed to at least two candidates. The do-
that donors prefer candidates who share their nor scores are estimated independently of the
policy views to those who do not. As a result, recipient scores and exclude any contributions
contributors are assumed—at least in part—to made to one’s own campaign.
distribute funds in accordance with their evalu-
ations of candidate ideology. As a result, by re- Roll Call Measures
searching and seeking out candidates who share Roll call measures are estimated for candi-
their policy preferences, donors provide infor- dates who have served in Congress using opti-
mation about the preferences of candidates. mal classification (OC) (Poole 2000). OC is a
Bonica (2014) offers three main pieces of nonparametric unfolding procedure built di-
evidence to validate the measures. First, the rectly on the geometry of spatial voting. The
DIME scores are strongly correlated with vote- scores are from the first dimension of a two-
based measures of ideology such as DW- dimensional joint scaling of the House and the
NOMINATE scores, providing strong evidence Senate based on votes cast during the 108th to
of their external validity. Second, there is a 113th Congresses. The roll call–based mea-
strong correspondence between contributor sures are nearly identical to the common-space
and recipient scores for candidates who have DW-NOMINATE scores.
both fund-raised and made donations to other
candidates, indicating that independently es- Combining Information Across Measures
timated sets of ideal points reveal similar in- Measures derived from distinct data sources
formation about an individual’s ideology. For may differ in the extent to which they condi-
the 1,638 federal candidates who ran in the tion on certain areas of politics and types of
2014 congressional elections and have scores concerns. For example, Congress rarely votes
as both donors and recipients, the correlations on socially charged issues such as abortion and
between contributor and recipient ideal points same-sex marriage. Yet such issues often fea-
r s f : t h e ru s s e l l s a g e f o u n d at i o n j o u r n a l o f t h e s o c i a l s c i e n c e sa d a t a - d r i v e n v o t e r g u i d e 17
Figure 2. Comparison of Scores for Candidate Ideology Generated from Different Data Sources
−2 −1 0 1 2 −4 −2 0 2 4
2
Recipient.CFscore
1
0
−1
−2
2
Contributor.CFscore
1
0
−1
−2
1.0
Optimal.Classification
0.5
0.0
−0.5
−1.0
4
Composite.Score
2
0
−2
−4
−2 −1 0 1 2 −1.0 −0.5 0.0 0.5 1.0
Source: Author’s calculations.
ture prominently in campaign rhetoric and are five sets of scores, I run a separate principle
a frequent subject of ballot initiatives. PACs component analysis (PCA) on each data set.
and ballot committees that focus on these is- The overall scores are calculated by averaging
sues consistently draw large numbers of do- over candidate scores from the first dimension
nors. This suggests value in combining infor- recovered in each of the runs.
mation across measures. Figure 2 provides a comparison of scores
Given the availability of multiple measures generated from different data sources and the
of candidate ideology, I average information averaged scores. Given that the sets of scores
across different sets of scores. I utilize a mul- are highly correlated, the first PCA dimension
tiple over-imputation framework designed to explains most of the variance. The averaged
handle multiple continuous variables with scores correlate with the recipient scores at ρ
measurement error and missing data (Black- = 0.98, the contributor scores at ρ = 0.96, and
well, Honaker, and King 2010). After imputing the roll call scores at ρ = 0.98.
r s f : t h e ru s s e l l s a g e f o u n d at i o n j o u r n a l o f t h e s o c i a l s c i e n c e s18 big data in poli t ica l econom y
A M o d e l to M e a s u r e Ca nd i dat e (Ramage, Manning, and Dumais 2011). The
P r i o r i t i e s a nd P o s i t i o n s Ac r o s s PLDA model is a partially supervised topic
Issues model designed for use with corpuses where
Scoring candidates along a single dimension topic labels are assigned to documents in an
provides highly informative summaries of unstructured or incomplete manner. An im-
their policy preferences. Many voters and do- portant feature of the model is that it allows
nors might also be interested in seeing how for documents that address multiple or over-
the preferences and expressed priorities of lapping issue areas to be tagged with more
candidates vary by issue. The following sec- than one topic. In addition to the specified is-
tions outline a three-stage modeling strategy sue categories, the model allows for a latent
for measuring preferences and expressed pri- category that acts as a catchall or background
orities across issue dimensions that combines category.
topic modeling, ideal point estimation, and
machine learning methods. The first stage ap- Issue Labels
plies a topic model to the database of political The model makes use of issue labels assigned
text. The second stage estimates issue-specific by the Congressional Research Service as a
ideal points for legislators based on past voting starting point in training the PLDA model. For
records using the estimated topic weights to each bill introduced, the CRS assigns one or
identify the dimensionality of roll calls. The more labels from a wide range of potential cat-
third stage trains a support-vector machine to egories. Although the CRS labels have the ad-
predict issue scores for a wider set of candi- vantage of being specific to the task at hand,
dates by conditioning on shared sources of they are neither well structured nor assigned
data. based on a systematic coding scheme. The raw
data include a total of 4,386 issue codes, and it
A Topic Model for Political Text is not uncommon for coders to tag a bill with
Topic models in their various forms have been a dozen or more labels. Many of these issue
extensively used in the study of politics (Grim- codes are overly idiosyncratic (for example,
mer 2010; Grimmer and Stewart 2013; Lauder- “dyslexia” and “grapes”), closely related or
dale and Clark 2014; Roberts et al. 2014). Po- overlapping (“oil and gas,” “oil-well drilling,”
litical text is particularly well suited to the task “natural gas,” “gasoline,” and “oil shales”), or
of categorizing documents by issue area, subcategorizations. To streamline the issue la-
whether it be bills, press releases, public bels, a secondary layer of normalization is ap-
speeches, or debates. Topic models offer a plied on top of the CRS issue codes. This is
computational approach to automating the done by mapping issue labels onto a more gen-
process of organizing large corpuses of docu- eral set of categories. CRS issue labels that
ments into a set of issue categories. This is ac- overlap two larger categories are tagged ac-
complished by breaking down each document cordingly (for example, “minority employ-
into a set of words or phrases (n-grams) that ment” ⇒ “civil rights” and “jobs and the econ-
then can be analyzed as text-as-data. The rela- omy”). CRS issue labels that are either too
tive word frequencies found in each document idiosyncratic (for example, “noise pollution”)
contain information about which documents or too ambiguous (for example, “competition”)
are most closely associated with which topics. to cleanly map onto a category are removed.
In cases where the set of topics is reasonably All other documents, including those scraped
well understood prior to the analysis, as is the from social media feeds and candidate web-
case here, supervised methods can be used. sites, are used only during the inference stage.
These methods typically rely on a sample of
human-coded documents to train a model that Constructing the Training Set
can then be used to infer topics for other doc- The training set consists of all documents that
uments. can be linked to legislation with CRS issue
The type of topic model used here is a par- tags. Since the CRS issue tags are derived from
tially labeled dirichlet allocation (PLDA) model the content of the legislation, bills are espe-
r s f : t h e ru s s e l l s a g e f o u n d at i o n j o u r n a l o f t h e s o c i a l s c i e n c e sa d a t a - d r i v e n v o t e r g u i d e 19
cially important during the training stage. Doc- Terms were organized as both unigrams and
uments that contain floor speeches made in bigrams.4 In addition to the typical list of stop-
relation to a specific bill, usually as part of the words included in the Natural Language Took
floor debate, are also included as part of the Kit (NLTK) Python package, several terms spe-
training set. Such inclusion assumes that the cific to congressional proceedings and legisla-
CRS categories assigned to a bill also apply to tion were removed from the text. Stemming
its floor debate. As such, topic loadings for a was performed using the WordNet lemmatizer,
bill can reflect both its official language and again provided by the NTLK Python package.
the floor speeches of members during debate. Rare terms found in fewer than one hundred
This is intended as a way to capture how legis- documents were filtered out. Documents that
lators (both supporters and opponents) speak did not meet the minimum threshold of ten
about a bill and better grasp the types of con- terms were excluded. The model was iterated
cerns raised during debate. For example, the five thousand times to ensure convergence.
official language of a health care bill might To give a sense of which words are associ-
mostly speak to policy related to health care, ated with which topics, table 1 reports the top
but often a single paragraph or specific provi- eight words identified by the model as being
sion amounting to a small fraction of the bill’s most closely associated with each topic.
language (for example, a provision relating to In addition to estimating topic loadings for
abortion or reproductive rights) is seized on bills, it is possible to construct measures of the
and becomes the focus of the floor debate. The expressed issue priorities of candidates by
coding scheme should take this into account combining the set of documents linked to an
by giving more weight to the types of issues individual, including sponsored legislation. As
that legislators emphasize when speaking a way to validate the expressed priorities of leg-
about the bill. islators, Justin Grimmer (2010) argues that
leaders of congressional committees should
Linking Documents to Bills and Legislators allocate more attention to the issue topics un-
Floor speeches transcribed in the Congressio- der their jurisdiction. Figure 3 replicates an
nal Record are organized into documents based analysis found in Grimmer and Stewart (2013)
on the identity of the speaker and, if applica- that compares the average attention paid to
ble, related legislation. A customized parser each topic by Senate committee leaders to the
was used to extract the speaker’s identity, filter average attention allocated by the rest of the
on the relevant body of text, and link floor Senate. Note that the analysis here differs in
speeches to bill numbers. In order for a docu- that it compares all members of House and
ment to be linked to a bill, the bill number Senate committees with jurisdiction over an
must be included somewhere in the heading issue, not just committee chairs and ranking
or the speaker must directly reference the members. The figure reveals that for every in-
name or number of the legislation in the text. cluded category, the topic model results indi-
Not all floor speeches are related to specific cate that committee members devote signifi-
legislation. Legislators are routinely given the cantly more attention to related issues.
opportunity to make commemorations or gen-
erally address an issue of their choosing. These Issue-Specific Optimal Classification
speeches often are used as position-taking ex- In this section, I introduce an issue-specific
ercises and are thus informative signals about optimal classification scaling model. The OC
the legislator’s expressed priorities. scaling model is an attractive option for this
application because of its computational effi-
PLDA Model and Results ciency, robustness to missing values, and abil-
The PLDA model was fit using the Stanford ity to jointly scale members of the House and
Topic Model Toolkit (Ramage et al. 2009). Senate in a common-space by using those who
4. A unigram is a single word in a document (for example, “taxes”), and a bigram is the combination of two
consecutive words (“cut taxes”).
r s f : t h e ru s s e l l s a g e f o u n d at i o n j o u r n a l o f t h e s o c i a l s c i e n c e sTable 1. Top Terms by Issue Category
term 1 term 2 term 3 term 4 term 5 term 6 term 7 term 8
Latent work make congress million important country nation going
Federal agencies and regulation commission sec office activity requirement director government development
Economy tax code credit revenue taxable respect qualified benefit
Health care care drug medical medicare coverage disease patient insurance
Education school education grant student educational child local eligible
Defense and foreign policy country government international foreign war world force right
Banking and finance financial loan insurance housing credit mortgage business company
Law courts and judges court action person product violation claim civil employee
Energy energy fuel oil gas vehicle renewable facility production
Procedural fiscal budget appropriation available provided authority office congress
Parks and recreation land area management forest water river project park
Environment water administrator environmental species protection system control project
Veterans’ affairs veteran defense military force armed affair operation code
Crime enforcement child crime criminal attorney justice general grant
Agriculture food agricultural agriculture farm producer crop payment assistance
Transportation transportation project safety system vehicle highway air funding
Immigration alien immigration border homeland status employer visa nationality
Intelligence and surveillance intelligence general internet person surveillance electronic foreign privacy
Higher education education student institution college higher science university loan
Civil rights election right candidate vote voting voter political civil
Emergency emergency line disaster page flood SA proposed hurricane
Indian affairs indian tribe native tribal land water agreement hawaiian
Women’s issues woman violence sexual assault domestic victim child prevention
Abortion and social conservatism right abortion religious cell woman human stem research
r s f : t h e ru s s e l l s a g e f o u n d at i o n j o u r n a l o f t h e s o c i a l s c i e n c e s
Guns firearm person gun general attorney model code ammunition
Source: Author’s calculations.
Note: Topics are listed in descending order based on their relative weights. Bigrams are excluded from the table to enhance readability.a d a t a - d r i v e n v o t e r g u i d e 21
Figure 3. Average Attention to Topics by Senate Committee Leaders Compared to Average Attention
by Other Senate Members
−0.05 0.00 0.05 0.10 0.15 0.20
Agriculture ●
Banking and Finance ●
Crime ●
Defense and Foreign Policy ●
Education ●
Energy ●
Environment ●
Health Care ●
Higher Education ●
Immigration ●
Indian Affairs ●
Intelligence and Surveillance ●
Law Courts and Judges ●
Transportation ●
Veterans’ Affairs ●
(Average Attention, Related Cmtes)−(Average Attention, Other MCs)
Source: Author’s calculations.
served in both chambers as bridge observa- ality of bill j is determined by a heuristic cut-
tions (Poole 2000). The model follows recent ting plane algorithm that searches the param-
methodological developments in multidimen- eter space for the normal vector Nj and
sional ideal point estimation (Clark and Lau- corresponding cutting line cj, which minimize
derdale 2012; Gerrish and Blei 2012; Lauderdale classification errors. The issue-specific OC
and Clark 2014). Borrowing from the issue- model instead differs by calculating the nor-
adjusted ideal point model developed by Sean mal vectors based on the parameters recovered
Gerrish and David Blei (2012), the dimension- from the PLDA model. Given a k-length vector
ality of roll calls is identified using a topic λj of topic weights for roll call j, the normal
model trained on issue tags provided by the vector is calculated as Njk = λik/∣∣λj∣∣. Legislator
CRS. The issue-specific OC model differs in its ideal points are then projected onto the projec-
approach to mapping the results from the tion line: wi = θ'i Nj . Given the mapping onto w,
topic model onto the dimensionality of roll finding the optimal cutting point cj is identical
calls. Gerrish and Blei incorporate a vector of to a one-dimensional classification problem.
issue adjustment parameters that in effect Given the estimated roll call parameters, issue-
serve as dimension-specific utility shocks. The specific ideal points can be recovered dimen-
issue-specific OC model instead utilizes the ba- sion by dimension. Holding parameters for θi-k
sic geometry of spatial voting through the pa- constant, classification errors are minimized
rameterization of the normal vectors. This ap- by finding the optimal value of θik given cj and
proach distinguishes the issue-specific OC the projected values wij = θ'i-k Nj-k + θ'ik Njk. As an
model from the approach taken by Tom Clark identification assumption, θk = 1 is fixed at its
and Benjamin Lauderdale (2012), who similarly starting value.
extend OC to generate issue-varying ideal A further extension to the OC model is the
points for U.S. Supreme Court justices by incorporation of kernel methods to capture the
kernel-weighting errors based on substantive relative importance of bills to legislators. A
similarity. The approach is actually most simi- member’s sponsorship of a bill or contribution
lar to related work by Lauderdale and Clark to the floor debate suggests that the bill has
(2014) that combines latent dirichlet allocation greater significance to her than other bills on
with an item response theory model. which she is silent. The inputs to the kernel-
In the standard OC model, the dimension- weighting function are status as a sponsor or
r s f : t h e ru s s e l l s a g e f o u n d at i o n j o u r n a l o f t h e s o c i a l s c i e n c e s22 big data in poli t ica l econom y
Table 2. Roll Call Classification, 108th to 113th Congresses
Aggregate
Proportional
Correct Reduction Weighted Weighted Weighted
Classification in Error Errors CC APRE Errors
One-dimensional OC 0.936 0.825 154569 0.938 0.818 179,598
Issue-specific OC 0.940 0.835 145430 0.943 0.832 166,126
Source: Author’s calculations.
co-sponsor and the total word count devoted slightly less than the reduction in error associ-
to the legislation. The weight matrix is con- ated with adding a second dimension to the
structed as follows: standard OC model.
The marginal increase in fit occurs largely
ωi j = 1 + γ1sponsori j + γ2cosponsori j
by design and is explained by constraints built
+ γ3 log(wordcounti j) (1)
into the issue-specific OC model. Classifying
The γ parameters are calibrated using a cross- roll call votes in multiple dimensions can be
validation scheme. Given a set of parameter highly sensitive to slight changes to the posi-
values, the model is subjected to repeated runs tion or angle of the cutting line. The cutting-
with a fraction of observed vote choices held plane search is free to precisely position the
out. After the model run has converged, the cutting line by simultaneously manipulating
total errors are calculated for a held-out sam- the normal vector and cutting line. Hard-
ple based on the recovered estimates. Values coding the dimensionality of bills based on the
are typically somewhere in the region of γ1 = 5, topic loading constrains normal vectors and
γ2 = 2, and γ3 = 1. limits the search to cj. These effects are further
Starting values are estimated separately for compounded by a modeling assumption,
each dimension using a one-dimensional OC made largely in the interest of reducing com-
scaling with issue-weighted errors. Given an is- putational costs, that constrains the values for
sue dimension k, errors on each roll call are Njk ≥ 0, corresponding to the vector of topic
weighted by the proportion of the related text loadings for each bill from which they are cal-
associated with the issue. A classification error culated. This means that bill proposals must
on a roll call where λjk = 0.5 is weighted 50 times move policy on all relevant dimensions in the
that of an error on a roll call where λjk = 0.01. same direction (that is, toward the ideological
After dropping roll calls where λjk < 0.01, the left or right). For example, the model does not
model is run to convergence. allow for a bill to move economic policy to the
Table 2 reports the classification statistics right but immigration policy to the left.5
for the issue-specific OC model. The issue- To assess the extent to which holding the
specific model increases correct classification normal vectors fixed explains the marginal re-
(CC) over the one-dimensional model, but duction in error, I ran the cutting-plane search
only marginally. Congressional voting has be- algorithm with the legislator ideal points set
come so unidimensional that only a small at values recovered from the issue-specific
fraction of voting behavior is left unexplained model. Relaxing the constraint on the normal
by a one-dimensional model. The issue- vectors resulted in an appreciable reduction in
specific model explains a nontrivial percent- error: correct classification was boosted to 96.4
age of the remaining error. However, this is percent.
5. For a two-dimensional model, this would constrain the normal vector to the upper-right quadrant. This con-
straint could be relaxed by the addition of a sign vector, which would allow values in the normal vector to take
on negative or positive values. For an in-depth discussion of this issue, see Lauderdale and Clark (2014).
r s f : t h e ru s s e l l s a g e f o u n d at i o n j o u r n a l o f t h e s o c i a l s c i e n c e sa d a t a - d r i v e n v o t e r g u i d e 23
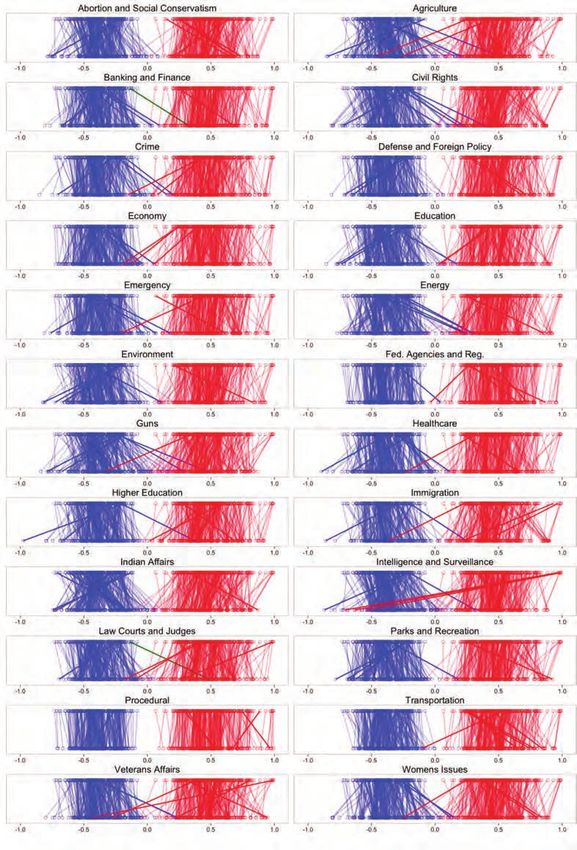
Figures 4 and 5 display a series of parallel cially revealing. Four of the most conservative
plots that compare ideal points from standard Republicans—Representatives Ron Paul (R-TX)
OC and issue-specific OC for members of the and Justin Amash (R-MI) and Senators Rand
108th and 113th Congresses. The points on the Paul (R-KY) and Mike Lee (R-UT)—voted so
top are ideal points from a standard one- consistently against their party that they
dimensional OC scaling. The points on the bot- flipped to have some of the most liberal ideal
tom are the corresponding issue-specific ideal points on the issue. This fits with the libertar-
points. The line segments trace changes in ian leanings of these candidates as well as their
ideal points between models. public and vocal opposition to government
In contrast to the near-perfect separation surveillance.
between the parties in Congress in the one- Changes in patterns of partisan overlap
dimensional OC model during the period un- from the 108th Congress to the 113th can also
der analysis, the issue-specific model does be revealing. In the 108th, the issue-specific
show increased partisan overlap for most is- ideal points for a handful of Republicans, in-
sues. The issues for which this overlap is most cluding Senators Lincoln Chafee (R-RI), George
apparent are abortion and social conservatism, Voinovich (R-OH), Mike Dewine (R-OH), and
agriculture, guns, immigration, Indian affairs, John Warner (R-VA), accurately place them well
intelligence and surveillance, and women’s is- to left of center on guns. By the 113th Congress,
sues. the only remaining Republican crossover was
Where the issue-specific model excels is in Senator Mark Kirk (R-IL), whereas the number
identifying key legislators who broke ranks on of Democrats breaking with their party over
one or more issue dimensions. For example, gun policy had grown to include Senators By-
the sole legislator to cross over on defense and ron Dorgan (D-ND), Max Baucus (D-MT), and
foreign policy was Representative Jim Leach (R- Mark Pryor (D-AR), Representatives Henry
IA), who was known for his progressive views Cuellar (D-TX) and Kurt Schrader (D-TX), and
on foreign affairs. Of the legislators to cross several others.
over on abortion and social conservatism, pro-
life advocates Senator Ben Nelson (D-NE) and Support Vector Regression
Representatives John Breaux (D-LA) and Bobby The final stage in the model integrates cam-
Bright (D-ALA) were the three most conserva- paign contributions. The objective is to pro-
tive Democrats, and pro-choice advocates Rep- duce issue-specific ideal points for the vast ma-
resentatives Sherry Boehlert (R-NY) and Rob jority of candidates who lack voting records.
Simmons (R-CT) and Senator Olympia Snowe Ideally, the model would seamlessly integrate
(R-ME) were the three most liberal Republi- voting and contribution records to estimate
cans. Although few legislators break with their issue-specific ideal points for the entire popu-
party on any given issue dimension, the ones lation of candidates simultaneously. Unfortu-
who do are often noteworthy and highly visible nately, such an approach is out of reach. I in-
players on the issue who stand out as examples stead rely on supervised machine learning
of either cross- pressured bipartisans or un- methods.
compromising hard-liners. Often the largest The structure of campaign contributions
differences are associated with legislators who has many similarities to text-as-data. The con-
are active on an issue. On immigration, for ex- tingency matrix of donors and recipients is
ample, the legislators whose issue-specific functionally similar to a document-term ma-
ideal points shifted them the most from their trix, only with shorter documents and more
overall score were Senators Chuck Hagel (R- highly informative words. As such, translating
NE) and Jeff Flake (R-AZ), both of whom had models originally designed for political text for
co-sponsored bipartisan immigration reform use with campaign contributions is relatively
bills at different points in time. straightforward. Although several classes of
The issue-specific ideal points on the intel- the models typically applied to textual analysis
ligence and surveillance dimension are espe- could be used here, I focus on support vector
r s f : t h e ru s s e l l s a g e f o u n d at i o n j o u r n a l o f t h e s o c i a l s c i e n c e s24 big data in poli t ica l econom y
Figure 4. Legislator Ideal Points from Classical OC and Issue-Specific OC (108th Congress)
Abortion and Social Conservatism Agriculture
Banking and Finance Civil Rights
Crime Defense and Foreign Policy
Economy Education
Environment Energy
Emergency Federal Agencies and Regulation
Guns Health Care
Higher Education Immigration
Indian Affairs Intelligence and Surveillance
Law Courts and Judges Parks and Recreation
Procedural Transportation
Veterans’ Affairs Women’s Issues
Source: Author’s calculations.
r s f : t h e ru s s e l l s a g e f o u n d at i o n j o u r n a l o f t h e s o c i a l s c i e n c e sa d a t a - d r i v e n v o t e r g u i d e 25
Figure 5. Legislator Ideal Points from Classical OC and Issue-Specific OC (113th Congress)
Abortion and Social Conservatism Agriculture
Banking and Finance Civil Rights
Crime Defense and Foreign Policy
Economy Education
Environment Energy
Emergency Federal Agencies and Regulation
Guns Health Care
Higher Education Immigration
Indian Affairs Intelligence and Surveillance
Law Courts and Judges Parks and Recreation
Procedural Transportation
Veterans’ Affairs Women’s Issues
Source: Author’s calculations.
r s f : t h e ru s s e l l s a g e f o u n d at i o n j o u r n a l o f t h e s o c i a l s c i e n c e s26 big data in poli t ica l econom y
regression (SVR) (Drucker et al. 1997; Smola augment feature selection. As is typical with
and Schölkopf 2004).6 support vector machines, the modeling param-
The SVR approach has several advantages. eters require careful calibration. The ε and cost
What this approach lacks in elegance is made parameters are tuned separately for each issue
up for by its extensibility and generalizability. dimension.
In theory, there is no reason why other types Table 3 reports fit statistics for fifteen issue
of data could not be included alongside the dimensions for members of the 113th Con-
contribution data as additional features. The gress. The cross-validated correlation coeffi-
model presented here combines contribution cients are above 0.95 for every issue. The
records with word frequencies from the within-party correlations are generally above
document-term matrix for use as the predictor 0.60, indicating that the model can explain
matrix. Although contribution data perform variation in the scores of co-partisans.
much better than text-as-data when modeled The SVR model demonstrates the viability
separately, including both data sources boosts of training a machine learning model to learn
cross-validated R-squared by one to two per- about candidate issue positions from contribu-
centage points for most issue dimensions over tion records and text. The SVR as presented
the contribution matrix alone. performs quite well for its intended purpose
A downside to this approach is that it takes but leaves room for improvement. In most
the roll call estimates as known quantities de- other contexts, the cross-validation results
spite the presence of measurement error. As- would be a resounding success. In this context,
sessing model fit thus becomes somewhat however, the historically high level of issue
problematic, as the extent to which cross- constraint causes the model to suffer from a
validation error actually reflects attenuation “curse of unidimensionality.” Candidate posi-
bias is unclear. Although not ideal, I proceed tions across issues are so strongly correlated
by treating the roll call estimates as though that it becomes a challenge to train a model
they are measured without error.7 that is nuanced enough to pick up on variation
The SVR model is fit using a linear kernel revealed by the issue-specific OC model, which
and recursive feature selection. To help the is often driven by a small fraction of legislators
model handle the sparsity in the contribution who deviate from their positions on one or two
matrix, I construct an n-by-k matrix that sum- given issue dimensions. Moving forward, en-
marizes the percentage of funds a candidate semble methods that build on the SVR model—
raised from donors within different ideological k-nearest neighbors methods in particular—
deciles. This is done by calculating contributor show promise for improving predictive
coordinates from the weighted average of con- performance. It also remains to be seen
tributions made to the set of candidates with whether similarly high levels of issue con-
roll call estimates for the target issue scale and straint are present in the state legislatures.
then binning the coordinates into deciles. The
candidate decile shares are then calculated as A Data- D r i v e n Vo t e r G u i d e
the proportion of total funds raised from con- In this section, I provide an overview of the
tributors located within each decile. When cal- design and development of Crowdpac’s data-
culating the contributor coordinates, contribu- driven voter guide. The initial motivation was
tions made to candidates in the test set are to build a tool capable of providing users with
excluded so as not to contaminate the cross- objective information on the policy prefer-
validation results. This simple trick helps to ences and expressed priorities of a comprehen-
6. For a complete treatment of the application of supervised machine learning methods to infer roll call ideology
from campaign contributions, see Bonica (2016).
7. An alternative approach worth exploring would be to train a binary classifier on individual vote choices on bills
and then scale the predicted vote choices for candidates using the roll call parameters recovered from OC. Al-
though this approach would sidestep issues with measurement error, it would probably present additional chal-
lenges.
r s f : t h e ru s s e l l s a g e f o u n d at i o n j o u r n a l o f t h e s o c i a l s c i e n c e sa d a t a - d r i v e n v o t e r g u i d e 27
Table 3. Fit Measures from Cross-Validation on Fifteen Issue Dimensions, 113th Congress
All Democrats Republicans
Pearson R RMSE Pearson R RMSE Pearson R RMSE
Latent 0.979 0.074 0.819 0.06 0.775 0.085
Defense and foreign policy 0.973 0.085 0.732 0.073 0.740 0.094
Banking and finance 0.973 0.081 0.700 0.076 0.751 0.085
Energy 0.971 0.084 0.711 0.074 0.722 0.092
Health care 0.970 0.091 0.760 0.078 0.741 0.100
Economy 0.968 0.089 0.687 0.081 0.721 0.095
Environment 0.966 0.094 0.680 0.089 0.732 0.095
Women’s issues 0.964 0.094 0.619 0.083 0.687 0.101
Education 0.963 0.099 0.679 0.087 0.678 0.108
Abortion and social conservatism 0.961 0.102 0.637 0.096 0.691 0.107
Higher education 0.958 0.104 0.698 0.090 0.697 0.115
Immigration 0.957 0.110 0.643 0.103 0.699 0.115
Fair elections 0.956 0.117 0.626 0.099 0.659 0.139
Intelligence and surveillance 0.952 0.108 0.705 0.088 0.543 0.126
Labor 0.952 0.122 0.603 0.123 0.663 0.123
Guns 0.951 0.116 0.680 0.089 0.560 0.137
Source: Author’s calculations.
sive set of candidates. While Crowdpac’s voter are top-level summaries that serve as jumping-
guide provides an illustrative example of such off points for exploring more detailed data on
a tool, the data and techniques employed here them. More inquiring users are given the op-
are quite flexible and could be extended to pro- tion to further explore the data by clicking
duce different types of voter guides. through to the “data details” pages provided
Figure 6 displays a screenshot that captures for each candidate. Figure 7 displays a screen-
three of the eleven primary races appearing on shot for the data details page for Cory Booker
the sample ballot from the Crowdpac voter (D-NJ) as an example. The module on the top
guide for the 2014 California primary elections. displays the candidate’s ideal point with re-
Each candidate in the contest is assigned an spect to his opponents in the upcoming elec-
overall ideological score ranging from 10L for tion. While the voter guide makes extensive
candidates on the far left to 10C for candidates use of scores along a liberal-to-conservative di-
on the far right. The scores are rescaled to en- mension, issue-specific ideal points are also
hance interpretability for users. The rescaling available for a large percentage of candidates
function is identified using the historical aver- who meet the minimum data requirement of
ages for the parties in Congress over the past raising funds from at least 100 distinct donors
two decades. First, the historical party means who have also donated to one or more other
are calculated by aggregating over the ideal candidates. The bottom modules summarize
points of the members from each party serving the candidate’s fund-raising activity by show-
in each Congress from 1992 to 2012. The scores ing the distribution of ideal points of donors
are then rescaled such that the midpoint be- to his campaign along with other general fund-
tween the party means is set to 0 and the his- raising statistics. For candidates who have
torical party means are positioned at 5L and made personal donations to other candidates
5C. The scores are windsorized at 10L and 10C. and committees, there is a toggle option that
The user interface was designed to scope with shows the ideological distribution of the re-
respect to the level of detail displayed about a cipients weighted by amount. Other modules
candidate. not shown include (1) a visualization of the
The unidimensional scores for candidates candidate’s fund-raising network accompa-
r s f : t h e ru s s e l l s a g e f o u n d at i o n j o u r n a l o f t h e s o c i a l s c i e n c e sYou can also read