7 What is Bonaire's Cruise Tourism - Worth? - Wolfs Company
←
→
Page content transcription
If your browser does not render page correctly, please read the page content below
7
 What is Bonaire’s Cruise Tourism
 Worth?

 August 2015
 Esther Wolfs, Stijn Schep, Viviana Luján Gallegos, Pieter van Beukering

IVM Wolfs Company
Institute for Environmental Studies Sabadeco West 230
VU University Amsterdam Santa Barbara
De Boelelaan 1087 Bonaire, Caribbean Netherlands
1081 HV AMSTERDAM The Netherlands
The Netherlands T +599 7883595
T +31-20-598 9555 E info@wkics.com
F +31-20-598 9553 W www.wolfscompany.com
E info.ivm@vu.nl

This report was commissioned by: Ministry for Economic Affairs, The Netherlands

Copyright © 2015, Institute for Environmental Studies.
All rights reserved. No part of this publication may be reproduced, stored in a retrieval system or
transmitted in any form or by any means, electronic, mechanical, photo-copying, recording or
otherwise without the prior written permission of the copyright holder.
Table of contents Summary 4 Acknowledgements 6 1 Introduction 7 2 The cruise tourism industry in Bonaire 8 2.1 Bonaire 8 2.2 Methodology 9 2.3 Number of visitors 9 2.4 Facts and fables in the cruise tourism industry 10 2.4.1 Do cruise tourists disembark while on Bonaire? 10 2.4.2 Do cruise tourists return? 10 2.4.3 Activities on Bonaire 12 2.4.4 Expenditures 13 2.5 Structure of the industry 14 2.5.1 Cruise companies 15 2.5.2 Government 16 2.5.3 Shipping agencies 16 2.5.4 Tour operators and suppliers 16 2.5.5 Independent tour suppliers 17 2.5.6 Taxis 17 2.5.7 Other business owners 18 3 Methodology: Economic input-‐output and environmental indicators 19 3.1 Introduction 19 3.2 Number of tourists 19 3.3 The economic value of cruise tourism 19 3.3.1 GDP and economic industries 19 3.3.2 An economic valuation of tourism 21 3.4 The environmental impact of cruise tourism 22 3.4.1 Tourist-‐related impacts 22 3.4.2 Ecological footprint of cruise ships: Acquatrail 23 3.5 The IO Model with an ecological module 24 3.5.1 Bonaire’s IO Model 24 3.5.2 The ecological module 25 3.6 External effects 26 3.6.1 Physical reef destruction 26 3.6.2 Nutrient concentration 27 3.6.3 Sedimentation 27 3.7 Ecological inputs 28 3.7.1 Land use 28 3.7.2 Coral cover use 28 3.7.3 Other environmental impacts studied in the scenario analysis 29 3.8 The use of the IO Model and environmental effects to compare cruise tourism scenarios 31 3.8.1 Multiplier effects and cruise tourism scenarios 31 3.8.2 Environmental impacts and cruise tourism scenarios 31 4 Scenario analysis 32 4.1 Scenarios 32 4.2 Effects on production and added value 33 4.3 GDP and household expenditures 34 2
4.4 Effect on jobs 35 4.5 Ecological effects 37 4.5.1 Coral cover and land-‐use 37 4.5.2 Solid waste 39 4.5.3 Water use 41 4.6 Decrease in stay-‐over tourism as a result of an increase in cruise tourism 41 4.7 Limitations 42 5 Discussion & Conclusions 44 References 46 Annex A – Ecosystem services 51 Annex B – Additional findings, tables and figures 53 Annex C – Cruise companies 55 Annex D – Cruise tourism on St Maarten 56 Annex E – Overview of touristic activities and their environmental impact 58 Annex F – Other socio-‐environmental impacts of cruise tourism 59 Annex G – The ecological footprint of cruise ships 61 Annex H – Input-‐Output Tables 67 Annex I – IO Coefficients 68 Annex J – Calibration of the ecological module using historic data 69 Annex K – Example of the multiplier effects 71 3
Summary
The ecosystems of the island of Bonaire support a range of activities that depend on
the quality of the natural environment. Tourism is one of these activities and it
represents an important source of income for the local economy. Tourism in Bonaire
can be divided in stay-over tourism and cruise tourism. Whether further development of
cruise tourism is desirable for Bonaire is constantly under discussion. It is thought that
more cruise tourists will contribute to economic growth. But, at the same time, there is
a fear that an increase in the number of cruise tourists and the investments in
infrastructure and other facilities to facilitate this growth will put extra pressure on the
ecosystems. And these are the same ecosystems that are vital in attracting not only
cruise tourists, but also stay-over tourists.
This study aims at providing quantitative and qualitative information on the potential
benefits and negative effects of an expansion of the cruise tourism industry on Bonaire.
For this purpose, a socio-economic valuation was first conducted to understand the
cruise tourism industry in Bonaire. This resulted in insights that include tourist’s
expenditures, the different actors on the island that benefit from these expenditures,
the dependency of certain sectors on tourism related revenues and the attitude of
tourists towards certain social and environmental changes in the island. This
information is derived from tourist surveys, a business survey and literature review.
Second, with the information gathered, and making use of an economic Input-Output
model for Bonaire that is linked to an ecologic model, three different cruise tourism
growth scenarios were analysed: a baseline scenario, a moderate growth scenario and
a rapid growth scenario. This analysis resulted in the calculation of economic benefits
that would result from an increase in the number of cruise tourists in each scenario. At
the same time, using the ecologic module that is linked to the economic Input-Output
model, the socio-environmental impact on a number of natural indicators was also
assessed. Certain environmental effects of cruise tourism, like waste production, water
consumption and the ecologic footprint of cruise ships, could not be included in the
ecologic module and were, therefore, assessed separately from the model.
The surveys conducted amongst tourists have shown the importance of maintaining a
healthy reef and the tranquillity on the island. Especially stay-over tourists indicated
that they are not willing to return to a more crowded island or an island with a degraded
coral reef. Both the survey and the scenario analysis indicate that sectors that benefit
the most from the growth of the cruise industry are the transport, restaurant, ‘other
services’ (which include tour operators) and trade sectors.

The scenario analysis further indicates that an increase in cruise tourism will generate a
growth in GDP within the period of the analysis (until 2024). While the economy grows
as a whole, more jobs will be generated. However, given the seasonal character of
cruise tourism and the sectors that benefit the most from it, most of the jobs created
appear to be in lower income categories. As a result of potential population growth to
fill in these new jobs, household consumption and GDP per capita do not increase as
much as the GDP growth might suggest. Household consumption at the end of the
analysis period (2024) is only $234 higher in the rapid growth scenario compared to the
baseline scenario.

The economic growth caused by cruise tourism expansion also results in socio-
environmental impacts, as higher number of visitors will increase direct pressures on
the ecosystems that are visited. The main impacts that have been analysed are change
in land use, decrease in coral cover, water consumption and waste generation and the
potential decrease of stay-over tourists as a result of coral reef degradation and more
built-up land.
 4
However, not all potential socio-environmental impacts could be included in the
scenario analysis. If cruise tourism industry is to expand even further, Bonaire must
expand its infrastructure. This means that investments need to be made to
accommodate larger amounts of tourists. The scenario analysis does not take into
account the impact of these potential infrastructure projects like additional port
infrastructure, proper waste management system, water management, more roads and
more ground transportation. It was also not possible to assess the effects on the
environment and the return rate of stay-over tourists caused by crowding in specific
areas and on peak moments.

The results of the study demonstrate that there are external effects related to the
expansion of cruise tourism. For example, a decrease in stay-over tourists as a result of
rapid growth of the cruise tourism industry may have significant implications for the
hotel industry. To make decisions regarding cruise tourism expansion, such external
effects should be taken into account. Furthermore, investing on an environmental
friendly expansion and the enforcement of environmental regulations will also be of
high importance to avoid endangering the ecosystems and, thereby, the tourism
industry as a whole. More research on the local impacts of cruise tourism and the
effects on the stay-over sector are necessary to draw conclusions on the desirability of
the expansion of cruise tourism for the island.

 5
Acknowledgements
This study would not have been possible without the enormous support of numerous
people and organisations in the period between 2012 and 2014. First of all, on Bonaire
we want to thank Ruth Schipper-Tops from the Ministry of Economic Affairs, Caribbean
Netherlands for commissioning this assignment and from the same ministry a special
thanks to Hayo Haanstra, Astrid Hilgers, Huib de Bliek, and Pieter van Baren for making
this research possible in the first place and special thanks to Paul Hoetjes, for
facilitating the study and for helping us overcome hurdles that we encountered during
the course of the study. Additionally, we would like to thank the Directorate of Spatial
Planning and Development, Unit Nature and Environment, especially Frank van Slobbe
and Peter Montanus for their valuable input, and special thanks to Boudewijn ‘Bous’
Scholts Carbo TTC Inc and Eric Witten for validating our report. Other people that
helped us were Kris Kats from Proes consultancy, Jan Jaap van Almenkerk from
KibraHacha foundation, and Jozef van Brussel from ministry of Infrastructure &
Environment the Netherlands. For the information from the tourism industry a special
thanks to all businesses that have participated in the business survey and a special
thanks to Joanny Trinidad and Marjolijn van Kooten and Lara Chirino from Tourism
Cooperation Bonaire. Furthermore a special thanks to Irene Dingjan from BONHATA,
Martien van der Valk from Bonaire Hospitality Group, and The Chamber of Commerce
& Industry Bonaire. A warm thank you for the time invested to Tante Vita and Papi
Cecilia, Bas Noij from Bonaire Explorer Association, and Bart Snelders from CURO.
And a very special thanks to Corine Gerharts and Jan Baten from Bonaire Tours &
Vacations and their team for their incredible support. A very special thanks as well to
Yvonne and Chris Schultheiss from Bonaire Destination Services and their team for
helping out to collect many cruise passengers data. Also a special thanks to all the
guides of Sue Felix Archie tours Bonaire. And a thank you to Augusto Montbrun and
Paul Coolen from Buddy Dive resort, who showed us the coral nursery.
A thank you to all the people who have supported in collecting data, especially Jan
Kloos and Rob Sint Jago from the Island Territory harbour and Hans Voerman from
Outdoor Bonaire, Elly Albers from the Mangrove Center, and Randy Leonora and
Rudsel Leito from Selibon.
Furthermore special thanks for the support by Erik Meesters, Dolfi Debrot and Diana
Slijkerman from IMARES for answering all kinds of ecological questions during our
research and delivering us data. And thanks to Rita Peachey at CIEE Research Station
for accommodating our students and supporting our meetings.
We would also like to express our gratitude towards all the interviewers who made this
study possible. Thanks to Anna Maira Vaseur, Harrold Vasseur, Timothy Vaseur, Jarelys
Cecilia, Janin Martes, Vernon Kromhout.

 6
1 Introduction
The island of Bonaire is internationally known for its unique coral reef and the easy
access to it. The reef is an important asset to the tourism industry in Bonaire, which is
considered to be the biggest economic driver on the island. In 2014 the island was
home to 18,413 residents and had a tourism industry divided in stay-over tourists and
cruise tourists. Growing from 50,000 to a maximum of 230,000 cruise tourists in 10
years’ time, this small island has seen a vast expansion of the cruise tourism industry.
Although there is no information available about how much the cruise tourism industry
contributes to the bulk of Bonaire’s economy, this increase indicates that the cruise
tourism industry is of substantial size for the island.
There are currently discussions about whether further development of cruise ship
tourism for Bonaire is desirable. On the one hand, more cruise tourists have the
potential to contribute to economic growth. On the other hand, further development of
the cruise tourism industry implies that necessary investments will have to be made in
order to create an appropriate infrastructure and sufficient facilities for the visitors. An
increase in the number of tourists and investments in infrastructure and other facilities
will put extra pressure on the ecosystems. These are the very ecosystems that play a
major role in attracting tourists to the island in the first place. In other words, increasing
the number of tourists might have positive effects for the economic development on the
island, but the question remains whether those effects are sustainable in the long run. If
excessive development causes the health of Bonaire’s ecosystem to decline, the
effects will also be visible in the tourism industry. Heavily degraded coral reefs (and
other ecosystems) are not nearly as attractive to tourists as relatively healthy ones,
hereby impacting the attractiveness of a tourist destination (Asafu-Adjaye et al., 2008).
This has an especially strong impact considering that most of the tourists visiting
Bonaire are divers and repeating visitors.
To provide quantitative and qualitative information on the potential benefits and
negative effects of an expansion of the cruise tourism industry in Bonaire, a socio-
economic valuation study is conducted to understand the cruise tourism industry in
Bonaire. Certain environmental effects of cruise tourism, like waste production and
water consumption, are also investigated. This information is derived from tourist
surveys, a business survey and literature review.
Based on the analysis of the cruise tourism industry in Bonaire, including tourist
expenditures and some socio-economic results, a scenario analysis is carried out. In
this analysis, three different scenarios are compared using an input-output model with
an ecologic module, to determine the potential economic benefits and some
environmental impacts of a further expansion of cruise tourism.
Chapter 2 describes the cruise tourism industry in Bonaire. Chapter 3 presents the
methodology of the tools that were used for the scenario analysis, namely and input-
output model with an ecologic module. The results of the scenario analysis are set out
in Chapter 4. Chapter 5 finally discussed these results and provides the main
conclusions of the study. The Annexes at the end of the report provide some additional
or in depth background and technical information of topics mentioned throughout the
report, for further reference.

 7
2 The cruise tourism industry in Bonaire

2.1 Bonaire
The Caribbean Archipelago includes the Netherlands Antilles (800 km2), which are
divided in two groups of islands: the leeward group which incorporates the islands of
Aruba, Bonaire and Curaçao, also known as the ABC islands, and the windward group
which consist of the islands of Saba, Sint Eustatius and Sint Maarten (Figure 1).

Figure 1 - Location of Bonaire in the Caribbean Sea.

Bonaire is located 46 km east from Curaçao, 80 km north from Venezuela and 129 km
east from Aruba. The surface of Bonaire is 288 km2 plus another 6 km2 for the adjacent
island of Klein Bonaire. It measures 38 km from North to South and a maximum of 11
km wide from East to West (Wolfs, 2010; CBS, 2001). The capital is Kralendijk, the
biggest city on the island. Population count varies from source to source but according
to the Centraal Bureau voor de Statistiek (CBS, 2014c), there are 18,413 people living
on the island.
The different ecosystems of Bonaire provide several ecosystem services 1 to its
residents, visiting tourists and international researchers (Lacle et al., 2012; Schep et al.,
2012a; Schep et al., 2012b). Cruise tourism also depends on the ecosystem services
provided by Bonaire’s beaches and coral reefs.

1
 For a detailed explanation of the ‘Ecosystem Services’ approach see

Annex A – Ecosystem services.

 8
2.2 Methodology
Figure 2 presents the development of tourist arrivals to Bonaire between 1999 and
2013. In order to investigate the cruise tourism industry on Bonaire, two tourist surveys
(Schep et al., 2012a)2, a field trip to investigate a mature cruise tourism industry on St.
Maarten, multiple interviews with experts and a desk research were carried out. Wolfs
Company furthermore conducted a business survey among 146 businesses in different
sectors on Bonaire (Wolfs Company, in preparation). The two tourist surveys focused
on the tourists’ perception and behaviour on Bonaire. The first survey was conducted
on a face-to-face basis with departing tourists on Bonaire at the airport for stay-over
tourists and at down town Kralendijk for cruise tourists. Tourists responded a more
extensive follow-up survey via Internet. Some additional demographics, like income
and education were also asked in this online survey. To determine the tourists’
attitudes towards the environment and acquire more information on the support of
environmental management measures, a few questions on environmental awareness
were also included. But most importantly for the calculations of consumer and
producer surpluses, the expenditures and WTP were inquired.

2.3 Number of visitors
On Bonaire the number of cruise tourist visitors has been increasing exponentially since
2005 reaching a top in 2010-2011, although the number of cruise-ships that dock has
been decreasing. The number of stay-over tourists arriving per plane has been fairly
steady over the last years, with an increase in 2012 (82,000 tourists) compared to the
number in 2010 (70,000 tourists) (CBS, 2014a).
The insular Caribbean is one of the most tourism dependent regions in the world with a
contribution of the broader travel and tourism economy estimated at 14.8% of the
region’s GDP and contributing to a possible 2.4 million jobs (ECLAC, 2005). According
to Waite et al. (2013), tourism in the Caribbean depends largely on coastal resources.
Consequently most development takes place in the coastal zone and most of the
impacts occur in the coastal zone as well.
Even though it has not been recorded how many visitors actually disembarked in
Bonaire in 2012, the TCB (2014b) estimated a total of over 150,000 passengers in the
ships arriving to Bonaire in 2012 and a little less than 150,000 in 2013. The estimate of
the amount of cruise passengers for the 2014-2015 season is around 183,000 (TCB,
2014a) which represents a decrease from the 211,000 in 2010-2011, but an increase
from the past two years. This indicates that the cruise tourism industry is of substantial
size for the island in terms of numbers of tourists. However, information on the exact
number of cruise visitors disembarking and the contribution of the cruise tourism
industry to the bulk of the Bonairean economy has not been widely studied. The cruise
season runs from October until May. Because of the hurricane season no cruise ships
visit Bonaire in the months June till September.

2
 For more information about the actual surveys and methodology of the surveys, please
refer to Schep et al. (2012a).

 9
250.000 200.000 150.000 Stay-‐over 100.000 Cruise 50.000 0 Figure 2 - Arrival of stay-over and cruise tourists per year (TCB, 2010; TCB, 2008; CBS, 2014a; CBS 2014c). 2.4 Facts and fables in the cruise tourism industry Stay-over tourism is more developed on Bonaire than cruise tourism. Bonaire has seen a steady amount of stay-over tourists arriving to the island in the last decade, while cruise tourism has expanded rapidly. The novelty has led to many speculations about the added value of cruise tourism. Both opponents and supporters of cruise tourism claim facts about the industry that this chapter aims to discuss. 2.4.1 Do cruise tourists disembark while on Bonaire? A point of debate has been the number of cruise tourists that disembark while on Bonaire. Wolfs Company conducted an exercise in the light of this study, where the number of tourists that disembarked from 14 cruise ships was counted for a period of three hours. Compared with the capacity of these ships, it was calculated that, on average, 92.9% of the tourists disembarked on Bonaire. However, the counting exercise did not extend through the whole period that the cruise ships were docked. Taking this into consideration and given that the crew of the cruise ships is not incorporated in the total amount of reported cruise tourist arrivals, it is plausible that an equivalent of 100% of the cruise ships’ passenger capacity disembarks. We have used this assumption for the calculations in the remaining part of this report, while in theory the actual percentage of people disembarking from the ships can even be higher than 100% of the passenger capacity. 2.4.2 Do cruise tourists return? It might be the case that a tropical island is much more interchangeable for a cruise tourist than for a stay-over tourist. Stay-over tourists choose specifically to go to 10
Bonaire instead of another island in the Caribbean, while cruise tourists visit many
different islands during their cruise and might not have such a strong preference for a
specific island on the itinerary. The results shown in Figure 3 support this hypothesis:
compared to stay-over tourists, cruise tourists are less certain of a return trip to
Bonaire. 85% of the stay-over tourists want to return to Bonaire, compared to roughly
80% of the cruise tourists. However, over 60% of the stay-over tourists are certain of
this, while a less than 40% of the cruise tourists are certain of their answer.

Figure 3 - Answer of tourists to question: “Will you return to Bonaire in the future?” (Schep et al.,
2012a)

Figure 3 indicates that the answers to the question on the willingness to return are very
similar to the number of repeating visitors; the number of visitors that actually have
visited Bonaire in the past. Although the percentages are somewhat lower, there is still
a large difference between stay-over and cruise tourists. While around 20% of the
cruise visitors have visited Bonaire before, around 55% of the stay-over visitors did so.
This may also indicate that cruise tourists have a less particular preference for Bonaire
as a destination. Another interesting finding is that the conversion from cruise tourism
to stay-over tourism is negligible (Figure 4). Almost none of the returning stay-over
tourists visited Bonaire as a cruise tourist and vice versa.

Figure 4 - The amount of returning visitors in the tourist exit survey (Schep et al., 2012a)

Tourists were asked whether they would return to Bonaire if certain social and
environmental characteristics of the island would change. A large fraction of the
tourists answered that they will refrain from revisiting Bonaire if 1) crowdedness
increases with 50%, and 2) if the quality of the reefs significantly deteriorates. The
results of this question are shown in Figure 5. These results indicate the importance for
 11
tourists of a well-preserved reef. However, the quality of the reefs appears to be
significantly more important for the stay-over tourists than for the cruise tourists. Only
10% of the stay-over tourists seem to be willing to return if the quality of the reef
deteriorates, while more than 30% of the cruise tourist would be willing to return in
these circumstances. The results also show the dangers of over-developing the tourism
industry. If the cruise tourism industry is to expand further, it could have serious
repercussions for the number of returning tourists, given that the stay-over tourists
appear to be more sensitive to crowdedness than the cruise tourists.

Figure 5 - Answer of tourists. Left: Would you return to a more crowded Bonaire (50% more buildings
 and people)? Right: Would you return to a Bonaire with coral reefs in a significantly worse
 state? (Schep et al., 2012a)

2.4.3 Activities on Bonaire
Figure 6 depicts the participation of tourists in certain marine based activities. It
appears that cruise tourists value the beach, swimming, snorkelling and boat tours as
the most appreciated activities to do in, on and around the water and the Bonaire
National Marine Park. A large part of the cruise tourists thus participate and enjoy the
water based activities Bonaire has to offer: almost 55% of all cruise tourists indicated
that they have been out to snorkel. These results also indicate that a healthy
environment is an important factor in determining the importance of Bonaire as a port
of call.

Figure 6 - The participation rate of tourists in specific water-based activities (Schep et al., 2012a)

 12
When looking at the cruise tourists and their participation in terrestrial activities (Figure
7), shopping, touring and Klein Bonaire come out on top. Klein Bonaire, a small island
just off the coast, and most of the other tour activities that depend heavily on the
natural environment of Bonaire are the most important. Again, this indicates that the
natural aspects of Bonaire are very important to distinguish itself as a port of call from
other ports. Shopping, however, also seems very important for most of the cruise
tourists, which could indicate that retailers on the island depend on the amount of
cruise tourists visiting Bonaire.

Figure 7 - The participation rate in land-based activities (Schep et al., 2012a)

2.4.4 Expenditures
Table 1 shows the average expenditures of cruise tourists in different categories. Again,
the importance of shopping becomes clear. Many tourists state to engage in shopping
and the average expenditures are relatively high compared to the overall expenditures,
with an average expenditure of $42 per shopping tourist. Although the expenditure by
cruise tourists on shopping is not the highest of the categories in Table 1, it is the
activity in which the most cruise tourists participate. Less people appear to spend
money on tours, but the expenditures on tours, snorkelling and boats, are much higher
than they are for shopping, which makes these sectors very relevant as well.
Table 1 Average expenditures per person per day for tourists that spent money on each of the
expenditure categories. The percentages reflect the part of the tourists that spent money on a
particular category. For a more detailed data set, see Schep et al., (2012a).

 Activities Mean expenditures % of cruise tourists
 Local transport $19 9%
 Tours $68 42%
 Diving $61 4%
 Snorkeling $58 30%
 Boats $82 10%
 Food & drinks $19 46%
 Shopping $42 68%
 Casino $3 1%
 Donation $4 4%
 Other $23 3%

 13
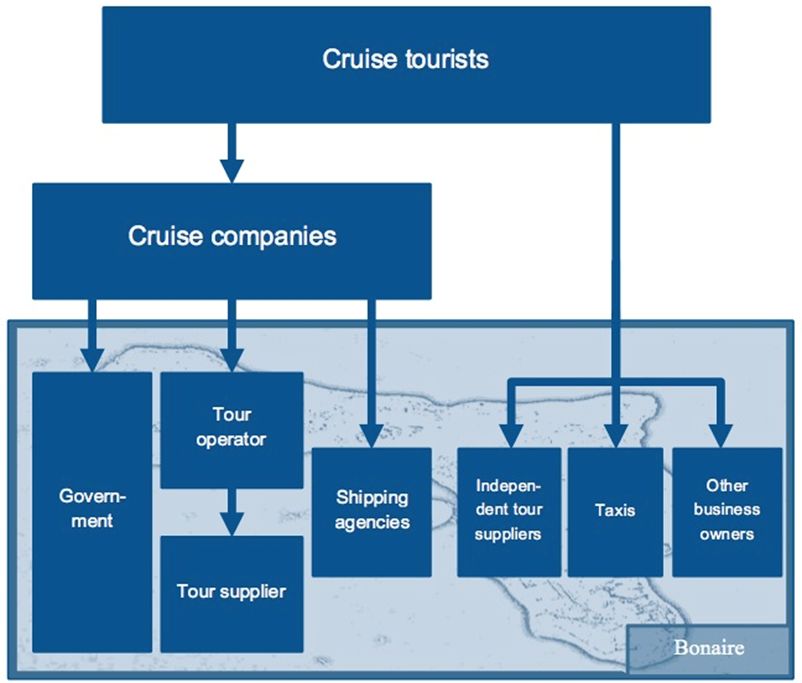
2.5 Structure of the industry
The Bonairean cruise tourism industry is defined as that part of the local economy that
depends on the revenues earned from cruise tourism. To perform an analysis of the
economic benefits and environmental impacts of cruise tourism it is important to
determine the size of the revenues and to identify the parties that depend on these. The
aim of this section is to provide an overview of the industry, the involved parties and
financial flows in the industry. Figure 8 provides this overview schematically, which will
be further explained in the rest of this section. The financial flows can be broadly
divided in two main categories:
1) Tourist expenditures that flow through the cruise-line companies before they reach
Bonairean parties. These parties are the government, shipping agencies and tour
operators.
2) Expenditures that are done directly by tourists while on the island. Independent tour
suppliers, taxis, retailers and cafeteria are mainly dependent on the latter type of
expenditures.

Figure 8 - A schematic overview of the cruise tourism industry on Bonaire (in the period 2012-2014).
The boxes represent different actors in the industry, while the arrows represent the financial flows.

 14
2.5.1 Cruise companies
Table 2 shows the ships that visited Bonaire in the season 2012-2013 and their
capacity (TCB, n.d.). For more information on the cruise companies, see Annex C –
Cruise companies.
 3
Table 2 Cruise ships that visited Bonaire in the 2012-2013 season.

 Vessel Total
 Cruise line Capacity # Visits
 visitors
 Aida Luna AIDA Cruises 2,194 8 17,552
 Alexander von Humboldt -- 510 1 510
 Amadea -- 600 1 600
 Club Med 2 Club Med Cruises 372 1 372
 Delphin Kreuzfahrten 470 1 470
 Eclipse Celebrity/RCCL 2,582 6 15,492
 Emerald Princess Princess Cruises 3,100 6 18,600
 Freewinds Majestic CL 150 63 9,450
 Grandeur of the Seas Celebrity/ RCCL 2,446 20 48,920
 Island Sky Noble Caledonia 114 2 228
 Kristina Katarina Katarina Cruises 450 2 900
 Maasdam HAL 1,258 3 3,774
 Noordam HAL 1,920 5 9,600
 Prinses Daphne World Cruises 500 1 500
 Prinsendam HAL 835 1 835
 Queen Elizabeth Cunard 2,175 1 2,175
 Rotterdam HAL 1,920 1 1,920
 Seaborn Quest HAL 450 2 900
 Silver Whisper Silver Cruises 382 2 764
 Statendam HAL 1,258 1 1,258
 The World -- 200 2 400
 Vision of the Seas Celebrity/RCCL 2,345 5 11,725
 Westerdam HAL 1,918 1 1,918

 Total season 2012-2013 136 148,863

As can be seen in table 3, the companies face several expenses on Bonaire: payments
to the government, the tour operators and port services. As Bonaire is part of the
itinerary of a cruise in which multiple islands are visited, it is difficult to determine the
profits for cruise companies with regard to the cruise industry on Bonaire specifically.
However, since none of the cruise companies have operations on Bonaire, it is more
important for this research to determine the income streams from the cruise companies
to the dependent parties on Bonaire.
Table 3 Overview of the required port services

 Port services
 • Harbour dues • Extra launch
 • Wharfage • Extra line boat
 • Pilotage (in+out) • Line handling
 • Pilot launch (in+out) • Agency fee

3
 The total number of cruise tourists on this table does not correspond to the number of
cruise tourists used in this report for the year 2012, because the table shows the estimated
cruise tourist arrivals on a season basis (i.e. two broken years: from November 2012 to April
2013).

 15
2.5.2 Government
Governmental income is the first financial flow that we identify entering Bonaire through
the cruise line companies. The cruise companies pay a head tax to the Bonairean
government of $2 per tourist measured by the capacity of the vessel. For the crew, no
taxes are paid.

2.5.3 Shipping agencies
The second cost for the cruise companies are expenses for port services that are
provided by two shipping agencies. Mooring the ship at a Bonairean pier requires more
than simply throwing the lines out. The services that are necessary are displayed in
Table 3. These are provided by two companies that operate on Bonaire: BAS shipping
and Maduro & sons. For some services the port of Bonaire receives a share through the
shipping agencies. Total costs range between $3,500 to $5,500 per vessel for different
sizes and companies.

2.5.4 Tour operators and suppliers
A large share of tourists explores Bonaire by booking an organised tour with a tour
operator before they arrive. Bonaire Destination Services (BDS) and Bonaire Tours and
Vacations (BT&V) are the islands operators that offer an assortment of tours. The tours
are sold to the cruise companies, which sell them to the tourists. Tour operators charge
between $20 and $40 for their tours. BDS and BT&V (personal communications, June
2012) estimate that the prices paid by tourists on-board of the cruise ships are roughly
180% to 200% of the prices the tour agencies charge to the cruise companies. BT&V
sold around 24,000 tours in the 2011-2012 season but estimated a decline in 2012-
2013 because of the expected decline in cruise tourists.
The tour operators then buy the tours from tour suppliers that run their own enterprise,
but are connected to the tour agencies (so called sub-contractors). Table 4 presents
the list of tour suppliers that are connected to BT&V. The mark-up the operators charge
is estimated to be around 25% of the price that a supplier asks for a tour (based on
interview with local expert, 2013). We estimate that at least 45 people are involved in
the tour industry on a full-time basis and roughly 30 on a part-time basis.

Table 4 Tour suppliers connected to BT&V (as of 2012)

 Operators that are connected to BT&V:

 • The Seacow • Tropical Travel
 • Dive Friends • Bowalie Yachts
 • The Mangrove Center • Windows at the Sea
 • Butterfly Farm Bonaire • Bigfoot Tours
 • The Bike Shop • Piskatur Fishing Charters
 • Mushi-Mushi Sailing • Mangazina di Rei
 • Achie Tours

 16
2.5.5 Independent tour suppliers
Not all tours and activities are booked on board of the ships. In the period of 2012-
2014, there was a substantial part of cruise tourists that booked their tours
independently. Near the pier, there is a little market where independent tour suppliers
(that are not connected to a tour operator) can sell their tours. However, many tours are
booked online in advance.
There are some tour operators that use both tour agencies and sell tours
independently. Most of the independent tour operators are connected to the Bonaire
Explorer Association (BEA), which aims to organise the independent operators and
smoothen operations at the pier. The organization does not sell tours.

2.5.6 Taxis
Not all tourists decide to take an organised tour. Taxi drivers can be hired to visit
specific locations, but they can also offer tours around the island. Based on an
interview with an expert of the Tourism Corporation Bonaire (TCB), in 2012 there were
around 36 licensed taxis active on Bonaire, which could transport around 285 tourists
at once. When there are two cruise ships on Bonaire the capacity is not sufficient and
an additional 9 drivers are allowed to drive cruise tourists around the island. See Table
5 for an overview of the capacity per taxi and an estimate of their earnings.
Normally all taxi drivers make at least one trip on a day that a cruise boat arrives. It is
usually not possible for the drivers to make more than 2 trips on one day and a
transport drive to the Sorobon area. The average tour costs around $25 per person and
the trip to Sorobon $10 dollars for a return. This means that taxi drivers in aggregate
earn at least $7,125 per day and a maximum of $17,100 per day if every driver does
two tours and a transport on a day with one cruise ship. Including all auxiliary drivers,
these potential revenues rise to $8,175 and $19,620.

Table 5 The capacity and earnings of taxis and auxiliary drivers

Taxis
 Capacity Amount of 1 tour (25 USD$ per 2 tours + transport (60
 per taxi taxis seat) USD$ pp)

 4 6 $600 $1,440
 6 4 $600 $1,440
 8 20 $4,000 $9,600
 11 1 $275 $660
 12 2 $600 $1,440
 14 3 $1,050 $2,520
 Total 55 36 $7,125 $17,100

Auxiliary drivers
 Capacity Amount 1 tour (25 USD$ per 2 tours + transport (60
 seat) USD$ per seat)

 4 7 $700 $1,680
 6 1 $150 $360
 8 1 $200 $480
 Total 18 9 $1,050 $2,520

 17
2.5.7 Other business owners
A range of additional expenditures is made by cruise tourists. Tourists do spend some
money on food and beverages during their stay. But also buy local goods from retailers
or market stall vendors. Schep et al. (2012a) estimated these expenditures to be on
average $28.50 on shopping at retailers and $9 on food and beverages, both per cruise
tourist. For 158,000 cruise tourists during a year, this would amount to $4.5 million for
retailers and $1.4 million for the cafeteria.
Retailers and cafeteria that are likely to benefit most from cruise tourism are the ones
that are located on the promenade near the cruise pier and on and around the Kaya
Grandi. We estimate that between 25 and 35 cafeteria, 20 to 25 retailers and around 8
market vendors in Kralendijk benefit from the cruise tourists. The establishments at
Sorobon (the Beach Hut in particular), Plaza and the Spice Beach Club are also likely to
benefit. 7 percent of our cruise respondents visited Sorobon and 13 percent visited
Eden Beach (the Spice Beach Bar beach). The amount of visitors to Plaza is unknown.
Based on the data collected in the business survey by Wolfs Company in 2014 (Wolfs
Company, in preparation), we estimate that 40% of the customers in the retail sector
are cruise tourists. In the food and beverages sector, this is estimated to be 17.5%.

 18
3 Methodology: Economic input-output and
 environmental indicators

3.1 Introduction
In the previous chapter, the cruise tourism industry in Bonaire was presented. We will
use an input-output model (IO Model)4 to analyse the economic and environmental
impact of different scenarios of cruise tourism in Bonaire. This model will help us
calculate the effects for the economy from an increase in the number of cruise tourists.
In addition, the model will also allow us to explore how an increase in the number of
cruise tourists will impact the environment and how this will affect the natural stocks
required for the economic development in the island. In the first section of this chapter,
we will present the number of tourists that is used as the starting point for the scenario
analysis. Next, we will briefly introduce the GDP figures of Bonaire and the method for
calculating the economic value of cruise tourism. In section 3.4, we will refer to some of
the external environmental effects of cruise tourism. In the last section, the IO Model
will be explained, including its ecologic module.

3.2 Number of tourists
Bonaire receives around 80,000 stay-over tourists and around 150,000 cruise tourists
per year5. For the IO Model, the number of tourists that arrived in Bonaire in 2012 is
used as the starting point. In 2012, 80,000 stay-over tourists arrived in Bonaire by
plane. The stay-over tourists stay on average 7 days on Bonaire (CBS, 2014c).
In 2012, cruise ships with an average capacity of 1,500 cruise passengers per ship,
visited Bonaire (CBS, 2014c), for a total of approximate 158,000 cruise tourists. This
total estimate is based on the actual total passenger of the ship that arrived. While
there is no official account of how many passengers actually disembark on Bonaire, we
have assumed that 100% of the passengers disembark (see 2.4.1 for the calculations
that support this assumption). The cruise ship tourists that disembark spend on
average 6 hours on the island (Schep et al., 2012a).

3.3 The economic value of cruise tourism
3.3.1 GDP and economic industries
Bonaire's GDP in 2012 was $372 million (CBS, 2014b). As presented in Figure 9, the
hotels and restaurants industries, which are the most evidently affected by the number
of tourists visiting Bonaire, represent an important economic pillar of Bonaire’s
economy. However, most of the other industries also benefit from tourists visiting the
island, such as manufacturing; trade; transport and communication, and other services

4
 The IO Model was developed by Van Zanten and Koks (2015) commissioned by Wolfs Company as
part of its Green Economy project in Bonaire. It provides a tool to test the economic and
environmental impacts of potential policy decisions. Given that tourism is such an important pillar in
Bonaire’s economy, it was designed to also allow testing scenarios of tourism development.
5
 Based on the figures of the CBS for the years 2012 and 2013.

 19
(which include culture and recreation). Visitors are attracted by the unique combination
of terrestrial and marine ecosystems and the variety of activities they can enjoy on the
island, such as diving, snorkelling, kayaking, windsurfing, sailing and bird watching (Info
Bonaire, 2012).

 Education, Manufacturing;
 4,84 10,17 Agriculture, fishing,
 mining, 10,65

 Construction, 14,30

 Transport and Restaurants, 15,66
 communication;
 57,20

 Hotels, 18,44

 Financial
 Other real estate
 Intermediation;
 activities, 53,00
 22,33

 Health, 22,86

 Trade, 40,00 Electricity, gas,
 and water supply;
 23,30
 Public
 administration and
 Other services, defense, 31,27
 34,06

Figure 9 - Added value in millions of dollars for different industries on Bonaire

The division in economic industries shown in Figure 9 6 is based on the industry
classification used in the IO Model (as further explained in section 3.5 below), which
follows the international standards for industrial classification of economic activities
developed by the United Nations. Since tourism is not one of these industries, it is
difficult to measure the total percentage of the GDP that represents the value added of
the expenditures made by tourists that visit Bonaire. In the next section, we will present
an economic valuation of the tourism in Bonaire. In addition, and as further explained in
section 3.5 below, the IO Model will be used to calculate how a change in the number
and composition of tourists will modify the production in the different industries and
ultimately the added value to the economy by these industries.

6
 The portion of Bonaire’s GDP that is attributed to taxes and subsidies ($15 million) is not depicted in
Figure 9.

 20
3.3.2 An economic valuation of tourism
According to the definitions of Hein (2010) and van Beukering et al. (2007b) tourism is
identified as a direct-use value. It is different from a direct-use provisioning ecosystem
service like fisheries in the sense that there are no physical goods that represent the
benefits. The benefits are intangible experiences. A market valuation technique is
therefore not always applicable, since the services are not necessarily traded on a
market; i.e. tourists can easily benefit from the ecosystems on their own. There are a
few possibilities to value touristic ecosystem services, of which the willingness to pay
net factor income and the production function approach are the most similar to the
market valuation technique described by Hein (2010). By investigating what tourists pay
to consume a particular ecosystem service, the net income value of that amount can be
calculated to determine the producer surplus of the service. Using the composite value
of the Producer Surplus (PS) and the Consumer Surplus (CS), the total ecosystem
service value of tourism on Bonaire has already been calculated by Schep et al.,
(2012a). The valuation and aggregation procedure is also explained in that study. For a
detailed description of the results of the tourist survey, see Schep et al. (2012a).
Below, we will update the results of the CS obtained in the TEEB study, based on the
baseline number of tourists (see section 3.2). Afterwards, we will explain how the
expenditures made by tourists will be used in the IO Model in order to determine
tourists’ contribution to Bonaire’s economic industries.
Consumer surplus
As mentioned in the TEEB study, the CS is calculated using the WTP estimates
determined in the Choice Experiment. This CS is also valid for the ecosystem services
that are not paid for. For example, hiking around Bonaire is only valued by means of the
CS, since it is not a service that is bought from a provider.
Based on the results of the Choice Experiment, which were corrected for confidence
and to prevent biases caused by an overrepresentation of stay-over tourists in the
sample, the TEEB study arrived at a total WTP for cruise tourists for ecosystem
protection (terrestrial and marine environment), environmental management,
maintaining safety and tempering the crowdedness on the island of $7,900,000. Table 6
shows an update of the CS values obtained in the TEEB study according to the number
of tourists in 2012. There is no significant difference in the WTP for stay-over and cruise
tourists. However, because stay-over tourists stay roughly 10 days longer compared to
cruise tourists (who only visit for a day), Average WTP per trip is a factor 10 times
higher for stay-over tourists.
Table 6 Total WTP for maintenance of the marine and terrestrial environment, for extra environmental
management, and for maintaining the safety and tranquillity of the island (in US$ per year)

 Attributes Average Total WTP Average Total WTP
 WTP stay- stay-over WTP cruise
 over (82,000) cruise (158,000)
 Marine environment $219 $17,958,000 $21 $3,318,000
 Terrestrial environment $21 $1,722,000 $2 $316,000
 Environmental
 $41 $3,362,000 $4 $632,000
 management
 Safety $186 $15,252,000 $18 $2,844,000
 Crowdedness $54 $4,428,000 $5 $790,000

 21
Tourists’ expenditures in IO Model7
Since there is no tourism satellite account (TSA) available for Bonaire, data from several
sources is used to acquire an estimation of the tourism expenditures of both the stay-
over and cruise tourists. Trade data has been obtained from the Statistical Office of the
Netherlands (CBS) for the year 2012 and the results of the tourist exit survey,
conducted by Schep et al. (2012a). With this data, several steps are taken to come to
the specific tourism expenditures. To start with, the expenditure pattern of a stay-over
and a cruise tourist is identified. More specifically, the products and services that are
identified in the tourist exit survey, including the amount of money spent on these
goods and services, are allocated to the different sectors. For instance, the amounts
spent on accommodation by a stay-over tourist are allocated to the hotel sector. The
next step is to determine the total tourist expenditures, based on the amount of stay-
over and cruise tourists that come to the island yearly. In 2012, there were 82,000 stay-
over tourists and 158,000 cruise tourists (CBS, 2014a). Finally, these tourist
expenditures have been slightly rescaled to match with the total export minus the
export trade data in the IO Model. In the model, it is assumed that all cruise tourists
disembark from the cruise ships.

3.4 The environmental impact of cruise tourism
3.4.1 Tourist-related impacts
Coral reefs and consequently beach ecosystems are threatened through various global
and local forces. The global level lies outside Bonaire’s mitigation capabilities, the local
threats posed to coral reefs, however, lie within the control of Bonaire and can be
avoided through sustainable management. One of the threats posed to coral reefs at
the local level is through the increase in tourism (Burke and Maidens, 2004). Cruise
tourism results in large groups of people visiting natural and cultural sites in a short
period of time. Increase in cruise ship tourism can lead to overcrowding and
congestion in a short time frame. The overcrowding issue in this case has two aspects.
The first is an environmental threshold, such as for solid waste disposal and sewage
treatment. The second is the perception of overcrowding because of cruise visitors
using recreational areas (Sorobon survey, 2010). The Caribbean reefs are at serious
risk, caused by many stressors such as sediment run-off, untreated waste and pollution
from cruise ships and an increase in the amount of tourists on the island.
Tourism is an important driver behind the economy of Bonaire. However, this economic
contribution comes with a price. The economic benefits derived from tourist
expenditures and income for local residents has also a costs side. Costs not only
include operational costs, but also economic leakage, social and environmental costs.
Cruise tourism environmental impact
Tourists are attracted to conservation areas whereas these areas encounter the worst
environmental damage (Davenport and Davenport, 2006). As a result of high numbers
of visitors in a short period, the carrying capacity of fragile areas can be exceeded and
in some cases impacts are irreversible (Debrot et al., 2012). Johnson (2002) uses a life-
cycle analysis to define the different types of cruise tourism impacts. This resulted in:
 • Infrastructure impacts, such as the construction of cruise passenger terminal
 facilities and its modifications necessary to the natural environment;

7
 Adapted from Van Zanten and Koks (2015).

 22
• Operational impact involving energy, water usage and impact of the cruise ship
 on the marine environment;
 • Distribution impacts by supplying a cruise liner with provisions (not a major
 contributor on Bonaire, because the provision of food and water to the ships is
 limited, (pers. comm. cruise ship agency on Bonaire));
 • Use impacts of tourism visiting the island, such as water use, driving around
 etc.;
 • Waste impacts of the cruise ship (Bonaire does not have the proper equipment
 to process waste from ships and is therefore able to refuse the acceptance of
 waste by cruise ships).
Furthermore, the environmental impact can be direct and indirect. With direct impact
we mean impact by activities tourists undertake causing physical damage and
ecological disturbance on Bonaire. Indirect impact is defined as impact to coastal
habitats caused by development of marine recreational activities and related pollution,
such as sewage and waste on Bonaire. For an overview of activities with direct and
indirect impact, see Annex E.
External effects in the model
The IO Model focuses on certain impacts, denominated External Effects, which are
caused by the economic activity in general but which are also influenced by the number
and composition of tourists. These external effects are: physical reef destruction,
nutrient concentration and sedimentation. These external effects are taken into account
in the IO Model to calculate how the changes in numbers of tourists may impact the
environment. These external effects, as well as how they are accounted for in the
model, are further described in section 3.5.

Other impacts
There are other environmental impacts of cruise tourism, which were investigated but
which could not be taken into account in the model. These include nutrient enrichment
and toxic effects by sunscreen contribute to the possibility of going over the threshold
of beach carrying capacity. For information on each of these other impacts see Annex F
– Other socio-environmental impacts of cruise tourism

3.4.2 Ecological footprint of cruise ships: Acquatrail
Cruise ships also have an ecologic footprint on the coastal waters of Bonaire. Marine
Positive developed a model in cooperation with the Polytechnic University of Marche,
Italy, called Acquatrail (www.marinepositive.com). The Acquatrail is the aquatic
equivalent of the carbon footprint in the sense that it takes water pollutants into
consideration, i.e. gaseous, liquids and solids that damage aquatic environments. By
contributing alongside carbon and water footprints it provides a holistic picture of
anthropogenic impacts on marine environments. The Acquatrail accounts for multiple
stressors on the affected ecosystems. The data required for the input of the Acquatrail
calculations was provided by IMARES, a research institute that is part of Wageningen
University. Given that it is difficult to calculate in a reliable manner the impacts of this
ecological footprint in the Bonaire economy, this footprint was not incorporated in the
IO Model. For the results of the calculation of the ecological footprint of cruises in
Bonaire, see Annex G – The ecological footprint of cruise ships.

 23
3.5 The IO Model with an ecological module8
3.5.1 Bonaire’s IO Model
Standard input-output (IO) models are, in their most basic form, a simple system of
equations, each one of which describes the distribution of an industry’s product
throughout the economy. More specifically, IO models describe the economy through
sets of interrelationships between sectors themselves (the producers) and others (the
consumers). These interrelationships between sectors are driven by intermediate
demand and come as a result of fixed production coefficients in each sector. In an IO
model, the ‘world’ is assumed to be demand driven, which means that the production
in industries is driven by the final demand. The final demand in itself consists of the
demand from consumption of goods from households, governments, exports and
investments. IO models are the basis of IO tables, which can be described as a
numerical representation of the economy, showing all the economic relations previously
described9. In this section, we will briefly explain how the IO table for Bonaire, including
specific tourism exports, has been constructed. This table forms the basis of Bonaire’s
IO Model, which will also be explained in this section. Finally, we will explain how this
model will be used to compare cruise tourism scenarios by looking at the multiplier
effects and the environmental impacts.
Bonaire’s IO table and IO Model
An input-output (IO) table can be defined as a table that shows, in monetary units, an
overview of all the transactions within and between sectors and other economic actors
in a given region (such as households and governmental agencies), for a specific region
and for a specific time period (Miller and Blair, 2009). One of the key inputs for an IO
table is a supply and use table (SUT). A supply table describes the supply of goods and
services, which are either produced in the domestic industry or imported. The use table
shows where and how goods and services are used in the economy. Furthermore the
use table shows the income generated in the production process (Eurostat, 2008).
The IO table for Bonaire is based on the SUT of Bonaire, developed for the year 2004
by the Statistical Bureau of the Dutch Antilles. The compilation of the resulting IO table
is almost fully based on the work of Van De Steeg (2009) and Steenge (2010). Bonaire’s
IO table is further an industry-industry table with a fixed product sales structure, known
as ‘model D’ (Eurostat, 2008). This means that that the table describes the economy in
terms of industries interacting with each other and that each product is assumed to
have its own specific sales structure, irrespective of the product mix. Given the
particular characteristics of Bonaire’s economy, the SUT table was slightly adjusted to
be able to apply model D.10
Due to the differences in the economy (changes of government structure, etc.) and
currency (from Antillean Guilders to US dollars) since 2004, Bonaire’s IO table is
updated to 2012, using the latest GDP numbers published by the Dutch statistical
bureau (CBS). It is important to note that this update is based on rough estimates of the
GDP and no changes have been made to the economic structure of the island. Since
2010, however, the island has undergone some strong institutional changes in the
government sector. As such, it is (even more) important that outcomes of the model
should be interpreted only as rough estimates.

8
 Sections 3.5 to 3.7 have been taken and adapted from Van Zanten and Koks (2015).
9
 For an explanation on IO tables in general, see Annex H – Input-Output Tables.
10
 For an overview of the adjustments applied, see Van Zanten and Koks (2015).

 24
You can also read