4Q 2021 RESULTS PRESENTATION - 27 JANUARY 2022 - CAPITALAND INVESTMENT
←
→
Page content transcription
If your browser does not render page correctly, please read the page content below
4Q 2021 Results
Presentation
27 January 2022
Forward-Looking Statement

This presentation may contain forward-looking statements. Actual future performance, outcomes and results may differ materially from those expressed in
forward-looking statements as a result of a number of risks, uncertainties and assumptions. Representative examples of these factors include (without
limitation) general industry and economic conditions, interest rate trends, cost of capital and capital availability, availability of real estate properties, competition
from other developments or companies, shifts in customer demands, shifts in expected levels of occupancy rate, property rental income, charge out
collections, changes in operating expenses (including employee wages, benefits and training, property operating expenses), governmental and public policy
changes and the continued availability of financing in the amounts and the terms necessary to support future business.

You are cautioned not to place undue reliance on these forward-looking statements, which are based on the current view of management regarding future
events. No representation or warranty express or implied is made as to, and no reliance should be placed on, the fairness, accuracy, completeness or
correctness of the information or opinions contained in this presentation. Neither CapitaLand Malaysia REIT Management Sdn. Bhd. (formerly known as
CapitaLand Malaysia Mall REIT Management Sdn. Bhd.) (“Manager”) nor any of its affiliates, advisers or representatives shall have any liability whatsoever (in
negligence or otherwise) for any loss howsoever arising, whether directly or indirectly, from any use of, reliance on or distribution of this presentation or its
contents or otherwise arising in connection with this presentation.

The past performance of CapitaLand Malaysia Trust (“CLMT”) is not indicative of future performance. The listing of the unit in CLMT (“Units”) on the Bursa
Malaysia Securities Berhad (“Bursa Malaysia”) does not guarantee a liquid market for the Units. The value of the Units and the income derived from them
may fall as well as rise. Units are not obligations of, deposits in, or guaranteed by, the Manager or any of its affiliates. An investment in the Units is subject to
investment risks, including the possible loss of the principal amount invested. Investors have no right to request that the Manager redeem or purchase their
Units while the Units are listed on the Bursa Malaysia. It is intended that holders of Units may only deal in their Units through trading on the Bursa Malaysia.

This presentation is for information only and does not constitute an invitation or offer to acquire, purchase or subscribe for the Units. This presentation is for
information only and does not constitute an invitation or offer to acquire, purchase or subscribe for the Units.

C a p i t a L a n d Ma l a ys i a Tr u s t                                                                                                            4Q 2021 Results Presentation   2

Table of Content
01
Key Highlights

02
Financial
Performance

03
Portfolio Update

04
Sustainability

05
Supplemental
Information

Key
Highlights
  //01                                                                                      //02                                                                     //03
  FY 2021 Financial Performance                                                             Operational Performance                                                  Investment Mandate Expansion
                                                                                         • Continued improvement in shopper                                         • Expanded investment objective and
• RM103.1 million                                                                          traffic and tenant sales following                                         policy beyond retail which includes
      Net Property Income                                                                  resumption of dine-in services and                                         commercial, office and industrial
                                                                                                                                                                      classes1
• RM39.0 million                                                                           domestic travel activities, and
      Distributable Income                                                                 reopening of retail trades
                                                                                         • In 4Q 2021, shopper traffic grew 161%
• 1.84 sen                                                                                 from the previous quarter while tenant
      Distribution Per Unit                                                                sales per square foot grew 115% for
                                                                                           the same period
• RM3.8 billion
      Valuation of Portfolio

Notes:
1. It shall include but shall not be limited to business parks, logistics facilities, warehouses, distribution centres, data centres and integrated developments.

C a p i t a L a n d Ma l a ys i a Tr u s t                                                                                                                                               4Q 2021 Results Presentation   4
Financial
Performance
Distribution Statement
 RM’000         DYNAMIC STRATEGY                                                                      4Q 2021
                                                                                                        Actual
                                                                                                                            4Q 2020
                                                                                                                              Actual
                                                                                                                                       Change
                                                                                                                                                    FY 2021
                                                                                                                                                      Actual
                                                                                                                                                                FY 2020
                                                                                                                                                                  Actual
                                                                                                                                                                                  Change

                UNRELENTING FOCUS
                                                                                                                                           %                                          %
                                                                                                   (Unaudited)           (Unaudited)             (Unaudited)   (Audited)
 Gross revenue                                                                                            66,062             66,941      (1.3)      224,107     261,399              (14.3)
 Less: Property operating expenses                                                                      (32,836)            (32,911)     (0.2)     (120,969)   (127,898)              (5.4)
 Net property income                                                                                      33,226             34,030      (2.4)      103,138     133,501              (22.7)
 Interest income                                                                                               354              274      29.2          1,215      1,512              (19.6)
 Fair value losses on investment properties                                                             (76,389)           (157,850)    (51.6)      (76,389)   (157,850)             (51.6)
 Other non-operating income                                                                                 1,625                  -         -         3,250      4,958              (34.4)
 Net investment (loss)/profit                                                                           (41,184)           (123,546)    (66.7)       31,214     (17,879)          (>100.0)
 Manager’s management fee                                                                                 (4,453)            (4,532)     (1.7)      (16,437)    (18,244)              (9.9)
 Trust and other expenses                                                                                    (413)             (616)    (32.9)       (2,539)     (2,169)               17.1
 Finance costs                                                                                          (11,829)            (13,765)    (14.1)      (48,121)    (58,479)             (17.7)
 Loss before taxation                                                                                   (57,879)           (142,459)    (59.4)      (35,883)    (96,771)             (62.9)
 Taxation                                                                                                          -               -         -             -           -                   -
 Deferred taxation                                                                                          5,490            12,267     (55.2)         5,490     12,267              (55.2)
 Loss for the quarter/year                                                                              (52,389)           (130,192)    (59.8)      (30,393)    (84,504)             (64.0)
 Distribution adjustments                                                                                 70,268            147,914     (52.5)       69,523     146,242              (52.5)
 Income available for distribution                                                                        17,879             17,722       0.9        39,130      61,738              (36.6)
 Distributable income1                                                                                    17,690             17,845      (0.9)       39,033      61,830              (36.9)
 DPU (sen)                                                                                                    0.83              0.86     (3.5)          1.84       3.00              (38.7)
Notes:
1. The difference between income available for distribution and distributable income is due to rounding effect of DPU.

C a p i t a L a n d Ma l a ys i a Tr u s t                                                                                                                            4Q 2021 Results Presentation   6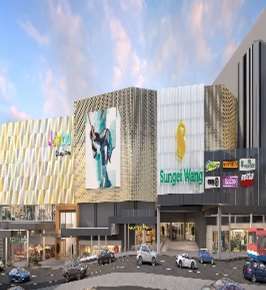
Impact of COVID-19
                DYNAMIC STRATEGY
On Distributable Income and DPU
                UNRELENTING FOCUS                                                                                                                                                Most states
                                                                                                                                                                                 rolled into
RM’mil                                                                                                                                                                                            Sen
                                                                                                                                                                                 Phase 4 of
 25                                                                                                                                                                                                 1.5
                                                                         23.2                                                             MCO-3                                  NRP during
                                                                                                                                          7 May to                               the quarter.
                     20.1                                                                                                                 31 May 2021
 20                                                                                                                                                                                                 1.2
                                                                                                    17.8                                  FMCO                                      17.7
                                                                                                                                          1 Jun to             Phase 1 of
                                                                                                                        MCO-2
                                                                                                                                          28 Jun 2021          NRP
                                                                                       1.13                             13 Jan to
 15                                                                                                                                                            continue                             0.9
                                   0.98                                                                                 4 Mar 2021
                                                                                                                                                               for most                    0.83
                                             MCO-1                                                              0.86                                           states until
                                             18 Mar to                                                                                        10.6             9 Sep 2021
                                             3 May 2020
 10                                                                                                                                                                                                 0.6
                                                                                                                           7.6
                                                                                                                                                        0.50

   5                                                                                                                               0.36                                                             0.3
                                                                                                                                                                   3.2
                                                       0.03                                                                                                               0.15
                                                 0.6
   0                                                                                                                                                                                                0
                 1Q 2020                      2Q 2020                 3Q 2020                    4Q 2020                 1Q 2021            2Q 2021             3Q 2021           4Q 2021
                                                                                                 Distributable Income            DPU

Notes:
FMCO refers to Full Movement Control Order.
NRP refers to National Recovery Plan and is a four-phased exit strategy from June to December 2021 from the pandemic.

C a p i t a L a n d Ma l a ys i a Tr u s t                                                                                                                                        4Q 2021 Results Update   7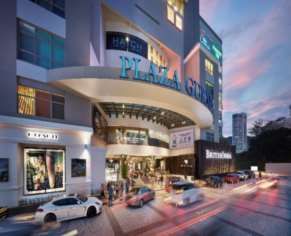
Distribution Reinvestment Plan
                DYNAMIC STRATEGY
                UNRELENTING FOCUS
Final Income                            •    Final income distribution of 0.98 sen per CLMT Unit (of which 0.26 sen per CLMT Unit is taxable
Distribution                                 and 0.72 sen per CLMT Unit is non-taxable in the hands of Unitholders) for the period from 1 July
                                             2021 to 31 December 2021
Distribution                            •    The Distribution Reinvestment Plan (DRP) shall apply to the Final Income Distribution where the
Reinvestment                                 gross electable portion will be 0.98 sen per Unit and the Unitholders can elect to reinvest the
Plan                                         entire distribution income or a portion of the distribution income into new Units
Bursa                                   •    The additional listing application (ALA) in relation to the issuance of new CLMT Units pursuant to
Malaysia’s                                   the DRP will be submitted to Bursa Malaysia at the date of this announcement; and
Approval                                •    The details on the issue price of the new CLMT Units, the entitlement date for the Final Income
                                             Distribution and the DRP as well as the payment date will be announced upon obtaining Bursa
                                             Malaysia’s approval on the ALA

C a p i t a L a n d Ma l a ys i a Tr u s t                                                                                           4Q 2021 Results Update   8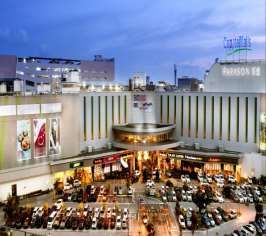
Debt Profile
                DYNAMIC STRATEGY
As at 31 Dec 2021
                UNRELENTING FOCUS
  RM’mil                                             Well-spread Debt Maturity Profile
 1,500                   1,413

                          195
 1,200                                                                                                                       14%
                          300

    900                                                                                                                                          65%
                                                                                                                       21%

    600
                          918

    300                                                                                                          50

                                                             300                                348              300
                                                                             270
                                             145                                                                       Diversified Sources of Funding
        0
                      Total                  2022           2023            2026                2027            2028
                   Borrowings
                    Term Loan Facilities            Unrated Medium Term Notes            Revolving Credit Facilities

C a p i t a L a n d Ma l a ys i a Tr u s t                                                                                           4Q 2021 Results Presentation   9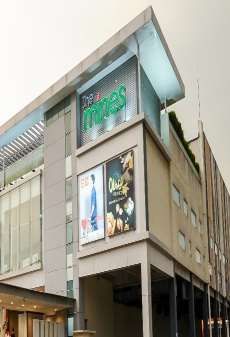
Key Financial Indicators
                DYNAMIC STRATEGY
As at 31 Dec 2021
                UNRELENTING FOCUS

                                                                             4Q 2021                        3Q 2021                                            FIXED VS FLOATING RATE
                                                                                                                                                                     DEBT RATIO
Unencumbered assets
                                                                                 27.8%                          28.4%
as % of total assets
                                                                                                                                                                             19%
Gearing ratio                                                                    35.9%                          35.6%
Average cost of debt                                                             3.34%                          3.38%                                                                                     81%

Debt / EBITDA (times)1                                                               15.9                           16.3

Interest coverage (times)1                                                              1.9                            1.8

Average term to maturity (years)                                                        4.0                            3.0
                                                                                                                                                                Fixed Rate                          Floating Rate

Notes:
1. With effect from 1Q 2021, EBITDA is determined on a 12-month trailing basis to smoothen out seasonality factors. Previously, annualised EBITDA for the reporting period was applied in computing these ratios.

C a p i t a L a n d Ma l a ys i a Tr u s t                                                                                                                                                                      4Q 2021 Results Presentation   10
Balance Sheet
DYNAMIC STRATEGY
UNRELENTING FOCUS
As at 31 Dec 2021 RM’mil
Non-current Assets 3,830 Net Asset Value (RM’mil)
Current Assets 103 - before income distribution 2,391
Total Assets 3,933 - after income distribution 2,370
Current Liabilities 247
Non-current Liabilities 1,295 Net Asset Value per Unit (RM)
Total Liabilities 1,542 - before income distribution 1.1222
Net Assets 2,391 - after income distribution 1.1124
Total Unitholders’ Funds 2,391
No of Units in Circulation (mil) 2,131
C a p i t a L a n d Ma l a ys i a Tr u s t 4Q 2021 Results Presentation 11Valuation of Portfolio
DYNAMIC STRATEGY
UNRELENTING FOCUS
Current Previous Current
Capitalisation
Valuation Valuation Change Valuation
Property Rate
31 Dec 2021 31 Dec 2020 (%) (per sf of NLA)
(%)
RM’mil RM’mil RM
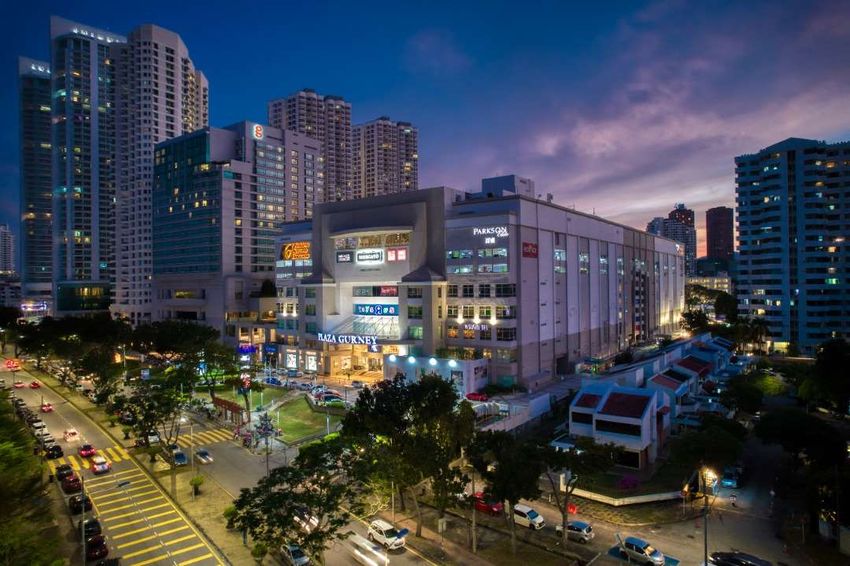
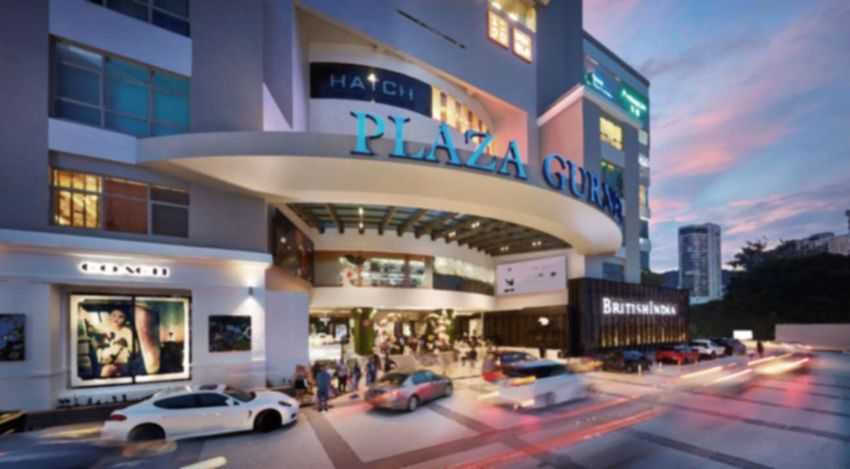
Gurney Plaza 1,665.0 1,665.0 0.0 6.75 1,879
East Coast Mall 579.0 579.0 0.0 7.00 1,241
Sungei Wang
442.0 475.0 (6.9) 7.00 1,074
Plaza
3 Damansara
480.0 496.0 (3.2) 6.50 844
Property
The Mines 660.0 680.0 (2.9) 7.00 899
CLMT Portfolio 3,826.0 3,895.0 (1.8) 1,248
Notes:
3 Damansara Property comprises 3 Damansara and 3 Damansara Office Tower.
C a p i t a L a n d Ma l a ys i a Tr u s t 4Q 2021 Results Presentation 12Portfolio Update
Retail Performance
Confidence of shoppers reflected as 97.9% of adult population1 fully vaccinated

                      Recovery levels for tenant sales per sf and shopper traffic for CLMT portfolio                                       4Q 2021 key highlights
                                                   vs average for 2019
 120%                                                                                                                                      •   Shopper traffic and tenant
                                                                                                                                  100.5%       sales      rebounded   from
               2019 Average2
 100%                                                                                                                                          previous quarter supported
                                                                                                                                               by the resumption of dine-in
   80%                                                                                                                             68.9%       services and reopening of
                                                                                                                                               retail trades
   60%                                                                                                                                     •   For Gurney Plaza and East
                                                                                                                                               Coast Mall, domestic travel
   40%                                                                                                                                         activities   aided     footfall
                                                                                                                                               recovery
   20%                                                                                                                                     •   All malls’ various marketing
                                                                                                                                               activities   supported     the
      0%                                                                                                                                       recovery of tenant sales
                   1Q 2020                   2Q 2020        3Q 2020              4Q 2020     1Q 2021      2Q 2021    3Q 2021   4Q 2021
                                                          Shopper Traffic              Tenant Sales RM psf/quarter

Notes:                                                                                                                                          .
1. COVIDNOW in Malaysia: As at 26 January 2022.
2. 2019 average shopper traffic and tenant sales per sq ft.
• Tenant sales per sq ft for the current quarter (4Q 2021) is for two months only.

C a p i t a L a n d Ma l a ys i a Tr u s t                                                                                                               4Q 2021 Results Presentation   14
Occupancy Rate
• Portfolio occupancy rate above 80%,
• Occupancy rate of outstation malls remains well above 90%
90.9% 88.3% 86.4% 86.6% 85.1% 83.9% 81.6% 82.5%
90.5% 87.9% 87.4% 87.6% 86.1% 82.6% 83.7%
84.5%
100.0% 100.0% 57.4% 57.4% 57.4% 65.9% 52.7% 47.0%
Mar-20 Jun-20 Sep-20 Dec-20 Mar-21 Jun-21 Sep-21 Dec-21
Portfolio Occupancy Rate Retail Office
Notes:
1. Based on committed leases.
C a p i t a L a n d Ma l a ys i a Tr u s t 4Q 2021 Results Presentation 15Rental Reversion
DYNAMIC STRATEGY
Striking a balance between rental reversion and occupancy
UNRELENTING FOCUS
From 1 January to 31 December 20211
Variance over
No. of new Area % of Total Net
Property preceding average
leases/renewals (sq ft) Lettable Area
rental2, 3, 4 (%)
Gurney Plaza 88 144,357 16.3 -10.6
East Coast Mall 62 70,570 15.1 -1.1
Sungei Wang Plaza 28 33,932 8.2 -45.7
3 Damansara 31 72,250 15.5 -31.8
The Mines 76 138,593 18.9 -15.4
Retail 285 459,702 15.5 -13.4
3 Damansara Office Tower 3 38,996 38.5 4.1
CLMT Portfolio 288 498,698 16.3 -12.7
Notes:
1. Excluding newly created and reconfigured units.
2. Excluding gross turnover rent component.
3. Majority of leases have rental escalation clause.
4. The % is computed based on the increase of the average rental of the renewed term over average rental of the preceding term.
C a p i t a L a n d Ma l a ys i a Tr u s t 4Q 2021 Results Presentation 16Portfolio Lease Expiry Profile (By Year)
Based on committed leases as at 31 December 2021
Portfolio Lease Expiry Profile
% of GRI 48.8% 48.9%
45.9%
39.3%
31.4% 31.2%
19.8% 19.9%
14.8%
GRI
(RM ‘000) 8,677 8,586 91 5,582 5,475 107 3,528 3,494 34
2022 2023 2024 & Beyond
Portfolio Retail Office
C a p i t a L a n d Ma l a ys i a Tr u s t 4Q 2021 Results Presentation 17Rejuvenating Offerings to Capture Demand
DYNAMIC STRATEGY
Introduction of new-to-Northern region brands
UNRELENTING FOCUS
LE LABO
Gurney Plaza
-----------------------------------------
‘
The only LE LABO store in Penang, located on the Ground Floor, is a niche brand born in Grasse and raised
in New York. The industrial store design brings out the laboratory concept of the perfume brand’s identity.
Every fragrance is freshly blended by hand and each label is personalised at the moment of purchase.
KARL LAGERFELD
Gurney Plaza
-----------------------------------------
Karl Largefeld, the namesake brand of the legendary designer, has opened its first store in the Northern
region, featuring the full spectrum of Karl Lagerfeld collection. Taking inspiration from Karl Lagerfeld’s own
home and Parisian office, the outlet’s concept is sophisticated and clear with an inviting, light and open
ambience.
HAVAIANAS
Gurney Plaza
-----------------------------------------
The only HAVAIANAS in Penang, located on Level 1, originates from Brazil. Havaianas are touted as the #1 flip flop
for men, women, kids and babies. The kiosk is planned to be as open and inviting as possible, dazzling shoppers
with a kaleidoscope of colourful Havaianas assorted finishings and prints.
C a p i t a L a n d Ma l a ys i a Tr u s t 4Q 2021 Results Presentation 18Rejuvenating Offerings to Capture Demand
DYNAMIC STRATEGY
UNRELENTING FOCUS
KYOCHON
East Coast Mall
-----------------------------------------
One of the largest Korean fried-chicken restaurants, Kyochon, has opened its first outlet in the
East Coast region. With an eco-friendly, modern contemporary design, the outlet is designed with
wood and metal materials. What is most striking is the authentic, red wooden door entrance
statement with the wall finishes and feature ceiling lighting that strikes a balanced and warm dining
experience.
TOMMY HILFIGER
East Coast Mall
-----------------------------------------
A globally-renowned designer fashion brand with an ever-optimistic take on iconic pop culture and classic
American-cool styles, exude confidence and luxury with Tommy Hilfiger’s collection of men and women’s
clothing, shoes, bags and accessories.
KAMSIAH BOUTIQUE
East Coast Mall
-----------------------------------------
Kamsiah Boutique offers a variety of quality and comfortable fashion for those that desire
elegance, beauty and charm.
C a p i t a L a n d Ma l a ys i a Tr u s t 4Q 2021 Results Presentation 19Rejuvenating Offerings to Capture Demand
DYNAMIC STRATEGY
FANCIER ESTHETIC WORLD
UNRELENTING FOCUS 3 Damansara
-----------------------------------------
A one-stop haircare, aesthetic and wellness destination, Fancier Esthetic World is spread over
14,500 square feet and offers a wide range of beauty-related services with excellent customer
care and aesthetic pleasure.
CHURITTO’S FRESH MEX
3 Damansara
-----------------------------------------
Churrito’s Fresh Mex is the first of its kind, freshly prepared Tex-Mexican food joint in Malaysia. Diners can indulge
in simple, healthy and low-calorie meals in the form of tacos, burritos, quesadillas and nachos.
HONOR
The Mines
-----------------------------------------
Widening the IT and digital-related brands and offerings on Level 4’s
Digitamart – a one-stop centre for IT and gadget enthusiasts!
KAIJUCRUNCH
The Mines
-----------------------------------------
KaijuCrunch is a fast, casual Korean street food brand. Get your Korean fix of
various types of corndogs and tteokbokki here.
C a p i t a L a n d Ma l a ys i a Tr u s t 4Q 2021 Results Presentation 20Shopper Engagement Initiatives
GURNEY PLAZA GURNEY PLAZA
Privilege PLUS+ Welcome Back Rewards & Private Events Ties of Three Generations Exhibition
Private shopping events in collaboration with Hugo Boss were extended to Gurney Endorsed by Penang Exco of Tourism, Arts, Culture and Heritage
Plaza’s Privilege PLUS+ members with tiered rewards curated to boost spending of (PETACH), the Ties of Three Generations Exhibition showcases more
affluent shoppers. than 80 art masterpieces by 35 artists ranging from 8 to 91 years old.
3 DAMANSARA THE MINES
Art, Beats & Eats A Joyous, Sparkling Christmas
A weekend space of art installation, pastel tropical set-up and interactive photo Escape to the waterways of Venice on board The Mines’ specially arranged
opportunities. Art, Beats & Eats event attracted art and music lovers. Christmas cruises along its internal 85-metre canal and around South Lake.
4Q 2021 Results Presentation 21Shopper Engagement Initiatives
JUMPA@SUNGEI WANG JUMPA@SUNGEI WANG
SG. Wang Collectors Market Weekend on Street
GURNEY PLAZA EAST COAST MALL
Winter Wonderland Joyous Christmas 2021
4Q 2021 Results Presentation 22Digital Initiatives
DYNAMIC STRATEGY
Leveraging CapitaStar to boost tenant sales
UNRELENTING FOCUS
3 DAMANSARA
Membership drive
CAPITASTAR CAPITASTAR
CapitaLand’s Plant Rewards CapitaLand X Shopee – Double 3 DAMANSARA THE MINES
Augmented Reality Game 11 Big Giveaways Elevate Your Food Thrills Year-End Electrifying Sale
C a p i t a L a n d Ma l a ys i a Tr u s t 4Q 2021 Results Presentation 23Sustainability
24Support for Communities
DYNAMIC STRATEGY
Continued support on food security and social assistance
UNRELENTING FOCUS
Flood Relief
With funding from CapitaLand Hope Foundation, CLMT together with CapitaLand Malaysia, have committed
RM150,000 in support of Mercy Malaysia’s 2021 Malaysia Flood Response, Recovery and Preparedness Plan to
assist in the ongoing emergency response and relief work.
#GivingBersama
Aside from a commitment of RM200,000 to
provide daily necessities to support more than
650 underprivileged children from 17 beneficiary
homes in Penang, Klang Valley, Kuantan and
Johor, various online programmes were also
Hip Hop workout Arts & Craft workshop
conducted to bring joy and cheer to the
underprivileged children.
CyberCrime talk Indian dance class
C a p i t a L a n d Ma l a ys i a Tr u s t 4Q 2021 Results Presentation 25Supplemental Information
FY 2021 Gross Revenue
                DYNAMIC STRATEGY
                UNRELENTING FOCUS
                                                                                                                           Lower gross revenue y-o-y
                                                                                                     224,107               due to:
                      Portfolio
                                                                                                                261,399
                                                                                                                           • Lower gross rental and other
                                                                                                                             classes of revenue mainly
                                                                      104,421                                                due to longer lockdown in FY
             Gurney Plaza                                                                                                    2021 as compared to the
                                                                           121,423
                                                                                                                             previous financial year

          East Coast Mall                                50,146
                                                         49,483

   Sungei Wang Plaza                         14,664
                                              20,094

3 Damansara Property                          18,876
                                                 29,299

                                                                                                     FY 2021 Actual
                   The Mines                      36,000
                                                   41,100                                            FY 2020 Actual

                                       0        40,000       80,000   120,000    160,000
                                                                                    RM’000 200,000   240,000     280,000

C a p i t a L a n d Ma l a ys i a Tr u s t                                                                                                   4Q 2021 Results Update   27
FY 2021 Property Operating Expenses
DYNAMIC STRATEGY
UNRELENTING FOCUS
Lower property operating
120,969 expenses y-o-y due to:
Portfolio
127,898
• Lower utility expenses due to
lower consumption throughout
39,133 the various lockdowns and 10%
Gurney Plaza electricity discount received for
40,793
the 12-month period
17,392 • Lower marketing expenses due
East Coast Mall to lesser mall activities and cost
19,464
containment effort
Sungei Wang Plaza 22,281
22,502
3 Damansara Property 19,945
21,010
22,218 FY 2021 Actual
The Mines
24,129 FY 2020 Actual
RM’000
C a p i t a L a n d Ma l a ys i a Tr u s t 4Q 2021 Results Update 28FY 2021 Net Property Income
Portfolio 103,138
133,501
Gurney Plaza 65,288
80,630
East Coast Mall 32,754
30,019
Sungei Wang -7,617
Plaza -2,408
3 Damansara -1,069
Property 8,289
13,782 FY 2021 Actual
The Mines
16,971 FY 2020 Actual
-40,000 0 40,000 80,000
RM’000 120,000 160,000
C a p i t a L a n d Ma l a ys i a Tr u s t 4Q 2021 Results Update 29Shopper and Vehicular Traffic
• Shopper traffic was 16.9% lower y-o-y
• Vehicular traffic was 17.7% lower y-o-y
Shopper Traffic ('000) Vehicular Traffic ('000)
35,000
32,440 6,000
5,434
30,000
26,970 5,000
4,473
25,000
4,000
20,000
3,000
15,000
2,000
10,000
5,000 1,000
0
0
FY'20 FY'21
FY'20 FY'21
C a p i t a L a n d Ma l a ys i a Tr u s t 4Q 2021 Results Presentation 30Occupancy Rate
As at As at As at As at
Property
31 Dec 2021 30 Sep 2021 30 Jun 2021 31 Mar 2021
Gurney Plaza 96.3% 94.4% 95.0% 96.3%
East Coast Mall 97.5% 96.7% 97.1% 96.9%
Sungei Wang Plaza 66.4% 61.0% 66.1% 62.3%
3 Damansara 73.1% 74.4% 78.4% 82.2%
The Mines 76.2% 76.6% 78.1% 82.5%
Retail 83.7% 82.6% 84.5% 86.1%
3 Damansara Office Tower 47.0% 52.7% 65.9% 57.4%
CLMT Portfolio 82.5% 81.6% 83.9% 85.1%
Notes:
Based on committed leases.
C a p i t a L a n d Ma l a ys i a Tr u s t 4Q 2021 Results Presentation 31Portfolio Lease Expiry Profile for 2022
No of % of Net % of Gross
As at 31 December 2021
Leases1 Lettable Area1 Rental Income1
Gurney Plaza 169 20.9% 22.3%
East Coast Mall 90 7.8% 8.6%
Sungei Wang Plaza 119 9.3% 4.3%
3 Damansara 63 3.3% 3.1%
The Mines 179 16.9% 10.0%
Retail 620 58.2% 48.3%
3 Damansara Office Tower 1 0.7% 0.5%
CLMT Portfolio 621 58.9% 48.8%
Notes:
Based on committed leases for portfolio (Retail + Office) as at 31 December 2021.
C a p i t a L a n d Ma l a ys i a Tr u s t 4Q 2021 Results Presentation 32Thank You
Ms Jasmine Loo (Investor Relations) http://www.clmt.com.my CapitaLand Malaysia REIT Management Sdn. Bhd.
(formerly known as CapitaLand Malaysia Mall REIT Management Sdn. Bhd.)
jasmine.loo@capitaland.com +603 2279 9888
Unit No. 1-27, Level 27, Naza Tower
+603 2279 9889
No. 10, Persiaran KLCC, 50088, Kuala LumpurYou can also read