3D Reconstruction Method of Rapeseed Plants in the Whole Growth Period Using RGB-D Camera
←
→
Page content transcription
If your browser does not render page correctly, please read the page content below

Preprints (www.preprints.org) | NOT PEER-REVIEWED | Posted: 20 May 2021 doi:10.20944/preprints202105.0468.v1

 3D Reconstruction Method of Rapeseed Plants in
 the Whole Growth Period Using RGB-D Camera
 Teng Xiaowen1,2, Zhou Guangsheng3, Wu Yuxuan1,2, Huang Chenglong1,2, Dong Wanjing12,
 Xu Shengyong1,2,*

 1. College of Engineering, Huazhong Agricultural University, Wuhan 430070,
 china;
 2. Key Laboratory of Agricultural Equipment for the Middle and Lower Reaches
 of the Yangtze River, Ministry of Agriculture, Wuhan 430070, china;
 3. College of Plant Science & Technology, Huazhong Agricultural University,
 Wuhan, 430070, China;
 * Correspondence: Xu Shengyong, xsy@mail.hzau.edu.cn, Tel: +8613476293548

 Abstract: The 3D reconstruction method using RGB-D camera has a
 good balance in hardware cost, point cloud quality and automation.
 However, due to the limitation of inherent structure and imaging
 principle, the acquired point cloud has problems such as a lot of noise
 and difficult registration. This paper proposes a three-dimensional
 reconstruction method using Azure Kinect to solve these inherent
 problems. Shoot color map, depth map and near-infrared image of the
 target from six perspectives by Azure Kinect sensor. Multiply the 8-bit
 infrared image binarization with the general RGB-D image alignment
 result provided by Microsoft to remove ghost images and most of the
 background noise. In order to filter the floating point and outlier noise
 of the point cloud, a neighborhood maximum filtering method is
 proposed to filter out the abrupt points in the depth map. The floating
 points in the point cloud are removed before generating the point cloud,
 and then using the through filter filters out outlier noise. Aiming at the
 shortcomings of the classic ICP algorithm, an improved method is
 proposed. By continuously reducing the size of the down-sampling grid
 and the distance threshold between the corresponding points, the point
 clouds of each view are continuously registered three times, until get the
 complete color point cloud. A large number of experimental results on
 rape plants show that the point cloud accuracy obtained by this method
 is 0.739mm, a complete scan time is 338.4 seconds, and the color
 reduction is high. Compared with a laser scanner, the proposed method
 has considerable reconstruction accuracy and a significantly ahead of the
 reconstruction speed, but the hardware cost is much lower and it is easy
 to automate the scanning system. This research shows a low-cost, high-
 precision 3D reconstruction technology, which has the potential to be
 widely used for non-destructive measurement of crop phenotype.

 © 2021 by the author(s). Distributed under a Creative Commons CC BY license.
Preprints (www.preprints.org) | NOT PEER-REVIEWED | Posted: 20 May 2021 doi:10.20944/preprints202105.0468.v1

 Keywords: 3D reconstruction; ICP; Azure Kinect; RGB-D image
 processing; point cloud filtering; rapeseed

 1. Introduction
 Traditional measurement of agronomic traits adopts manual
 methods, which has disadvantages such as low efficiency, strong
 subjectivity, poor repeatability, damage to plants, and
 incomplete measurement , etc. Computer vision technology can
 analyze complete phenotype parameters such as plant structure,
 shape, color and texture t one time, making it possible to
 quantitatively study the growth laws of crops. Three-
 dimensional reconstruction is an important type of computer
 vision technology. It performs digital modeling of crops in a
 computer, stores the three-dimensional geometry and color of
 plant shapes and organs in the computer to achieve rapid, low-
 cost, fast agronomic traits of crops and accurate non-destructive
 measurement[1]. 3D reconstruction technologies which are
 currently used in agriculture mainly include laser scanners,
 binocular vision, motion recovery structures and RGB-D cameras,
 etc.
 (1)Three-dimensional laser scanner. It is a high-precisio
 n point cloud acquisition instrument. For example, Katrine
 et al. used a laser scanner to measure the daily growth ch
 anges of 10 genotype of Brassica naps, explored how differ
 ent stresses affect plant phenotype, and better understood t
 he interaction between plant responses and energetic regula
 tion[2]. Ana et al. used terrestrial laser scanner (TLS) and m
 obile scanning system (MMS) to obtain the point cloud of t
 he vine trunk and calculated the volume of the vine trunk
 through a grape-shaped artificial object (VSAO) calibration
 method, and proposed a skeleton based on internal measur
 ement. The algorithm of modeling a cylinder with a certain
 height and diameter effectively solved the problem of volu
 me estimation[3]. Zhang et al. used the airborne lidar syste
 m to obtain the three-dimensional point cloud of forest tree
 s, and extracted the ground and building point clouds thro
 ugh the irregular triangulation method and plane fitting filt
 ering algorithm, which provided a basis for high-precision
 quantitative estimation of forest canopy biomass[4]. Su et al.
 used laser scanners to collect lidar data at six growth stage
 s of 20 maize varieties under drought stress, and calculated
 three drought-related phenotypic data such as plant height,
 plant area index and predicted leaf area, in order to ident
 ify the effects of drought stress. The effect of the phenotyp
Preprints (www.preprints.org) | NOT PEER-REVIEWED | Posted: 20 May 2021 doi:10.20944/preprints202105.0468.v1

 e in each growth stage provides a reference [5]. Indu et al. u
 sed ground lidar to track a cylinder along a single branch
 layer by layer to achieve three-dimensional reconstruction o
 f a single tree, and used super-body clustering method and
 multiple regression technology to achieve automatic calcula
 tion of tree parameters such as leaf area[6].
 (2)The structural method of exercise recovery (SFM). It is a
 technology that can automatically recover camera parameters
 and the three-dimensional structure of the scene from multiple
 image sequences. Wei et al. proposed a high-throughput wheat
 phenotype measurement method based on volume
 reconstruction and estimated the fresh weight of wheat. This
 method has greatly improved in plant reconstruction, model
 processing and feature extraction[7]. Zhang et al. collected
 multiple multi-spectral images of four-leaf-age rapeseed and
 obtained the three-dimensional point cloud of rapeseed through
 the motion restoration structure algorithm. After denosing the
 point cloud, the control points and control length were evaluated
 to study plant nutrition and pest stress. The spatial distribution
 is of great significance[8]. Liang et al. rebuilt outdoor maize plants
 using the motion recovery structure, and used straight-through
 filtering, cylindrical fitting and conditional European clustering
 algorithm to automatically measure 11 trait parameters such as
 plant height, providing a new phenotype outdoor measurement
 method[9]. Hu et al. used the Hausdorff distance to measure plant
 phenotypic parameters (leaf length, width and leaf area) on the
 three-dimensional reconstruction model of the plant obtained
 from the sequence image. The evaluation results show that the
 method has high accuracy and can be used in plant phenotypes
 and other correlations research fields[10].
 (3)Binocular vision method. It generates parallax through
 different viewing angles of two cameras, and then obtains the
 distance information of the object through depth calculation.
 Xiong et al. used binocular stereo cameras to build a semi-
 automatic image analysis system to automatically extract
 multiple leaf shape traits in rape images, and used these traits to
 classify rape leaf rows, which have guided significance for rape
 phenotype and breeding[11]. Rose et al. used a multi-view stereo
 method to reconstruct tomato plants, and used two
 complementary perspectives to reconstruct the plant as a whole.
 There are still triangulation errors at the leaf and branch
 boundaries, but the reconstruction method as a whole is
 adaptable and saves space[12]. Xiong et al. used two CCD cameras
 to obtain images of dynamic litchi clusters, calculated the
Preprints (www.preprints.org) | NOT PEER-REVIEWED | Posted: 20 May 2021 doi:10.20944/preprints202105.0468.v1

 centroid of the smallest bounding rectangle of litchi fruits, and
 calculated the swing angles of litchi fruits under three
 disturbance states using the principle of pendulum, which solved
 the visual positioning problem of picking robots in the natural
 environment [13].
 (4)RGB-D camera method. The RGB-D camera adds depth
 measurement to the function of the RGB ordinary camera. The
 mainstream solutions include structured light and TOF (time of
 flight). It has simple operation, low cost and high efficiency, it
 always has great potential in the field of 3D reconstruction. Hu et
 al. proposed a Kinect-based automatic measurement system for
 leafy vegetable crops, which reconstructed plant point clouds
 from multiple perspectives, and simultaneously measured key
 growth parameters such as relative height and absolute height,
 projected area and volume, and the obtained data are all
 expressed a good degree of fit (R2= 0.9457-0.9914)[14]. Xu et al.
 used the Kinect V2 to take color images and depth images of rape
 branches under four viewing angles, and performed image
 preprocessing, point cloud registration and point cloud filtering
 to obtain the color point cloud of rape branches, and then used
 European clustering to identify the angle the phenotypic
 parameters of siliques were measured and the overall accuracy
 was better[15]. Xu et al. proposed a three-dimensional scanning
 reconstruction system with multiple RGB-D Cameras (Xtion
 sensors). The initial pose of the camera was obtained through a
 pre-calibrated image acquisition platform. The reconstruction
 system can obtain high-precision three-dimensional models of
 various complex large scenes[16]. Martin et al. used Kinect V2 to
 collect images of field corn plants, and measured plant height
 after three-dimensional reconstruction. The measurement
 accuracy exceeded the measurement results of three-dimensional
 laser scanners[17]. Manuel et al. used high-resolution three-
 dimensional images, used ICP registration algorithm for
 registration, and used random sampling consensus algorithm to
 remove the incoming soil point cloud. By comparing the true
 seedling position on the ground, it was shown that the method
 obtained the location of the corn is close to the ground
 distribution[18]. Feng et al. built a soybean canopy image
 acquisition platform using Kinect V2, reconstructed the soybean
 canopy structure in three dimensions, and proposed a method
 for calculating soybean plant height parameters based on depth
 information. This method can accurately calculate soybean to
 plant height characteristics[19]. Liu et al. proposed a three-
 dimensional reconstruction algorithm based on depth
Preprints (www.preprints.org) | NOT PEER-REVIEWED | Posted: 20 May 2021 doi:10.20944/preprints202105.0468.v1

 information segmentation and clustering of strawberry canopy
 morphology. The color image and intensity image were
 registered to reconstruct the strawberry canopy structure
 morphology with color information[20]. Yu et al. placed Kinect V2
 on the cart, took the depth image directly above the cotton crop
 in the field, calculated the plant height in the stitched depth
 image, and realized the non-destructive and rapid measurement
 of the cotton plant height in the field[21]. Efi et al. proposed a sweet
 pepper detection algorithm that combines adaptive threshold
 segmentation and sensors. The image was divided into
 rectangular sub-images with approximately uniform lighting
 conditions, and the RGB image was converted into a 3D natural
 difference index image. Threshold adaptive calculation and
 application, the algorithm was robust to the selected threshold
 and the noise from the camera itself[22].
 In summary, the point cloud obtained by the laser scanner
 method has the highest accuracy, but it is expensive,
 cumbersome to operate, and time-consuming, making it difficult
 to realize an automated system. The SFM method has higher
 accuracy and the lowest cost, but high-precision three-
 dimensional reconstruction requires a large number of images,
 which leads to the most serious consumption of computing
 resources[23]. Binocular vision has the fastest reconstruction speed
 and is easy to automate, but its high-precision point cloud
 requires extremely high-performance image sensors and a stable
 imaging environment. In contrast, the RGB-D camera
 represented by Kinect is more balanced in three aspects: point
 cloud accuracy, processing speed and automatability. At the
 same time, this method has the highest requirements for image
 processing algorithms, mainly due to two factors. The first one
 requires a registration algorithm to unify the point clouds from
 different coordinate systems into the same coordinate system[24].
 Zheng et al. used the Kinect V2 camera to obtain the original
 point cloud of fruit trees under different viewing angles,
 searched for the key points of the point cloud through the
 normalized alignment radial feature algorithm, and then used
 the feature histogram descriptor to calculate the feature vector of
 the key point, and estimated the spatial mapping relationship
 between the two point clouds according to the feature vector, the
 point cloud is initially registered based on the random sampling
 consensus algorithm to refine the mapping relationship, and the
 nearest point iterative algorithm is used to complete the fine
 registration, which effectively improves the accuracy and
 stability of the point cloud registration[25]. Sun et al. proposed a
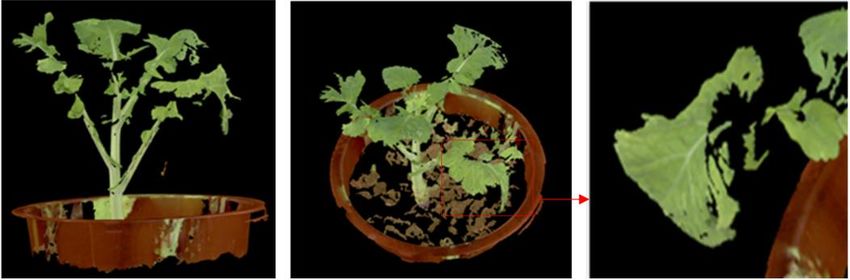
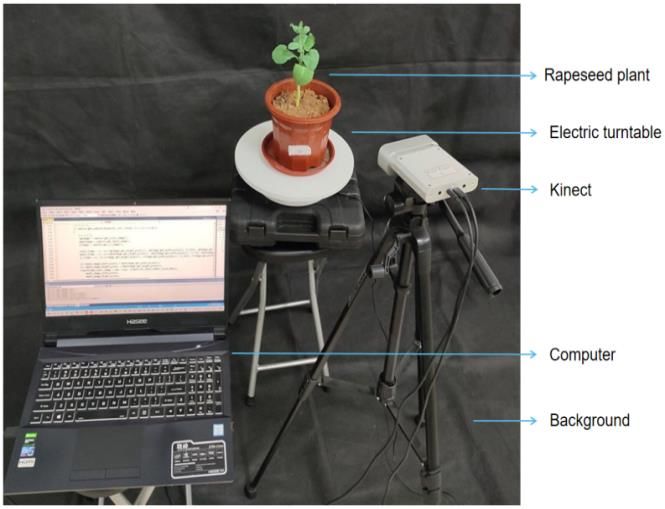
Preprints (www.preprints.org) | NOT PEER-REVIEWED | Posted: 20 May 2021 doi:10.20944/preprints202105.0468.v1

 Kinect V2-based high-throughput greenhouse plant point cloud
 reconstruction algorithm. Two RGB-D images on the turntable
 were collected to calculate the center point and a normal vector
 of the turntable rotation axis, and the point clouds from different
 perspectives were rotated according to the center. Coarse
 registration, using the iterative nearest point algorithm to
 accurately register the multi-view point cloud, to achieve rapid
 reconstruction of the three-dimensional point cloud of
 greenhouse plants [26] . Secondly, the point cloud data obtained by
 the RGBD-D sensor are rough, and the point cloud of outliers and
 floating points is serious[27]. Ma et al. used Kinect V2 to obtain the
 rape point cloud, and used a minimum bounding box (MOBB)
 combined with a through filter to remove background noise.
 Other outliers and floating point noise were removed based on
 the normals of the viewpoint and the surface. This method can
 effectively remove outliers and improve the quality of point
 clouds[28].
 Aiming at the needs of multi-scale, non-destructive, high-
 throughput and high-precision measurement of rape phenotypic
 traits, this paper proposes a three-dimensional reconstruction
 method using Azure Kinect. This method collects color maps,
 depth maps and infrared maps from 6 viewing angles, improves
 the color map-depth map alignment method provided by
 Microsoft to remove ghost images, and proposes a neighborhood
 maximum filter method to filter out floating points in the depth
 map, and then use the improved ICP registration algorithm[29] to
 fuse the local point cloud into a complete point cloud, and finally
 realize the accurate three-dimensional color modeling of a single
 rapeseed during the whole growth period. The three-
 dimensional reconstruction method has low cost, high accuracy,
 fast speed and easy automation. It will provide important basic
 data for the non-destructive measurement of rape phenotype,
 growth law research, selection and breeding, and design of
 agricultural machinery, etc., also can be popularized and applied
 to other crops.

 2. Materials and Methods

 2.1. Experimental Setup and Data Acquisition
 In 2019 and 2020, rapeseed was planted at Huazhong
 Agricultural University for two consecutive years, with varieties
 Zhongshuang 6 and Dadi 55. Rape plants are used in flower pots.
 The image acquisition device is mainly composed of Azure
 Kinect sensor, electric turntable, black screen and computer. As
 shown in Figure 1(a), place the potted plant in the center of the
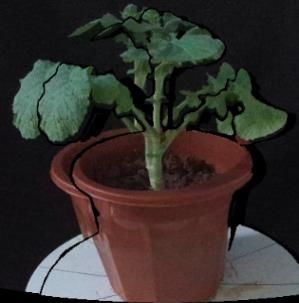
Preprints (www.preprints.org) | NOT PEER-REVIEWED | Posted: 20 May 2021 doi:10.20944/preprints202105.0468.v1

 turntable, and place a black background cloth behind it. The
 Azure Kinect is aimed at the plant and forms an angle of about
 15 degrees with the horizontal, 0.3m~0.5m away from the plant.
 The image acquisition method is shown in Figure 1(b). The
 turntable is manually controlled to rotate 60° each time, and the
 computer controls the Azure Kinect to capture images. A total of
 six viewing angles are captured. The image acquisition is carried
 out indoors with natural light. The image was taken using Azure
 Kinect's 4096*3072 color maps, 1024*1024 depth maps and
 1024*1024 near-infrared maps. The vision system is developed
 and tested with a general-purpose computer. The configuration
 is Intel Core i5-9300H/8G/256GB/GTX1650 4G GDDR5. The
 operating system is Windows10 Professional. The required
 software is Microsoft Visual Studio 2017, OpenCV 3.2, PCL1.8.1.

 (a) (b)

 Figure 1. Rape plant image collection. (a)Image acquisition platform.(b)Collection diagrams.

 2.2. The complete color point cloud calculation method of rape moss
 Taking rapeseed at the first flowering stage as an example,
 Figure 2 shows the algorithm flow of this manuscript. The color,
 depth, and near-infrared images of the plant at 6 viewing angles
 are acquired. Perform operations such as color-depth image
 alignment and point cloud smoothing on the image of each view,
 and then convert it into a color point cloud of a single view. The
 6 color point clouds are merged into a complete point cloud by
 using the improved ICP iterative registration method, and the
 point cloud filtering is performed again, and finally a high-
 precision color point cloud is obtained.
Preprints (www.preprints.org) | NOT PEER-REVIEWED | Posted: 20 May 2021 doi:10.20944/preprints202105.0468.v1

 Figure 2. The program flows chart of this manuscript

 2.2.1. Alignment of single-view RGB image and D image
 RGB-D alignment is used to establish the index relationship
 of pixels in the color map and the depth map. Alignment is an
 important link for the point cloud to truly restore the color
 information. The SDK for Azure Kinect provided by Microsoft
 has an alignment function that can be used for alignment.
 However, there are ghosts in the results obtained by directly
 using this function to align, which requires optimization. We
 propose a mask method based on infrared binary image, which
 can get a good alignment effect. At the same time, this method
 removes the background in the depth map, which speeds up the
 conversion of a two-dimensional image into a three-dimensional
Preprints (www.preprints.org) | NOT PEER-REVIEWED | Posted: 20 May 2021 doi:10.20944/preprints202105.0468.v1

 point cloud, and reduces the workload of subsequent point cloud
 segmentation. The process is shown in Figure 3 and mainly
 includes:
 First step: Using the alignment function in the SDK maps the
 color map to the depth one, and obtain the initial alignment.
 Second step: reduce the near-infrared image from a 16-bit
 image to 8-bit image.
 Third step: Utilizing the high reflectivity of the organism in
 the near-infrared image, using the basic global threshold method
 completely segments the plant from the near-infrared image,
 which may contain a small amount of background.
 Fourth step: the binary image obtained in the third step is
 multiplied by the result obtained in the first step to obtain the
 corrected alignment result.

 16-bit infrared image 8-bit infrared image binary Image Original image Article image

 Figure 3. RGB image and D image alignment

 2.2.2. Single-view color point cloud acquisition
 (1) Floating point denoising based on the most value
 filtering of the depth map
 Dangling point is a kind of noise phenomenon that is
 ubiquitous in sensors based on TOF principle. The light source
 will be refracted when it hits the edge of the object, causing the
 receiver to not receive the signal normally, resulting in a floating
 point. The floating points will gradually accumulate during the
 multi-view registration process, have a significant effect on the
 reconstruction accuracy and computation speed. Therefore, this
 noise must be removed to improve the 3D reconstruction
 accuracy. We observe that the floating point have two distinctive
 features: First, it mainly occurs at the edge of the scanned object
 and the intersection of the front and back objects. Second, the
 floating point seriously deviates from its original position in
 space, which is reflected in the depth map as a sudden change in
 depth value. Using these two features, we propose a
 neighborhood extremum filtering method to smoothly filter the
 depth map to eliminate floating points. Including the following
 steps:
 First item; binarize the near-infrared image to get an image
Preprints (www.preprints.org) | NOT PEER-REVIEWED | Posted: 20 May 2021 doi:10.20944/preprints202105.0468.v1

 that only contains the plant area, retrieve all non-zero pixels, and
 get the pixel point set ( , ).
 Second item; the depth map and infrared map taken by
 Azure Kinect has the same resolution. Traverse the pixels ( , )
 with coordinates in the depth map, calculate the depth
 information ( , ) of a certain pixel ( , ) in the
 neighborhood with the chessboard distance ≤ N, and calculate
 the extreme value Zm (including the maximum value Zmax and the
 minimum value Zmin).
 Third item; calculate the value | ( , ) − | and
 compare it with the given threshold value . If any value
 | ( , ) − | is greater than , then we judge this point as a
 floating point and delete it.
 Fourth item; repeat the above operations until the entire
 depth map is traversed, and all floating points are eliminated.
 Through comparative experiments, it is found that when N
 is 3 and 5, the effect of removing suspended points is the best.
 Different from the traditional point cloud denoising method, this
 method is performed before the point cloud conversion.
 Compared with traditional methods such as straight-through
 filtering, radius filtering and statistical filtering, the speed and
 accuracy of denoising are greatly improved. However, this
 method will remove some non-floating points, causing damage
 to the point cloud accuracy, but the subsequent multi-view point
 cloud registration will repair this loss.
 (2) The image is converted to a color point cloud
 The Azure Kinect sensor has system noise and fluctuation
 when it is working, which causes the data of each depth image to
 be different(which causes differences between each depth image
 data. Continuously shoot 3 frames of depth images and take the
 average value to effectively eliminate fluctuations and noise. For
 the depth map without floating points, the function provided by
 the Microsoft SDK is used to directly convert the depth map into
 a point cloud. Then add the color index information of the
 improved color-depth alignment result to the point cloud to
 obtain a color 3D point cloud. The conversion formula is shown
 in formula (1).
 1
 = ( ′ − ) × ℎ( ′ , ′ ) ×

 1
 = ( ′ − ) × ℎ( ′ , ′ ) × (1)

 { = ℎ( , )/1000
 ′ ′

 in which, ( ′ , ′ ) are the image coordinate of a pixel in depth

 image, depth (x ′ , y ′ ) are pixel value of the (x ′ ,y ′ ), (Xd ,Yd , Zd ) are
Preprints (www.preprints.org) | NOT PEER-REVIEWED | Posted: 20 May 2021 doi:10.20944/preprints202105.0468.v1
coordinate of 3D space, ( , ) are the focus length of the NIR
camera.
(3) Single-view point cloud filtering
The point cloud obtained by the Azure Kinect camera
contains many noise points. There were three types of noise in
the point cloud: the background noise (BN), which consisted of
non target points away from the targets; the flying pixel noise
(FPN) from the boundaries of two objects, and the outliner noise
(ON) , which consisted of scattered points, mostly around the
targets, caused by the sensors[16]. The background point cloud has
been well filtered out in 2.2.1. Suspended spots can be well
removed by the method of 2.2.2 (1). The viewpoint feature and
normal feature of the point cloud were used to remove the noise
based on the spatial topological relationship established by the k-
dimensional (kd) tree. The spatial topological relationship was
used for searching neighboring points. Statistical filter the point
removal effect is general, mainly because the setting of the
threshold parameter of the statistical filter is not easy to
determine, the robustness is poor, and it is difficult to find a
parameter that has a good effect on the two noise point clouds.
3. 3D point cloud registration
By registering and fusing point clouds from multiple angles
into a whole, the complete 3D shape of the rape plant can be
obtained, and the local information loss caused by the point
cloud denoising operation can be repaired at the same time. The
morphology and structure of rapeseed plants are complex, and
the classic ICP algorithm is directly used for point cloud
registration, which requires a large amount of calculation, time-
consuming, high error matching rate, and may fall into a local
minimum. This paper proposes an improved method based on
the classic ICP algorithm. By continuously reducing the distance
threshold between corresponding points and the size of the grid
during down sampling, the point clouds of the two perspectives
are gradually merged into a high-precision point cloud.
Repeatedly using this method for multiple viewing angles, a
complete point cloud of a rape plant can be obtained.
3.1. Registration Optimization Based on ICP Method
(1) Point cloud registration from two perspectives
In the ICP algorithm, it is assumed that there are Np and Nq
points in the point cloud data P and X, which can be represented
by point sets{ }and{ }. The ICP algorithm finds the two closest
points in the point set and minimizes the sum of the squares ofPreprints (www.preprints.org) | NOT PEER-REVIEWED | Posted: 20 May 2021 doi:10.20944/preprints202105.0468.v1
the Euclidean distance, as showed in formula (2).
1
( ) = ∑
=1‖ − ( ) − ‖ (2)
In order to minimize ( ), the center of gravity of the point
cloud P and the point cloud X are calculated separately, as in
formula (3).
1
μ = ∑ =1
{ 1
(3)
μ = ∑
=1
Use the center of gravity to obtain the cross-covariance
matrix of the two point clouds, as in formula (4).
1 1
Σ = ∑ =1 [( − μ )( − μ ) ] = ∑ =1 [ ] − μ μ (4)
Construct = (∑ − ∑ ) from the antisymmetric
matrix of Σ , construct Δ = [ 23 31 12 ], and then obtain the
formula (5) (4 × 4) symmetric matrix, I 3 (3 × 3) constant
matrix:
(Σ ) Δ
(Σ ) = [ ] (5)
Δ Σ + Σ − (Σ ) 3
Use the unit quaternion tree to represent the optimal
rotation vector = [ 0 1 2 3 ], which corresponds to the
maximum eigenvalue of the matrix (Σ ). The rotation matrix
can be calculated by formula (6) and :
=
02
+ 12 − 22 − 32 2( 1 2 − 0 3 ) 2( 1 3 + 0 2 )
[ 2( 1 2 − 0 3 ) 02
− 12 + 22 − 32 2( 2 3 − 0 1 ) ] (6)
2( 1 3 − 0 2 ) 2( 2 3 + 0 1 ) 02 − 12 − 22 + 32
From equation (7), the point cloud transformation matrix is
iterated repeatedly until the sum of squares of the Euclidean
distance of the nearest point pair converges under a given
threshold.
= μ − ( )μ (7)
Based on the classic ICP algorithm, this paper proposes an
improved method, as shown in Figure 4 (a), the process is as
follows:
The first step: construct an effective initial point set
participating in the ICP algorithm. Knowing the rotation angles
of two adjacent viewing angles, the point cloud of one of the
viewing angles can be multiplied by a rotation matrix to make
the point cloud of this angle rotate around the Y axis to obtain a
new point cloud, and then perform registration. Such as formula
(8).Preprints (www.preprints.org) | NOT PEER-REVIEWED | Posted: 20 May 2021 doi:10.20944/preprints202105.0468.v1 cos 0 sin PR = 0 1 0 P − sin 0 cos (8) This processing makes the point clouds of two adjacent angles similar in azimuth, which can effectively speed up the registration speed and success rate. In this manuscript, 6 uniform viewing angles are used. So θ is 60 degrees. Calculate the error measure ( ) at this time. The second step: down-sample the point cloud to create a three-dimensional voxel grid, and use the center of gravity of the voxel grid to approximately replace all points for subsequent calculations. This can effectively improve the registration speed. The third step: calculate the surface normal vector and curvature of the point cloud, and search for points with similar curvatures to form a pair of points. On this basis, KD-tree is used to establish a high-dimensional index tree data structure, which accelerates the matching process of the corresponding points of the two point clouds. In the fourth step: the distance threshold is used as an initial parameter to determine the search range of the registration process. Set to ( )/10, start classic ICP registration. The fifth step: calculate a new error measure ′ ( ), If ′ ( ) is greater than the set registration error threshold, set to ( )/20, and reduce the voxel grid size by 1/2 to release more points to participate in the registration. Perform classic ICP registration again. Finally, keep unchanged, reduce the voxel grid 1/2 again, and perform the last classic ICP registration. (2) Point cloud registration from all perspectives In this manuscript, six perspective images of rapeseed plants were taken. The point cloud registration process for all perspectives is shown in Figure 4(b). Name the point cloud of the first angle of view "Cloud 1", and name the point clouds of the other 5 angles of view separated by about 60° as "Cloud 2", "Cloud 3", "Cloud 4", "Cloud 5", "Cloud 6". First, perform the improved ICP registration method on the 6-angle point clouds in sequence to obtain three new point clouds. For the point cloud 7 and the point cloud 8 rotated by 120 degrees, the point cloud 10 is obtained using an improved ICP registration method. For the new point cloud 10 and the new point cloud 9 rotated by 240 degrees, the improved ICP registration method is used to obtain the final completion point cloud.
Preprints (www.preprints.org) | NOT PEER-REVIEWED | Posted: 20 May 2021 doi:10.20944/preprints202105.0468.v1

 (a) (b)
 Figure 4. Flow chart of the point cloud registration. (a)Improved ICP registration algorithm.
 (b)Point cloud registration

 4. Results and analysis
 The experiments were carried out on raw data obtained
 from 40 pots of rapeseed, in which 10 pots in each growth period.
 For each pot of plant, 6 frames of data from different views,
 which cover 360° and these data were processed by the proposed
 method to show the performance and robustness of the proposed
 method.

 4.1. RGB-D image alignment test
 Figure 5 shows the processing results of a set of rape moss
 images. Figure (a) is the result of using the official SDK to align
 the flowering rapeseed and converting it into a point cloud and
 through filtering to eliminate the background. Figure (b) is the
 alignment result and point cloud obtained by the proposed
 method. The alignment results and the point cloud in the
 comparison images (a) and (b) have no ghosting. Figures (c) and
 (d) are the same type of test results of rape moss. We can find that
 for rape plants of different growth periods, the suggested
 methods can remove the ghost images in the alignment map, and
 also remove the noise of the point cloud.
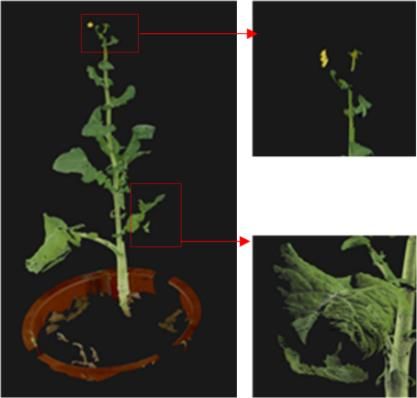
Preprints (www.preprints.org) | NOT PEER-REVIEWED | Posted: 20 May 2021 doi:10.20944/preprints202105.0468.v1

 (a) (b)

 (c) (d)
 Figure 5. Color aligned image ghosting and color point clouds. (a) The alignment and point cloud of the
 official SDK. (b) This manuscript aligns the results with the point cloud. (c) and (d) are the results of the
 same type of test for rape

 4.2. Point-Cloud Noise Removal
 We tested and compared two filtering methods: the
 traditional method of through filtering + statistical filtering, as
 shown in Figure 6 (a); the recommended method of
 neighborhood maximum filtering + through filtering, as shown
 in Figure 6 (b). The point cloud directly converted from the depth
 map has about 770000 data points, most of which are non-target
 noise points. This part of the noise point cloud is far away from
 the target crop and can be easily removed from the through filter.
 It can be seen from Figure 6 that the through filtering can well
 remove the noise point cloud in a large area such as the
 background. Comparing the filtering effect identified by the red
 dashed box, both methods can well remove the floating points
 with obvious characteristics. However, at the position marked by
 the yellow dashed frame, which is the floating point caused by
 the overlap of the leaves, the filtering effect of statistical filtering
 is almost invisible, and the method in this paper has achieved
 remarkable results.
Preprints (www.preprints.org) | NOT PEER-REVIEWED | Posted: 20 May 2021 doi:10.20944/preprints202105.0468.v1

 (a) (b )
 Figure 6. Comparison of two filtering effects.(a)Through filtering + statistical filtering.
 (b) Neighborhood maximum filtering + through filtering
 As shown in Table 1, we tested 10 sets of point clouds and
 counted the number of filtered point clouds, NRR (Noise
 reduction ratio), and time-consuming. In the calculation of NRR,
 the point cloud of manually segmented background is used as
 the number of effective point clouds. Table 1 compares the
 performance of the two filtering methods. Compared with the
 traditional method, the suggested method is about 2200 points
 less than the traditional method in terms of the number of point
 clouds, which are 76.5% of the traditional method. The average
 NRR of the proposed method is 0.269% higher than that of the
 traditional method, and the SD values of the two are equal. This
 is reflected in the filtering effect, and the proposed method is
 more thorough in filtering noise. There is a significant difference
 between the two in terms of time-consuming, and the traditional
 method is 11.2 times than that of the suggested method. The
 method in this paper benefits from the noise filtering before the
 point cloud conversion. The two-dimensional image processing
 saves a lot of time than the three-dimensional point cloud
 processing, which reflects the time-consuming. In addition, the
 speed of through filtering depends on the number of point clouds.
 The number of point clouds involved in through filtering in this
 method is significantly less than that of traditional methods,
 which in turn promotes further reduction in time-consuming. In
 general, the method in this paper can eliminate point cloud noise
 very well, and has significant advantages in terms of time-
 consuming.
Preprints (www.preprints.org) | NOT PEER-REVIEWED | Posted: 20 May 2021 doi:10.20944/preprints202105.0468.v1

 Table 1. Comparison of the traditional point cloud denoising algorithm and the present algorithm
 Number Number Traditional denoising The algorithm in this
 of algorithm manuscript
 original Number NRR% time Number NRR% time
 clouds of consuming of consuming
 clouds clouds
 1 786917 9519 98.79 176 7011 99.11 19
 2 787120 8838 98.82 166 6312 99.2 14
 3 786705 7689 99.02 167 5942 99.24 14
 4 787176 9172 98.83 169 6648 99.16 14
 5 788505 10372 98.68 170 8221 98.78 16
 6 786824 12193 98.45 172 8785 98.88 16
 7 761393 8756 98.85 169 7213 99.05 16
 8 759925 9216 98.79 169 6652 99.12 14
 9 756102 10054 98.67 170 7587 99 14
 10 757984 8745 98.85 172 8035 98.9 15
 Average 775865 9455.4 98.775 170 7240.6 99.044 15.2
 SD \ \ \ 0.15 \ \ 0.15
 Note: NRR means noise reduction ratio, NRR=(1-number of point clouds after denoising/number of
 original point clouds)*100%, SD means standard deviation.
 The neighborhood optimal filtering method needs to set an
 appropriate neighborhood size and threshold. The size of the
 neighborhood is too small to judge the sudden change of the
 depth information, which leads to the deletion of too many valid
 points. However, too many points will participate in the
 judgment if the setting is too large, so that the deep mutation
 information is inaccurate and the mutation point cannot be found.
 Through the statistics of the gentle point cloud of a certain part
 of rape, it is found that the maximum depth difference in the local
 neighborhood is not obvious, and the difference is basically 5
 points. This paper compares the size of different neighborhoods
 and the size of the threshold to eliminate the effect of floating
 point noise, and selects the final parameters. Figure 7 shows the
 filtering results of different parameters, the neighborhood sizes
 are 3*3, 5*5, and 7*7, and the thresholds range from 3, 5 to 7.
 Through comparison, it is found that when the neighborhood
 size is 3*3 and the threshold is 5. The effect of removing the noise
 point cloud is the best.
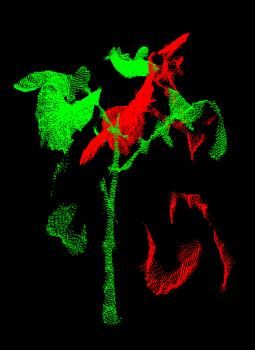
Preprints (www.preprints.org) | NOT PEER-REVIEWED | Posted: 20 May 2021 doi:10.20944/preprints202105.0468.v1

 3 5 7

 3*3

 5*5

 7*7

 Figure 7. Comparison of the effect of different thresholds of the maximum filter

 4.3. Point cloud registration experiment
 We tested and compared the performance of the classic ICP
 method and the method in this paper for the two-view point
 cloud registration, which is shown in Figure 8 and Table 3. For
 any rape plant, the method in this paper undergoes 3 iterations
 of registration, and finally merges into a point cloud precisely.
 Figure 8 clearly shows the gradual fusion of the two point clouds.
 In Figure 8(b), the registration effect of the classic ICP method is
 much worse, and the point clouds of rape seedlings are not well
 integrated. For two point clouds with large differences in angles,
 the registration may even fail, as shown in Figure 8(d). Figures (c)
 and (d) are the same type of test results of rape seedlings. Table 3
 compares the registration success rate and time-consuming of the
 two methods. 10 sets of test results show that the success rate of
 traditional ICP registration is 30%, and the success rate of this
 method is 100%. The average time consumption of the traditional
 ICP method is 211.5s. Although the method in this paper includes
 3 ICP registrations, the average time consumption is 68.1s, which
 is only 32.2% of the traditional ICP method. The substantial
 increase in registration efficiency is mainly attributed to the
Preprints (www.preprints.org) | NOT PEER-REVIEWED | Posted: 20 May 2021 doi:10.20944/preprints202105.0468.v1

 optimization measures taken. The rotation processing of the
 original point cloud greatly shortens the effective point cloud
 distance of the two point clouds, which significantly reduces the
 probability of falling into a local optimal solution, improves the
 registration success rate, and also increases the registration speed.
 The octree search method improves the search speed. Multiple
 iterations of registration make the process of fusion of the two
 point clouds keep improving, and finally achieve a more perfect
 fusion. In general, compared with the traditional ICP registration
 algorithm, the registration algorithm in this paper has a
 significant improvement in registration performance, and can
 accurately reconstruct rape plants.

 (a) (b)

 (c) (d)
 Figure 8. The registration effect of the traditional ICP method and the method in this paper.
 (a)The registration method of this paper. (b)Traditional ICP registration. (c) and (d) another set of
 registration data
 Table 2. Comparison of registration performance between traditional ICP method and this method
 Number Traditional ICP The present method
 Total Successful First Second Third Total Successful
 time time time time time
 1 126 Y 6 8 40 54 Y
 2 390 N 11 12 110 133 Y
 3 341 N 10 16 85 111 Y
 4 208 N 7 7 63 77 Y
 5 127 Y 6 4 26 36 Y
 6 143 Y 8 4 26 38 Y
 7 178 N 7 4 33 44 Y
 8 214 N 10 8 42 60 Y
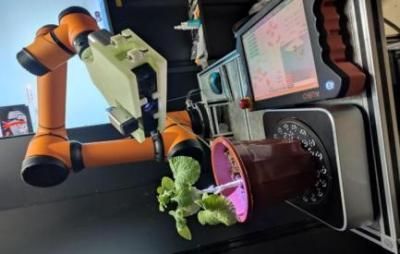
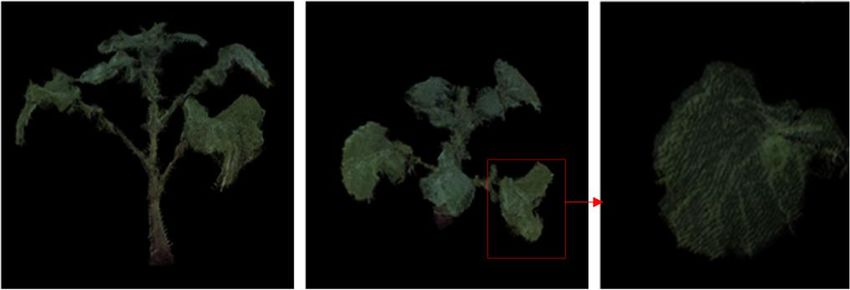
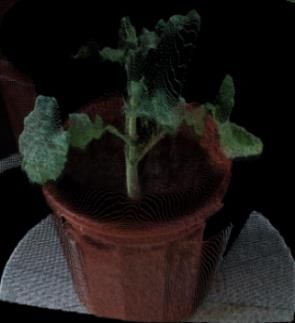
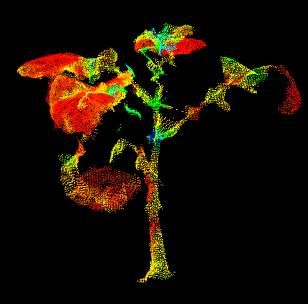
Preprints (www.preprints.org) | NOT PEER-REVIEWED | Posted: 20 May 2021 doi:10.20944/preprints202105.0468.v1

 9 234 N 8 6 57 71 Y
 10 154 N 12 7 38 57 Y
 Ave 211.5 30% 8.5 7.6 52 68.1 100%

 4.4. Complete 3D reconstruction experiment
 The point cloud obtained by the laser scanner is extremely
 accurate, and has become a benchmark reference for comparison
 experiments in 3D reconstruction. The laser scanner used in this
 manuscript is WibooxPSC-TAAJ011A15 produced by Xianlin 3D
 Technology Co., Ltd. The scanner and the color camera are fixed
 to the robot arm (model AUBO ROBOTS) together, and the data
 of 6 angles of view of the rape plant is taken for 3D reconstruction.
 The color 3D point cloud obtained is compared with the method
 in this paper. Figure 9(a) shows the working site and
 reconstruction results of the color laser scanner. As can be seen
 from the details marked in the figure, the overall reconstruction
 effect of the laser scanner is better, especially the continuous and
 smooth parts of the reconstruction quality are excellent. However,
 the effect is not good for the parts with sudden curvature changes
 such as leaves and stems, and the point cloud is prone to defects
 and holes. In the partial enlarged images, only a small part of the
 point cloud is recovered from rape blossoms, which are almost
 impossible to reconstruct. Figure 9(b) shows the reconstruction
 results of this method for the same rapeseed plant. In all parts of
 the rape plant, it can be rebuilt very well, with very few holes.
 Figures (c) and (d) are the contrast effects of rapeseed in the moss
 stage. It can be clearly observed that the leaves reconstructed by
 the three-dimensional scanner have a lot of authenticity, and the
 suggested method obtains a complete leaf point cloud. In general,
 the laser scanner can obtain more precise details, and the
 suggested method can obtain a more complete point cloud. At the
 same time, the method proposed in this manuscript is worse than
 the 3D laser scanner in terms of visual effects. This is mainly due
 to the weaker performance of the RGB camera used by Azure
 Kinect, which leads to insufficient color reproduction.
Preprints (www.preprints.org) | NOT PEER-REVIEWED | Posted: 20 May 2021 doi:10.20944/preprints202105.0468.v1

 (a) (b)

 (c)

 (d)
 Figure 9. Comparison of the 3D reconstruction effect between the laser scanner and the algorithm in this
 paper. (a) 3D reconstruction of laser scanner (flowering rape). (b) Three-dimensional reconstruction of
 the algorithm in this paper (flowering rape). (c) Reconstruction of point cloud by 3D laser scanner
 (Brassica napus in moss stage). (d) The algorithm in this paper reconstructs the color point cloud (Rape
 at moss stage)
 Table 3 compares the reconstruction accuracy and speed of
 the two methods. The reconstruction accuracy of the method in
 this paper is 0.739mm, and the 0.178mm of the laser scanner is
 sub-millimeter reconstruction accuracy. The average time of a
 complete 3D reconstruction of the method in this paper is 339.4
 seconds, while that of the laser scanner is 991.6 seconds. The
 former is 1/3 of the latter. If an automated image acquisition
 device is used, the scanning method of Azure Kinect will be faster.
 In general, the reconstruction accuracy of this method is close to
 that of a laser scanner, but the speed is 3 times faster. This is
 mainly due to the fact that the data collection speed of the laser
Preprints (www.preprints.org) | NOT PEER-REVIEWED | Posted: 20 May 2021 doi:10.20944/preprints202105.0468.v1

 scanner and the point cloud fusion speed is not as good as the
 Azure Kinect method. In terms of the 3D reconstruction
 technology required for phenotype, laser scanners are much
 more expensive and difficult to achieve full automation. The
 method in this paper is cheap and easy to achieve fully
 automated image acquisition.
 Table 3. Comparison of reconstruction performance between laser scanner and the algorithm in this
 paper
 Sample The time The accuracy of The time The accuracy of
 index consuming of our our algorithm consuming of laser scanner
 method (s) (mm) laser scanner (s) (mm)
 1 294 0.64 872 0.23
 2 342 0.59 1317 0.19
 3 354 0.68 1189 0.17
 4 327 0.66 987 0.14
 5 334 0.69 789 0.17
 6 327 0.77 874 0.15
 7 341 0.78 985 0.16
 8 364 0.83 976 0.17
 9 358 0.84 1054 0.19
 10 343 0.91 873 0.21
 Ave 338.4 0.739 991.6 0.178

 5. Conclusion
 For the application of Azure Kinect in the field of 3D
 reconstruction, this manuscript provides a process and met
 hod with universal significance. Targeted solutions are prop
 osed for several problems of RGB-D 3D reconstruction. Firs
 t, to solve the problem of poor color map-depth map align
 ment, a comprehensive processing method based on RGB-D
 -NIR images is proposed to eliminate ghosting in the offici
 al alignment results, making the color map accurate and gr
 eatly reducing the invalid background three-dimensional poi
 nt cloud, which improves the speed and accuracy of subse
 quent point cloud processing. Secondly, a neighborhood ma
 ximum filtering method is proposed to filter out the bright
 ness mutation points in the depth map, which effectively el
 iminates the floating points and outliers, and improves the
 quality of the point cloud. The third and most important is
 that an improved registration method based on ICP is pro
 posed. Through multiple iterations, the key parameters in t
 he registration are reduced, so that the point cloud is grad
 ually approached in space, and finally a high-precision poi
 nt cloud registration is realized. The method in this paper
Preprints (www.preprints.org) | NOT PEER-REVIEWED | Posted: 20 May 2021 doi:10.20944/preprints202105.0468.v1

 used the whole growing period of rapeseed plants to test.
 The overall effect is good, which is helpful to the advance
 ment and development of rapeseed phenotype nondestructi
 ve testing technology. It has also achieved good effects on
 crops such as fruit seedlings, corn, soybeans, and cotton. In
 general, the research results of this manuscript provide a
 useful example for RGB-D 3D reconstruction.
 Data Availability: The data used to support the findings of this
 study are available from the corresponding author upon request.
 Conflicts of Interest: The authors declare that they have no
 conflicts of interest.
 Acknowledgments: This work was supported by the National Key
 Research and Development Program of China (2018YFD1000904).
 REFERENCES
 1. Wu, D.; Guo, Z.; Ye, J.; Feng, H.; Liu, J.; Chen, G.; Zheng, J.; Yan, D.; Yang, X.; Xiong, X. Combining
 high-throughput micro-CT-RGB phenotyping and genome-wide association study to dissect the
 genetic architecture of tiller growth in rice. Journal of Experimental Botany 2019, 70, 545-561.
 2. Katrine, K.; Carl-Otto, O. 3D Laser Triangulation for Plant Phenotyping in Challenging
 Environments. Sensors 2015, 15, 13533-13547.
 3. Ana, C.S.; Miguel, M.; Rocio, B.s; David, H.L. Geometric Characterization of Vines from 3D Point
 Clouds Obtained with Laser Scanner Systems. Remote Sensing 2019, 11, 2365.
 4. Zhang, W.; Dong, S.; Wang, G.; Qiu, Z.; Wu, X.; He, Y. Measurement of Trees Crown Projection
 Area and Volume Based on Airborne LiDAR Data. Transactions of the Chinese Society for
 Agricultural Machinery 2016, 47, 304-309.
 5. Su, Y.; Wu, F.; Ao, Z.; Jin, S.; Qin, F.; Liu, B.; Pang, S.; Liu, L.; Guo, Q. Evaluating maize phenotype
 dynamics under drought stress using terrestrial lidar. Plant Methods 2019, 15.
 6. Indu, I.; Nair, M.V.H.; Jaishanker, R.N.; Rama, R.N. Terrestrial laser scanner based 3D
 reconstruction of trees and retrieval of leaf area index in a forest environment. Ecological
 Informatics 2019, 53, 100986.
 7. Wei, F.; Hui, F.; Yang, W.; Duan, L.; Chen, G.; Xiong, L.; Liu, Q. High-throughput volumetric
 reconstruction for 3D wheat plant architecture studies. Journal of Innovative Optical Health Sciences
 2016, 9, 1650037.
 8. Zhang, Y.; Zhuang, Z.; Xiao, Y.; He, Y. Rape plant NDVI 3D distribution based on structure from
 motion. Transactions of the Chinese Society of Agricultural Engineering 2015, 31, 207-214.
 9. Liang, X.; Zhou, F.; Chen, H.; Liang, B.; Xu, X.; Yang, W. Three-dimensional Maize Plants
 Reconstruction and Traits Extraction Based on Structure from Motion. Transactions of the Chinese
 Society for Agricultural Machinery 2020, 51, 209-219.
 10. Hu, P.; Guo, Y.; Li, B.; Zhu, J.; Ma, Y. Three-dimensional reconstruction and its precision
 evaluation of plant architecture based on multiple view stereo method. Editorial Office of
 Transactions of the Chinese Society of Agricultural Engineering, 2015, 31, 209-214.
 11. Xiong, X.; Yu, L.; Yang, W.; Liu, M.; Jiang, N.; Wu, D.; Chen, G.; Xiong, L.; Liu, K.; Liu, Q. A high-
 throughput stereo-imaging system for quantifying rape leaf traits during the seedling stage.
 Plant methods 2017, 13.
Preprints (www.preprints.org) | NOT PEER-REVIEWED | Posted: 20 May 2021 doi:10.20944/preprints202105.0468.v1

 12. Johann, R.; Stefan, P.; Heiner, K. Accuracy Analysis of a Multi-View Stereo Approach for
 Phenotyping of Tomato Plants at the Organ Level. Sensors 2015, 15, 9651-9665.
 13. Xiong, J.; He, Z.; Lin, R.; Liu, Z.; Bu, R.; Yang, Z.; Peng, H.; Zou, X. Visual positioning technology
 of picking robots for dynamic litchi clusters with disturbance. Computers and Electronics in
 Agriculture 2018, 151, 226-237.
 14. Hu, Y.; Wang, L.; Xiang, L.; Wu, Q.; Jiang, H. Automatic Non-Destructive Growth Measurement
 of Leafy Vegetables Based on Kinect. Sensors 2018, 18, 806.
 15. Xu, S.; Lu, K.; Pan, L.; Liu, T.; Zhou, Y.; Wang, B. 3D Reconstruction of Rape Branch and Pod
 Recognition Based on RGB-D Camera. Transactions of the Chinese Society for Agricultural Machinery
 2019, 50, 21-27.
 16. Xu, H.; Hou, J.; Yu, L.; Fei, S. 3D Reconstruction system for collaborative scanning based on
 multiple RGB-D cameras. Pattern Recognition Letters 2019, 128, 505-512.
 17. Hämmerle, M.; Höfle, B. Direct derivation of maize plant and crop height from low-cost time-
 of-flight camera measurements. Plant methods 2016, 12.
 18. Manuel, V.; David, R.; Dimitris, S. P.; Miguel, G.; Marlowe, E. B.; Hans, W. G. 3-D reconstruction
 of maize plants using a time-of-flight camera. Computers and Electronics in Agriculture 2018, 145,
 235-247.
 19. Feng, J.; Ma, X.; Guan, H.; Zhu, K.; Yu, S. Calculation Method of Soybean Plant Height Based on
 Depth Information. Acta Optica Sinica 2019, 39, 258-268.
 20. Liu, G; Zhang, X.; Zong, Z.; Guo, C. 3D Reconstruction of Strawberry Based on Depth
 Information. Transactions of the Chinese Society for Agricultural Machinery 2017, 48, 160-165,172.
 21. Yu, J.; Li, C.; Andrew, H. P. High throughput phenotyping of cotton plant height using depth
 images under field conditions. Computers and Electronics in Agriculture 2016, 130, 57-68.
 22. Efi, V.; Yael, E. Adaptive thresholding with fusion using a RGBD sensor for red sweet-pepper
 detection. Biosystems Engineering 2016, 146, 45-56.
 23. Wang, Y.; Wen, W.; Wu, S.; Wang, C.; Yu, Z.; Guo, X.; Zhao, C. Maize Plant Phenotypi
 ng: Comparing 3D Laser Scanning, Multi-View Stereo Reconstruction, and 3D Digitizing
 Estimates. Remote Sensing 2018, 11, 63.
 24. Diana-Margarita, C.; Juan, R. T; Hugo, J.H.; Ana-Marcela, H.N. A multiple camera calibration
 and point cloud fusion tool for Kinect V2. Science of Computer Programming 2016, 143, 1-8.
 25. Zheng, L.; Mai, C.; Liao, W.; Wen, Y.; Liu, G. 3D Point Cloud Registration for Apple Tree Based
 on Kinect Camera. Transactions of the Chinese Society for Agricultural Machinery 2016, 47, 9-14.
 26. Sun, G.; Wang, X. Three-Dimensional Point Cloud Reconstruction and Morphology Meas
 urement Method for Greenhouse Plants Based on the Kinect Sensor Self-Calibration. Agr
 onomy 2019, 9, 596.
 27. Hu, Y.; Wu, Q.; Wang, L.; Jiang, H. Multiview point clouds denoising based on interference
 elimination. Journal of Electronic Imaging 2018, 27, 023009.
 28. Ma, Z.; Sun, D.; Xu, H.; Zhu, Y.; He, Y.; Cen, H. Optimization of 3D Point Clouds of Oilseed Rape
 Plants Based on Time-of-Flight Cameras. Sensors 2021, 21, 664.
 29. Shen, Y.; Pan, C.; Liu, H.; Gao, B. Method of Plant Point Cloud Registration Based on Kinect of
 Improved SIFT-ICP. Transactions of the Chinese Society for Agricultural Machinery 2017, 48, 183-189.
You can also read