34th Fiscal Period - Presentation Material For the 34th Fiscal Period Ended December 2018
←
→
Page content transcription
If your browser does not render page correctly, please read the page content below
Securities code 8955
                                                            34         th Fiscal Period

    Presentation Material
    For the 34th Fiscal Period Ended December 2018
     February 19, 2019

                                                     (Asset Manager)
                                                     Tokyo Realty Investment Management, Inc.
Table of Contents and Disclaimer
Table and Contents Disclaimer
• This material contains information that constitutes forward-looking
statements. Such forward-looking statements are made by Japan Prime
Realty Investment Corporation (JPR) and Tokyo Realty Investment
Management, Inc. (TRIM) based on information currently available, and are
1. Characteristics of JPR 2p therefore not guarantees of future performance. Actual results may differ
materially from those in the forward-looking statements as a result of
various factors including known or unknown risks and uncertainties.
2. Operational Status and Growth Strategy 4p • This material is solely for the purpose of providing information, and is not
intended for the purpose of offering or soliciting investment, or as a means
2-1. Summary of Financial Results 5p of marketing activities. Please refer any inquiries for possible purchase of
investment units or investment corporation bonds of JPR to your securities
2-2. Internal Growth Strategy 7p companies.
• Although JPR takes all possible measures to ensure the accuracy of the
2-3. External Growth Strategy 15p content provided in this material (including references to legislation and
taxation), it makes no guarantee as to the accuracy or reliability of the
2-4. Financial Strategy 19p content. Furthermore, the content may be subject to change without prior
notice.
2-5. Sustainability 20P • The photos used in this material include those of the assets other than what
JPR owns or plans to acquire. Please note that for assets indicated as land
25p with leasehold interest, JPR owns only the land and does not own any
3. Financial Results and Operating Forecasts building on it.
• Unless otherwise noted, the figures indicated in this material are rounded
4. Appendix 35p down to the nearest specified unit for monetary amounts and space areas,
and rounded off to the nearest specified unit for percentages and other
figures. Accordingly, the sum totals of monetary amounts or percentages of
5. Glossary 57p respective items may not match the sum totals of actual figures.
(Asset Manager)Tokyo Realty Investment Management, Inc.
Financial Instruments Exchanger (investment management business)
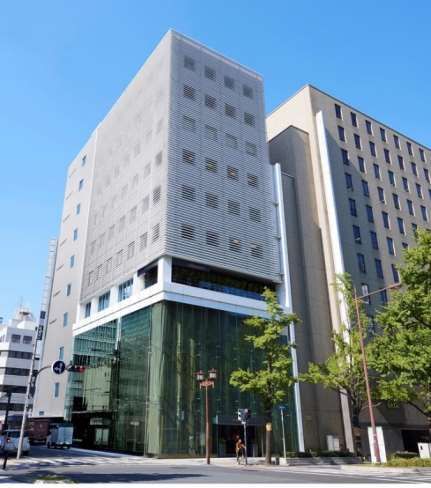
Registration Number: No.362 (Kinsho) Head of Kanto Local Finance Bureau Cover photograph:JPR Shinsaibashi Bldg.
1
JAPAN PRIME REALTY INVESTMENT CORPORATION   1. Characteristics of JPR

                                                                        2
A J-REIT listed in 2002 and managing a combined portfolio with office properties and urban
1. Characteristics of JPR retail properties as investment targets
■Overview of JPR ■Characteristics of JPR
Name
Japan Prime Realty Investment Corporation
(abbreviated as JPR)
1 A track record of stable management for over 16
years
Asset size
(After the asset replacement)
Since listing, JPR has steadily expanded its asset size while enhancing the quality
of its portfolio. 62 properties 435.0 bn. yen
Securities code 8955
Listing date
End of fiscal
June 14, 2002 (16.5 years since listing)
June and December
2 A portfolio focused on office properties in Tokyo
(Area)
Ratio by asset
(After the asset replacement)
Tokyo 84.5 %
period JPR has established a portfolio that is focused on office properties in Tokyo,
Operational
which feature growth potential, with urban retail properties and office properties
in regional cities to complement profitability.
(Asset class) Office 76.8 %
(Ratio by asset class)
standard of Office 70~90% / Retail 10~30%
portfolio
(Target investment
ratio)
(Ratio by area)
Tokyo 80~90% / Other cities 10~20%
3 Superiority of a developer-sponsored REIT
JPR has exerted its superiority of a developer-sponsored REIT to acquire
(planned) acquisition price and ratio
of properties from sponsor pipelines
(After the asset replacement)
properties having excellent location characteristics centering on large-scale
development projects.
315.4 bn. yen・ 72.5 %
Tokyo Realty Investment Management Inc.
Asset Manager
(abbreviated as TRIM)
Tokyo Tatemono (52%)
4 Continuous internal growth through high occupancy
rate and upward revision of rents
Upward revision of rents
9 consecutive fiscal
Sponsors Yasuda Real Estate (18%)
The average occupancy rate of the entire portfolio has stayed at 97% or higher periods
since the 26th fiscal period ended December 2014, and upward revision of rents (Jun. ’14 ~ Dec. ’18)
(shareholding Taisei Corporation (10%) continued to surpass downward revision by value for 8 straight fiscal periods.
ratio) Sompo Japan Nipponkoa Insurance (10%)
Meiji Yasuda Life Insurance (10%)
5 Establishment of a financial base that is stable over
the long term 40.5
LTV
%
Ratio of long-term, fixed interest rate debts
With a credit rating of AA- (Stable), JPR has established a financial base centering
on long-term, fixed-interest rate debts with a focus on stability. 100.0%
Credit rating
1. The indicated figures are as of the date of this document. For Asset size, Investment ratios and (Planned) acquisition price and ratio of properties R&IAA- (stable)
from sponsor pipelines, the indicated figures are those after the Asset Replacement is completed.
2. Properties from sponsor pipelines refer to properties acquired from sponsors, etc. and properties acquired based on information provided by S&P A (stable)
sponsors. Sponsors, etc. represent the five sponsor companies of JPR, their affiliated companies and special purpose companies (SPCs) in which the
sponsors have made equity investment. Ratio of properties from sponsor pipelines refers to the ratio of (planned) acquisition price of properties
from sponsor pipelines over the total (planned) acquisition price of the entire portfolio. 3
JAPAN PRIME REALTY INVESTMENT CORPORATION   2. Operational Status and Growth Strategy

                                                                                        4
2-1. Summary of Financial Results                                       Status of Distribution per unit and NAV

Distribution per unit (DPU) and NAV per unit have continued to increase stably over a long period
of time

                                          DPU 7,326 yen                                                                                             NAV per Unit                     341,007 yen
                 Continuing a record high since listing                                                                                          Continuing to increase steadily
                        Compared with forecast +46 yen
                 Period-on-period comparison +81 yen / +1.1 %                                                                          Period-on-period comparison                        +11,162 yen / +3.4 %
                 (Forecast DPU:7,280 yen)

                       DPU(actual)                    DPU(compared with forecast)                                                               NAV per unit

                                                                                                                                                                                                                                341,007
 (yen/unit)                                                                                           7,326                  (yen/unit)                                                                               329,845
                                                                            7,213 7,223 7,245                                                                                                                   320,060
                                                                   7,048                                                                                                                              306,192
7,000
                                                           6,756                                                            300,000
                                                   6,588                                                                                                                283,129
                                 6,351 6,419
                                                                                                                                                                  273,915
                        6,150                                                                                                                               263,026
6,000
               6,006                                                                                                                                  251,804
                                                                                                                            250,000             230,437
                                                                                                                                          220,672
                                                                                                                                    215,648
5,000                                                                                                                       200,000

4,0000                                                                                                                      150,0000
              Dec. '13 Jun. '14 Dec. '14 Jun. '15 Dec. '15 Jun. '16 Dec. '16 Jun. '17 Dec. '17 Jun. '18 Dec. '18 (period)                 Dec. '13 Jun. '14 Dec. '14 Jun. '15 Dec. '15 Jun. '16 Dec. '16 Jun. '17 Dec. '17 Jun. '18 Dec. '18(period)

                                                                                                                                                                                                                                              5
2-1. Summary of Financial Results Business Environment Perception, results and outlook
Plans for the 34th fiscal period ended Dec. 2018 progressing steadily thanks to a buoyant office
property leasing market and JPR continued to achieve stable growth.
Emphasis was placed on “continuation of contract renewals with upward revision of rents,” “measures to increase NOI,”
“continuous external growth” and “stable fund procurement.”
Internal Growth Strategy External Growth Strategy Financial Strategy
• Office demand from companies is still robust. • Real estate prices in Central Tokyo have mostly reached • While the long-term interest rate temporarily rose slightly
environment
• Leasing of large-scale office properties scheduled for the upper limit due to the revision of the monetary policy by the Bank of
perception
completion by 2020 in Central Tokyo appears to be Japan (BOJ) in July 2018, interest rates are expected to
• Properties in regional cities are also hard to acquire at remain stable under the control of BOJ.
Business
progressing steadily appropriate prices, with their cap rates dropping further
• Vacancy rates in Central Tokyo fell to a historically low • Amid rising concern about political and economic risks
level, and rents also continued to rise. worldwide, cutbacks of monetary easing schemes in the
U.S. and Europe are proceeding at a slower pace.
• The supply and demand balance continued to tighten in
major regional cities as well. • The BOJ continues its monetary easing measures.
• Occupancy rate based on concluded contracts 99.2% • Not much information was available in the for-sale real 【Debt procurement result in the 34th fiscal period (Dec. ’18)】
(previous period 98.2%) estate market on properties that suit JPR’s acquisition • Average maturity
(Before refinancing) 5.6 years ⇒ (After refinancing) 6.7
Results
• Upward revision upon contract renewal (monthly rent, criteria
net) +7.2 million yen • Despite collecting and investigating property information years
• Raising of rents upon tenant replacement (monthly rent, from the sponsors and through proprietary channels like • Average debt interest rate
net) +6.5 million yen close business connections, no acquisition was closed and (Before refinancing) 0.92% ⇒ (After refinancing) 0.54%
completed • Number of lender 30 institutions ⇒ 32 institutions
• Occupancy rate based on concluded contracts during the
period remained above 99%.
• The revision of rents made progress as planned.
• The favorable market environment is assumed to continue. • Continue vigorously selective investments in office • Focus on refinances with an emphasis on flattening of
properties in Tokyo and urban retail properties, with a repayment amount of each fiscal period and lengthening
• The high occupancy rate is expected to be maintained, and the maturity of debts
the revision of rents is assumed to make steady progress. focus on their location and quality.
• Expand the scope of financial institutions to deal with
Outlook
• Deterioration of business confidence is feared in face of • With the number of properties in the sponsors’ pipelines • Diversify funding methods
China’s economic slowdown and the consumption tax hike steadily increasing, discussions on acquisition will be made • Enhance refinance risk tolerance by expanding liquidity on
in October 2019. after discerning the occupancy status, etc. of the hand and other measures
properties
• Continue to implement both measures to maintain and
improve building competitiveness and measures to • Also investigate the addition of asset types.
improve tenant satisfaction.
62-2. Internal Growth Strategy Occupancy Status
Almost full occupancy was maintained from the start of the period.
Occupancy rate are expected to remain stable at a high level in and after the Jun. ’19 period.
■ Occupancy Rate ■ Move-Ins/Move-Outs
• In the Dec. '18 period, leasing up of vacancies outpaced move-outs.
(%)
Occupancy rate based on concluded cntracts
100 Occupancy rate based on generated rents 99.4 • In the Jun. ’19 period, move-outs are expected to remain at a low level and the
99.2 prospects for leasing up are also good.
98.5 98.7
98.3 98.4 98.2
97.8 (Change in move-in/ move-out spaces and forecast)
98 97.4 98.9 Jun. ‘19
Dec. ‘18 End of Jun. ‘19 period
98.3 98.3 End of Jun. ’18 period
move-in/move-out net
End of Dec. ’18period Assumed move- assumed vacancy
97.9 Vacancyspace space Vacancyspace in/move-out net space
97.6 space
97.3
96.9 5,787 m2 -1,818 m2 3,939 m2 112 m2 4,134 m2
96 96.5
(Move-in/ move-out spaces and major move-in/move-out properties
(period)
Move-out (m2)
95.2
94 Dec. '18 5,039 6,858
The most recent
Jun. '19 The most recent 6,184 6,071
920 (forecast) 5-period average 5-period average
Dec. '15 Jun. '16 Dec. '16 Jun. '17 Dec. '17 Jun. '18 Dec. '18 Jun. '19 Dec. '19 (period)
9,645 m2 10,415 m2
(forecast) (forecast)
(period) Major Move-out Major Move-in
■ Average rent free period '18.12 Kawasaki DICE Bldg. 529 m2 Kawasaki DICE Bldg. 1,543 m2
(month)
Shinjuku Square Tower 494 m2 Shinjuku Square Tower 494 m2
6 JPR Dojima Bldg. 429 m2 JPR Dojima Bldg. 572 m2
'19.6 JPR Harajuku Bldg. 1,708 m2 JPR Harajuku Bldg. 1,706 m2
3
(forecast) Olinas Tower 701 m2 Olinas Tower 701 m2
BYGS Shinjuku Bldg. 675 m2 Kawasaki DICE Bldg. 529 m2
2.3 2.4 1.9 1.8 2.0 1.5 1.8 '19.12 Kanematsu Bldg. 1,222 m2 Kanematsu Bldg. 1,222 m2
0
Dec. '15 Jun. '16 Dec. '16 Jun. '17 Dec. '17 Jun. '18 Dec. '18 Jun. '19 (period) (forecast) Kanematsu Bldg. Annex 2,291 m2
(forecast)
1. Occupancy rate based on concluded contracts and occupancy rate based on generated rents represent period-average figures.
2. The figures for the occupancy rate based on concluded contracts and the occupancy rate based on generated rents for the 35th fiscal period (Jun. ‘19)
are estimates that reflect consents regarding move-ins and move-outs that will become effective in the fiscal period. The respective figures for the 36th
fiscal period (Dec. ‘19) are estimates based on assumptions by JPR regarding move-ins and move-outs becoming effective in the fiscal period. 72-2. Internal Growth Strategy Status of Rent
With steady progress made in upward revision of rents and raising of rents upon tenant replacement,
office rents continued to increase
■ Rent Revisions ■ Rent upon Tenant Replacement (increase/decrease of rent through tenant replacement)
Ratio of contracts with upward Increase in monthly rent upon Rate of increase in Ratio of contracts with increase in
Upward revision amount Rate of upward revision
revision tenant replacement rent upon tenant replacement rent upon tenant replacement
Dec. ‘18 +7.4 million yen (monthly rent) +7.5% 48.1% Dec. ‘18 +7.2 million yen(monthly rent) +27.6% 76.9%
(million yen) Upward revision (million yen) Upward revision
Downward revision Downward revision
+30 Upward revision +15
under
negotiation: 3.1
million yen
+20 +10
+23.2 +5
+10
+14.6 +5.1 +4.7 +3.7 +9.0 +7.2 +6.0
+10.9 +10.0 +12.1 +0
+7.4
+0 -0.3 -1.3 -1.0 -4.7 -0.6 -1.7
-2.8 -5.8 -3.9 -3.0 -0.2 -4.0 -5
-10
-10
Dec. '16 Jun. '17 Dec. '17 Jun. '18 Dec. '18 Jun. '19 (period)
(forecast) Dec. '16 Jun. '17 Dec. '17 Jun. '18 Dec. '18 Jun. '19 (period)
(forecast)
(Ratio of contracts with upward revision) (Ratio of contracts with increase in rent upon tenant replacement)
(No. of (%) (No. of Number of tenant Number of contracts with increase Ratio of contracts with increase
( Number of contract Number of contracts with Ratio of contracts with (%)
contracts) renewals (Left axis) upward revision (Left axis) upward revision (Right axis) contracts) replacements (Left axis) in rent upon tenant replacement (Left axis) in rent upon tenant replacement (Right axis)
200 80 50 81.8 100
48.1 71.0 76.9
45.9 67.6
44.6 61.0
32.7 36.7
100 40 25 50
0 0 0 0
Dec. '16 Jun. '17 Dec. '17 Jun. '18 Dec. '18 (period) Dec. '16 Jun. '17 Dec. '17 Jun. '18 Dec. '18 (period)
1. Figures in “Rent Revisions” are values excluding the land rent of the Otemachi Tower (Land with Leasehold Interest).
82-2. Internal Growth Strategy Status of Rent
With rents still being revised upward, the gap in rents will widen further due to solid demand.
■ Status of Gap in Rent (Office) ■ Status of Average Rent (existing office properties, all area)
(yen/tsubo)
Ratio by period-on-period
Lower than market rent Higher than market range (new contract, etc.)
19,000
+45
Within market range Higher than market range (except for new contract) 18,000 +1.7% +0.7%
マ
(million yen)
+1.0% +0.4%
Higher than market
ー +0.6% +0.8%
ケ +30 17,000
ッ
ト
賃 16,000
料 +15
以
rent
上 15,000
Dec. '15 Jun. '16 Dec. '16 Jun. '17 Dec. '17 Jun. '18 Dec. '18 (period)
+0
Gap in rents
■ Change in Average Rents by Area (existing office properties)
マ -4.1%
Lower than market
ー -15 Central Tokyo Greater Tokyo Other cities
ケ (period-on-period (yen/tsubo)
ッ comparison -0.9%) Ratio by period-on-period
ト 21,000 +1.0% +0.7%
賃 (Reference) +1.5% +0.3%
+1.1% +0.9%
料 -30 Gap in actual rents
未
rent
Jun. '19 Dec. '19 Jun. '20 Dec. '20 (period) -8.8% 19,000
満
(period-on-period
-1.3%) +1.4% +0.5%
+0.6% +0.3%
◼ Percentages of space ◼ Ratio of change in upward revision 17,000
-0.3% +0.1%
by the time of contract renewal
Jun. ‘21 fiscal Jun.’19 fiscal Four times
period later period Three times 3% 15,000
14% 21% 11%
Dec.’20 fiscal +1.0%
period +4.7%
Total 64 13,000 +2.1% +0.5% +0.8%
14% Twice +0.8%
Dec. ‘19 fiscal 19% contracts Once
period 67%
Jun.’20 fiscal
19% 11,000
period
32% Dec. '15 Jun. '16 Dec. '16 Jun. '17 Dec. '17 Jun. '18 Dec. '18 (period)
1. “Market rent” and “Market range” refers to rent level set by TRIM for office buildings held by JPR based on assessment of CBRE Inc. and advice from Tokyo Tatemono. 1. “Existing office properties” refer to properties held continuously since the Dec. ‘15 period.
2. “Gap in rents” refers to the difference between the market rent (Jun. ‘19~ Dec. ‘20) and the ongoing rent, and “Gap in actual rents” refers to the difference between 2. Average rent indicates the assumed average rent at full occupancy.
the top of market range and the ongoing rent.
3. “Leased floor space by rent level” expresses for each rent level the sum total of the floor space of tenants whose contracts will come up for renewal Jun. ‘19 - Dec. '20. 92-2. Internal Growth Strategy Internal Growth Initiatives
On top of measures to achieve continuous raising of rents and effective value enhancement,
energetically endeavor to reduce expenses
■ Basic Strategy ■ Example of construction works for value enhancement
(Olinas Tower)
Set target rents, the target for raising rents for new contracts and
Strategically utilize target Acquisition price / date 31,300 million yen / Jun. 2009
contract renewals, for respective office properties. By clarifying the
1. rents target, aim to conduct strategic negotiations for raising rents and 3-minute walk from Kinshicho Station on the
maximizing rents upon tenant replacement Tokyo Metro Line
Nearest station 5-minute walk from Kinshicho Station on the
JR Line
In addition to reinforcing property competitiveness, proactively invest
Reinforce investments for Total floor space/ Building
2. value enhancement in interior fittings and facilities, etc. that meets tenant needs, with an
ownership ratio 257,842 m2 / 23.3%
intention to raise rents for new contracts
• Installation of LED light fittings in exclusively-owned spaces and common-use spaces helped improve the
Deliberately responding to tenants and creating safe and secured building’s score in its assessment for DBJ Green Building certification and the property was upgraded to
Continuously enhance environments are important initiatives that positively affect rent five stars, the highest ranking, at certification renewal in the 34th Fiscal Period (Dec. ‘18).
3. tenant satisfaction negotiations as well as help prevent contract cancellations from
happening Before work After work
Increase NOI by reviewing Review property management and operation methods while paying
attention to maintaining and improving the management quality, in
4. property management and
Elevator hall
an effort to promote reduction of rental expenses and increasing
operation methods incidental revenues
■ Initiatives for Increasing NOI
(Reduction of power charges)
Conducted bidding by several power providers to switch power supply contracts
Subject Reductions in power Effect of reductions
properties charges (annual
estimate) (annual estimate)
Rating upgrade
Project 1
(conducted in the Dec. ’17 27 properties Approx. 63 million yen -9.7 %
period - Jun. ’18 period)
Project 2
(conducted in the Jun. ’18 10 properties Approx. 35 million yen -15.1 % Properties with
Properties with the best
period – Dec. ’18) exceptionally high
environmental & social class environmental &
awareness social awareness
1. The reduction amount indicates the difference the past results of power use at the subject buildings and the estimated amount after switching
power providers based on the past results
102-2. Internal Growth Strategy Status of Construction Works
JPR maintained and enhanced property competitiveness through continuous maintenance
operations based on appropriate repair plans as well as through investments for value
enhancement
■ Example of construction works for renovation
■ Changes in Construction Costs and Depreciation (Tokyo Tatemono Yokohama Bldg.)
Acquisition price and date 7,000 million yen / Dec. 2010
Depreciation Capital expenditures Repairs and maintenance
Completed May 1981
(million yen)
1,943 1,943 1,970 1,988
1,884 1,907 1,921 4-minute walk from Yokohama
2,000 Nearest station Station on each line
1,898 1,938 Total floor space/ Building 8,772 m2 / 100.0%
ownership ratio
1,500 Contracts were cancelled by two tenants for
385 tsubo in the 33rd Fiscal Period (Jun. ‘18)
A decrease in rent on tenant replacement was assumed due
to the rent gap and the age of the building.
1,000 1,146 1,126
505 508
724 438 Minimization of Target tenants Rent +3.0%
500 352 624 383
563 306 decrease in rent on whose customers (from before tenant
216 tenant replacement will visit the property replacement)
Minimization of Renovate common-use Average downtime
downtime spaces 0.7 months
0
Cost of construction work: Approx. 370 million yen, including 180
Dec. '16 Jun. '17 Dec. '17 Jun. '18 Dec. '18 Jun. '19 Dec. '19 (period) million yen on construction works for value enhancement
(forecast) (forecast)
Sought increase in rent and early leasing up
■ Summary of Construction Works in the 34th Fiscal Period (Dec. ‘18) of vacancies through renovation of
following common-use-areas in keeping
with target tenants.
• Total construction costs 1,631 million yen
(i) Elevators (ii) Common-use areas on
=>Of which, works of value enhancement 675 million yen each floor (iii) Entrance (iv) Leased
space partitioning Example of renovations (Elevator Hall)
=>(Of which, works to switch to LED lamp, etc.) 114 million yen
◆Tokyo Tatemono Yokohama Bldg. (224 million yen RN・EV, ◆Kawaguchi Center Bldg. (209 million yen air condition, Return on Investment (ROI) is expected to be more higher than initial estimate of 11%.
etc.) etc.)
Appraisal value rose to 8.87 billion yen (+370 million yen from previous fiscal period)
◆Shinjuku Center Bldg. (103 million yen ESL, etc.) ◆JPR Ningyocho Bldg. (83 million yen RN, etc.)
1. Repairs and maintenance expenses indicate the amount obtained by deducting the repairs and maintenance expenses equivalent to the expenses for restoration to original condition, paid by tenants, from the amount actually recorded for each fiscal period.
2. RN, EV and ESL represent “renovation,” “work on elevators” and “work on escalator”, respectively. 3. Each of the construction costs indicates the amount that includes construction management fees.
4. Construction works (planned) are extracts from long-term plans and do not guarantee implementation.
112-2. Internal Growth Strategy Portfolio Strategy
Amid office supply centered on very large properties in Central Tokyo in recent years, JPR is building a
portfolio centered on large and medium-sized office properties.
■Ratio by Asset Size (Office properties) ■Office Supply (Increase in Leasable Floor in Tokyo’s Five Central Wards)
Extra-large Large and medium-sized Very large
(Tokyo CBDs and 60 (less than 30,000 m2) (30,000 m2 or more)
thousand m2 or more) (year)
11.0% 2012
Medium-sized 2013
(3 thousand m2 to less Other very large 2014
than 10 thousand m2) (30 thousand m2 or 2015
35.3% more) 2016 1.21 6.09
20.4% 2017 million m2 million m2
Large
Large and medium-sized 2018
2019
(10 thousand m2 to less
than 30 thousand m2) 68.7% 2020 (forecast)
2021 (forecast)
2022
33.4%
If Other very large is included, 2023
(thousand m2)
1,000 500 0 500 1,000
89.1%
1. Ratio by Size (Office properties) indicates the ratios based on the total leased space of office properties in each size 1. Prepared by TRIM based on market research agency.
category, which is classified by the total leasable space of an entire office property. Furthermore, The Otemachi Tower 2. The figures indicate the sum total of the increase in leasable floor, caused by the supply of newly-built
(Land with Leasehold Interest) is excluded from the calculation as it is a land property. office properties, for each year.
■Ratio by Rent Zone (Central Tokyo, Greater Tokyo) ■Changes in the average rent of the 23 wards of Tokyo
330 thousand yen or more
Class A Bldg. Class B Bldg. Class C Bldg.
Less than 15 Of which, Tokyo Square Garden accounts for (yen/tsubo)
thousand yen 7.7%.
19.3% 45,000
2.2%
25 to less than 30
15 to less than thousand yen 35,000
7.1%
Less than 30 thousand yen
20 thousand yen
52.7% 20 to less than
25 thousand yen 80.7% 25,000
18.8%
15,000
5,000 (month,
Dec.
Sep. '08 Dec.'10
Sep. Dec. '12
Sep. Dec.'14
Sep. Dec.'16
Sep. Dec. '18 year)
Sep.
1. Ratio of JPR office properties by rent level refers to the ratio of acquisition price, by average unit rent (including 1.Prepared by TRIM based on the statistics data publicized by Sanko Estate Co., Ltd. and NLI Research Institute.
common charges) zone, against the total acquisition price of office properties JPR owns in Central Tokyo and
Greater Tokyo. 122-2. Internal Growth Strategy Retail Portfolio
JPR’s retail properties are situated in prime locations or in areas close to
stations and with high commercial potential
The 14 properties comprising the retail portfolio are all located within a 5-minute walk from the
nearest station
Portfolio breakdown
Type Urban type Station-front type
Retail properties located in front of stations near Tokyo and in major regional
Characteristics Urban retail properties situated on prime locations in Tokyo and Osaka
cities
6物件
NOI yield 4.0% 5.7%
(acquisition price)
8 properties / 54.76 billion yen (asset size) 6 properties / 46.18 billion yen (asset size)
Station-front
Urban type type Tanashi ASTA Kawasaki Dice Bldg. JPR
JPR Ginza JPR JPR Shibuya Yurakucho 8 properties Musashikosugi
Namiki-dori Chayamachi Ekimae Bldg.
Retail 6 properties Bldg.
Tower Records Bldg.
Bldg. Bldg. ( Yurakucho Itocia)
57% 14 properties 43%
JPR Jingumae 432 Shinjuku FUNDES JPR Umeda Loft Bldg. Musashiurawa Shopping Cupo-la Main Bldg. Housing Design
Sanchome Suidobashi Square Center Kobe
East Bldg.
1. Ratios of urban front and station front-type properties are calculated based on asset size.
132-2. Internal Growth Strategy Status of Occupancy Rate and Lease Contract in Retail properties
The occupancy rate of JPR’s retail properties remains stable at almost full
occupancy.
■ Occupancy Rate (Retail properties) ■ Commercial Potential of Station-Front Type properties
(%) Kawasaki DICE Bldg.
99.9 100.0 100.0 99.7 99.4 99.9 99.9 99.4
100.0 Acquisition price / date 15,080 million yen / Apr. 2007
99.9 99.9 99.9 99.8
99.6 99.2 99.4 99.4 1-minute walk from Keikyu Kawasaki
98.0 Station on the Keikyu Main Lines
Nearest station 5-minutes walk from Kawasaki Station
on the JR Lines
96.0 Total floor space/ Building
ownership ratio 36,902 m2 / 46.6%
Occupancy rate based on concluded cntracts
Occupancy rate based on generated rents
94.0
0 • Existing tenant GU moved to a larger space that had been vacated by a tenant in
Jun. '16 Dec. '16 Jun. '17 Dec. '17 Jun. '18 Dec. '18 Jun. '19 Dec. '19 (period)
(forecast) (forecast) the Jun. ‘18 period and opened a larger store, one of only four in Japan.
• Aim to improve profitability through further tenant replacement.
■ Status of Lease Contract (Retail properties) • Planning various sales promotional measures to increase the number of visitors.
Type of tenant (space ratio) Type of rent (space ratio)
Fixed rent + Commission
5%
Multi tenants
22%
New larger store Christmas Grand Raffle Draw
Entire building Fixed rent
• Renovated smoking room and baby room which had long been in need of
78% 95%
improvement.
Remaining contract period
Type of contract (space ratio) (space ratio)
Fixed-term Less than
building lease 2 years 5 years
12% or more
30%
40%
2 years or more and
less than 3 years
1%
Ordinary building lease 3 years or more and
less than 5 years
88% 28% Baby room Smoking room
142-3. 内部成長戦略
2-2. External Growth Strategy Investment Policy
Continue vigorously selective investments focusing on quality, mainly office properties in Tokyo.
Investigate adding urban hotel properties with stable earnings and growth potential
to investment targets.
■ Basic Policy ■ Investigate the addition of urban hotel properties to asset types
(Background to investigation)
(Asset) (Area)
• Relatively stable earnings are expected
Urban retail Tokyo Other cities • Growth potential is expected, partly due to Government policy of
Office
Operation
property promoting Japan as a Tourism-Oriented Country
Basic
70 ~ 90 % 10 ~ 30 % 80 ~ 90 % 10 ~ 20 % • Pipeline through sponsor can be expected
(76.8 %) (23.2 %) (84.5 %) (15.5 %)
(Details of investigation)
• Urban hotels located in busy areas with great transport links
Figures in parentheses are investment ratios as of the date of this material.
• Hotels that specialize in accommodation
(Investment Policy) • Conclusion of long-term fixed rate lease contracts with tenants, in
Investment Target Investment Strategy principle, to eliminate operational risk and ensure stable earnings
• Continue to acquire property information • Investment within the investment standards for urban retail
Offices in Tokyo from the sponsors property (10-30%)
- Properties that still have strong • Utilize pipelines such as preferential • Investigate amendment to Articles of Incorporation at General
growth potential negotiation rights to investigate acquisitions Meeting of Unitholders
through negotiated deals
Urban retail property
• Continue to investigate properties
■ Acquisition Capacity by Debt
- Excellent location, easy to
developed by the sponsor
replace tenants LTV (based on total assets) 40.5%
• Investigate properties held by the sponsor
Profitable properties in regional Acquisition capacity
and properties with the possibility of 36.7 billion yen
cities (maximum LTV of 45%)
negotiated deals
• Investigate asset replacement that will
Strategic asset replacement
contribute to the portfolio with the sponsors
152-3. 内部成長戦略
2-2. External Growth Strategy Utilizing preferential negotiation right
Making rigorously selected investments by utilizing preferential negotiation right
■ Utilizing preferential negotiation right ■ Property to be Acquired in the June 2019 Period
Shinagawa Canal Bldg. (Ownership interest to be additionally acquired: 4.6%)
(Ratio of co-owned properties, etc. (existing preferential negotiation right))
◼ Acquisition Highlights
(Ratio of co-owned properties, etc.) • East exit area of Shinagawa Station is area where further
development can be expected as the starting station for
the Chuo Shinkansen Project
Full ownership • Already own ownership interest of 45.6% in the property
(for the fifth to seventh floors)
32 properties
184.8 billion yen Co-owned properties, etc. • By acquiring additional interest equivalent to 4.6% (for the
(existing preferential eighth floor) JPR will have the majority of ownership
interest (50.2%) in the property.
negotiation right)
Location 2 Konan, Minato-ku, Tokyo
21 properties 190.3 billion yen
Asset class Office
Co-owned properties 44.0%
(not preferential Floors B1 / 8F
Negotiation right)
9 properties 59.8 billion yen Completed July, 2008 (10 years since completion)
Total floor space 5,216.21 m2 (entire bulding)
Leasable floor space 169.93 m2 (additional ownership)
(Example of main acquisition utilizing preferential negotiation right)
Acquisition date March 8, 2019
Ownership
Current
interest on Additional 10 minute walk from Shinagawa Station on the
Property initial acquisition
ownership Acqui s i ti on pri ce 171 mi l l i on yen JR Line, Keihin Express Main Line and Tokaido
interest Shinkansen Line.
acquisition
Appra i s a l va l ue 182 mi l l i on yen
Shinagawa Canal Bldg. 45.6% 4.6% 50.2%
NOI yi el d
Tokyo Square Garden - - 8.22% 4.9%
(planned acquition price)
Shinjuku Square Tower 38.9% +23.7% => +4.7% 67.4%
Shibadaimon Center Bldg. 52.8% +12.6% 65.4% After depreci a ti on yi el d
3.8%
(planned acquition price)
Shinyokohama 2nd Center Bldg. 50.0% +50.0% 100%
BYGS Shinjuku Bldg. 25.0% +50.0% => +25.0% 100% Ca pi ta l i za ti on ra te
(as of janury 15, 2019)
4.5%
1. Tokyo Square Garden was acquired by utilizing the preferential negotiation right of Tokyo Tatemono and the other
properties were acquired by utilizing the preferential negotiation right of JPR.
(Note 1) NOI yield and after depreciation yield represent the average
annual values for the 10-year period after the property
becomes stably operated through leasing.
(Note 2) Appraisal NOI yield is the capitalization rate based on the
direct capitalization method. 162-3. 内部成長戦略
2-2. External Growth Strategy Utilizing the sponsor pipelines
Promote vigorously selective investments and asset replacement by utilizing the sponsor
pipelines
■ Investigation of acquisitions through negotiated deals ■ Continue External Growth by Utilizing Asset Replacement
(Asset replacement policy)
(Utilizing sponsor pipeline) • Aim to build a strong and solid portfolio by promoting asset replacement.
(Ratio of Properties by Property
Acquisition Channel) JPR Sponsors
Strategically sale
Properties acquired • Enhance the quality of the portfolio • Sponsors who are developers have
other than from and profitability through strategical needs to acquire properties to be re-
sponsors asset replacement. developed.
119.6 billion yen Properties • Rejuvenate the age and improve • The main sponsors support expansion
27.5% acquisition from profitability. Asset of JPR as part of their strategy to
sponsors • When properties are sold to the reinforce the comprehensive
replacement
Properties acquired 217.3 billion yen sponsor, discussion on acquisition strengths of the groups and enhance
49.9% after the properties are redeveloped their business portfolio.
based on information Properties acquired
provided by sponsors by the sponsors is possible through • Further reinforcement of the sponsor
using sponsor pipelines preferential negotiations. commitment to JPR’s growth strategy.
98.1 billion yen • Conduct vigorously selective Acquiring blue-chip
22.6% 72.5% investment at assumed fair value. properties
(Recent asset replacement record)
(Largest top 5 properties) (100 million yen)
200 Acquisition
Property Billion yen
JPR Ginza Namiki-dori Bldg. (101) Acquisition
Otemachi Tower FUNDES Suidobashi (32)
1 36.0 Tokyo Square Tower (184)
(land with leasehold interest) Acquisition date: Feb. ’17 and Apr. ‘17
2 Olinas Tower 31.3 100
Sale
Sale +133 物件売却
3 Shinjuku Center Bldg. 21.0 Sale Bldg.
JPR Daikanyama Fukuoka Bldg. (31)
JPR Daikanyama
+92 +92 Fukuoka
JPR Bldg.(31)
Hakata-chuo Bldg.
(18) Bldg.(18) JPR Hakata-chou
4 Tokyo Square Garden 18.4 (19) Bldg.(19)
0
5 Kanematsu Bldg. 16.2 -18
-50
All are properties acquired using sponsor pipelines or
properties developed by the sponsors.
-100
'16.9
Sep. ‘16 '16.12
Dec. ‘16 '17.2
Feb. ‘17 '17.4
Apr. ‘17 '17.4
Apr. ‘17 (year, month)
1. Figures in parentheses indicate the acquisition price or the sale price.
172-3. External Growth Strategy Urban Development by the Main Sponsor
Urban development business of the main sponsor
◼ Examples of development projects by Tokyo Tatemono Co., Ltd.
Large-scale redevelopment projects Urban compact retail property, Urban hotel, Medium-seized office
Owned by JPR Total floor area No. Completion/planne
Asset class Property name
(land with leasehold interest) Owned by JPR (m2) guestroom d completion
FUNDES Suidobashi
(owned by JPR) 1,477 - 2015/7
Urban compact retail FUNDES Ueno 2,249 - 2017/7
properties
(Tentative name) FUNDES Gotanda Unfixed - 2019/7
(Tentative name) FUNDES Ginza Unfixed - 2019/11
Candeo Hotels Tokyo Roppongi 4,700 149 2017/9
The Square Hotel Ginza 5,700 182 2018/8
Hotel Gracery Asakusa 3,700 125 2018/9
Urban hotel The b Osaka Midosuji 10,700 306 2019/2
(Tentative name) Candeo Hotels Omiya 10,100 321 2019/8
(Name to be determined) Kyoto Shijo Unfixed Unfixed Spring ‘21
(Name to be determined)Kyoto Sanjo
Unfixed Unfixed Unfixed
The Otemachi Tower Tokyo Square Garden
(Tentative name) Kakyoin Sendai
Medium-sized office Project 5,800 - Spring ‘20
Owned by JPR Owned by JPR
Owned by JPR
(Tentative name)
Shinjuku Center Bldg. Olinas Tower FUNDES Suidobashi FUNDES Ueno Hotel Gracery Asakusa
Kakyoin Sendai Project
1. For the properties shown in this slide other than those that are already owned by JPR, no specific negotiations for acquisition are underway with Tokyo Tatemono and JPR has no plans to acquire any of them at present.
182-4. Financial Strategy Fund Procurement Status and Outlook
Flatten repayment amount for each fiscal period and reduce debt costs
■ Debt Procurement Results in the 34th Fiscal Period (10 billion yen) ■ Lengthening of Maturity and Flattening of Repayment Amount for Each
Fiscal Period to Around 10 Billion Yen
(100 million yen)
Average maturity Average debt interest rate
300 Long-term loans payable Investment corporation bonds 新規借入('18.12期)
New debt (Dec. '18)
Before After Before After
refinancing refinancing refinancing refinancing
+1.1 Commitment line 24.0 bn. yen
5.6 years 6.7 -0.38% pt
0.92% 0.54% 200
years years
(Dec. ’18 Actual debt)
■ Financial Indicators and Credit Rating Status
(Status of Borrowings by Fiscal Period) Jun. 2018 Dec. 2018 Change 40 50
100 20 10 20 30 10
20 30
New debt 13.29 bn. yen 10.0 bn. yen -3.2 bn. Yen 85
100 110 100 105 99 30 30
91 98 90
81 80 80 70 80 70 80 70
Average maturity (change) 7.6 years 6.7 years -0.9 years 40 30 42
(+2.1 years) (+1.1 years) 20
0
Dec. Jun. Dec. Jun. Dec. Jun. Dec. Jun. Dec. Jun. Dec. Jun. Dec. Jun. Dec. Jun. Dec. Jun. Dec. Jun.(period)
Average borrowing interest 0.57% 0.54% '18 '19 '19 '20 '20 '21 '21 '22 '22 '23 '23 '24 '24 '25 '25 '26 '26 '27 '27 '28
+0.03%pt
rate (change) (-0.43%pt) (-0.38%pt) ■ Average Interest on Debt for Last Three Fiscal Periods and Average
(Status of entire interest-bearing debts) Cost of Debts To be Matured
Average debt cost to be repaid by fiscal period
Total interest-bearing debts 181.1 bn. yen 181.0 bn. Yen -0.1 bn. yen 1.80%
1.04% 0.87% 0.96%
Average maturity -0.1 years 0.58% 0.66%
4.6 years 4.5 years
Average debt cost 0.94% 0.90% -0.04% pt The average interest rate on borrowings
列1three fiscal periods
for the last Jun. '19 Dec. '19 Jun. '20 Dec. '20 Jun. '21 (period)
Ratio of long-term, fixed interest 100% 100% ±0% pt
rate debts
■ Average Debt Cost
(LTV)
(%) Average debt cost
LTV (based on total assets) 40.6% 40.5% -0.1% pt 1.5
1.27
Acquisition capacity 1.21 1.19
35.8 bn. yen 36.7 bn. yen +0.8 bn. yen 1.16
(maximum LTV of 45%) 1.11
1.2 1.03
0.96 0.94 0.90
(Credit rating)
0.9
R&I AA- (Stable) ~
S&P Long-term: A (Stable), Short-term : A-1 0.6
0.0%
Dec. '14 Jun. '15 Dec. '15 Jun. '16 Dec. '16 Jun. '17 Dec. '17 Jun. '18 Dec. '18
(period)
192-5. Sustainability Sustainability (promotion system ・ environmental certification)
Consistent Initiatives on Behalf of Sustainability
■ Sustainability Policy ■ Acquisition of Environmental Certification
Based on its corporate philosophy of working with integrity and commitment to responsibilities, TRIM is resolved to
contribute to the sustainable development of society and the investment management business through discussion
and cooperation with its stakeholders (including investors and tenants), while aiming to maximize value for JPR's
Acquisition of certification: 17 properties, 33.4% of total floor space
unitholders. 1. The above figures are as of the end of the Dec. ’18 period. Due to factors such as the expiration of certification, the status of
1.Initiatives on Behalf of Tenants acquisition is expected to be 14 properties or 30.1% of total floor space as of the February 18, 2019 and 16 properties or 37% of
We will work with integrity and responsibility in responding to tenants, and endeavor to total floor space as of the end of March 2019.
provide them with new and distinct values as well as enhancing their satisfaction.
2.Initiatives on Behalf of the Environment ■ DBJ Green Building
Recognizing the importance of addressing environmental issues, we will aim to reduce As a result of reassessment and the promotion of environmental and
environmental load through managing the assets owned by JPR.
・We will promote energy saving and reduction of greenhouse gas emissions. energy-saving measures at 10 already certified properties, five properties
・We will endeavor for effective use of water resources and work on the "3Rs" (reuse,
reduce and recycle) of waste. improved their rankings.
・We will strive to proactively disclose information on environmental issues.
3.Initiatives on Behalf of Local Communities Ranking
We will work to coordinate with local communities through managing the assets owned
by JPR, in an effort to contribute to enhancing the brand value of the entire area in which Property Before After
such assets are located. reassessment reassessment
4.Initiatives on Behalf of the Employees
We will respect each one of our employees to realize an employee-friendly workplace, Olinas Tower ★★★★ ★★★★★
helping them to enhance abilities in their specialties.
5.Initiatives on Behalf of the Society JPR Sendagaya Bldg. ★★★ ★★★★
We will abide by laws and regulations as well as the rules of society, and conduct Oval Court Ohsaki Mark West ★★ ★★★★
business operations with a focus on transparency and objectivity while holding on to our
high moral standards.
Kanematsu Bldg. ★★ ★★★
BYGS Shinjuku Bldg. ★★ ★★★
■ Sustainability Promotion System
Established the Sustainability Committee with a view to sustainable growth. ■ GRESB ■ CASBEE Certification
• Set goals and conduct monitoring and assessment for the purpose of Acquisition of “Green Star,” the highest Yakuin Business Garden was granted
increasing sustainability. ranking, for five consecutive years a A-rank assessment in 2018
• The members are the President and CEO (chairman), the general managers of
the Financial Division, the Investment Management Division, the Corporate
Planning/Administration Division and the Compliance Office and the Executive
Office.
• Meetings of the Executive Office are held monthly to report on progress in
terms of goals, collect information and work on educational activities in the
company.
• The Sustainability Committee is held twice or more each year and makes a
report to TRIM’s board of directors and JPR’s board of directors once or more
each year. Yakuin Business Garden
202-5. Sustainability Sustainability (Environment)
Reinforcing Continuous Improvement Initiatives on Environmental Issues
■ Construction Works for Reducing Environmental Load ■ Major Energy-saving Construction Works in December 2018 Period
Systematically implement refurbishment to highly energy-efficient facilities (LED/Human sensor installation work) (Air-conditioning improvement work)
• JPR Ningyo-cho Bldg. • Kawaguchi Center Bldg.
Change in construction cost of ESG issue • JPR Ichigaya Bldg. • Rise Arena Bldg.
(million yen)
• Sompo Japan Sendai Bldg. • JPR Nagoya Fushimi Bldg.
400
339 332 • Olinas Tower • Shinjuku Center Bldg.
300 258 ■ Cooperation with tenants
227
211 (Promotion of green lease)
185
200 160 Adopted a green lease clause in the basic contract in both operation and facility
130 123 renovation to contribute to the environment in cooperation with tenants (April 2018).
105
100 Contracts with Green Lease Clause
Number of
Total number of
0 Fiscal Period contracts with
new contracts
Ratio
green lease clause
Jun. '17 Dec. '17 Jun. '18 Dec. '18 Jun. '19
(period)
(forecast) June 2018 Period (33rd Fiscal Period, from April 2018) 12 26 46.2%
LED construction Work on air condition units
December 2018 Period (34th Fiscal Period) 38 49 77.6%
■ Effect of adopting LED lamps (annual estimate)
■ Cooperation with PM and BM
Made cost-effective investments.
(Formulation of a green procurement policy)
Item Jun. ’18 Dec. ‘18 JPR and TRIM have formulated a green procurement policy to
Construction work costs (million yen) 123.18 105.88 focus on the procurement of equipment in consideration of the
environment, health and amenity, in addition to quality, price,
Reduction in electric bills (million yen) 7.48 8.86 delivery time and compliance with laws and regulations.
Reduction in CO2 emissions (t-CO2) 230.88 251.48 (Publication of JPR brand newsletter)
JPR publishes information on issues such as improving tenant
Reduction in CO2emissions/Investment satisfaction, raising awareness of ESG and renovation work
1.87 2.37
amount (million yen) twice a year (March and September) to raise brand awareness
among building staff. JPR published its 30th newsletter in
September 2018. 212-5. Sustainability Sustainability (society)
Initiatives for Enhancement of Tenant Satisfaction
■ Enhancement of Tenant Services ■ Social Contribution and Disaster Drill
JPR Best Performance Award 2018: BYGS Shinjuku Bldg. Entrance Performance Morning Clean-up Activity
• Awarded to outstanding building management companies as good examples for Regularly conduct cleaning activity in the
other properties since 2006 Sought to improve services through Nihonbashi, Yaesu and Kyobashi areas with
• Awarded based on tenant satisfaction, therefore, serving as an incentive to interactions with users by adding seasonal Tokyo Tatemono. Take initiatives for achieving
improve satisfaction. performances in building entrances. interactions with the local people and making
• Outstanding initiatives of recipient buildings are shared with those in charge of contributions to local communities.
other buildings to raise overall level of portfolio.
Recipient
BYGS Shinjuku Bldg. Management Office, Tokyo
Metropolitan Area Branch Office No. 3, TOKYO
FUDOSAN KANRI K.K.
Reason for award
• Effective management of a building that is
challenging to manage, being a large building with
many tenants and a variety of people visiting its
retail floor
• Achievement of high scores in tenant satisfaction
surveys every year
Distribution of Anti-disaster Goods Disaster Drill
• Excellent handling of large-scale renovation, etc.
BYGS Shinjuku Bldg. Distributed smart emergency bottles to TRIM undertakes an earthquake drill exercise
tenants to raise disaster mitigation twice a year, in principle. It works to improve its
disaster response skills by dealing with issues at
awareness in face of increasing frequency
■ Inspection Flow Chart for CS of natural disasters in Japan.
the time of the exercise.
TRIM brand study session
Tenant satisfaction survey and inspection
Verify the questionnaire results and check how
Conduct periodical questionnaires
popular the brand has become
Improvement of management issues Periodical liaison meeting
Improve problematic situations in cooperation Clarify managerial issues and discuss
with property managers and building managers countermeasures among the asset manager,
of respective properties property managers and building managers
(Conducted drill for power outage in December 2018.)
222-5. Sustainability Sustainability (corporate governance)
Endeavor to secure and enhance the soundness of business management as an investment
corporation and an asset management company that are reliable and trustworthy
■ JPR’s Corporate Governance ■ TRIM’s Corporate Governance
JPR’s decision-making organs Decision-making process for property acquisitions
It is stipulated (Article 18 of the regulations) that JPR shall have up to two executive officers and up to The following procedures are taken for cases of transactions with interested parties:
four supervising officers (there must be at least one more supervising officer than executive officers). • An outside attorney is appointed as a special member of the Compliance Committee and examines and
verifies the adequacy and rationality of transactions at the Committee.
Criteria for appointing investment corporation officers and remuneration • Upon implementing the approved transactions, approval by JPR’s board of directors, comprising directors
who are independent from the shareholders of TRIM, must be obtained in advance.
• None of the grounds for disqualification stipulated in the laws concerning investment trusts and investment
Conclude agreement
over certain amount
corporations
Decision making on
Proposal, planning
Review, screening
acquisition policy
Final decision on
• Officers are appointed by means of a resolution of the General Meeting of Unitholders.
transaction with
related parties
Due diligence
Prior review /
Decision on
•
acquisition
acquisition
approval of
The remuneration for executive officers and supervising officers is stipulated in the investment corporation
regulations as the amount decided by the Board of Directors (up to a maximum of 500,000 yen per month for
each executive officer and 400,000 yen per month for each supervising officer).
Fee (Dec. ‘18) Owned
Position Name Other Current Assignments
(thousand yen) units
Tokyo Realty Investment
Executive
TRIM’s Board of Directors
Invest management department
JPR’s Board of Directors
Compliance Committee
Satoshi Okubo Management Inc. 2,400 1
Compliance subcommittee
Investment Subcommittee
Investment subcommittee
Officer
Director
subcommittee
-
Due diligence
Masato Denawa Partner Attorney, Spring Partners
Acquisition
Supervising
Gyosei Certified Public Tax 4,200
Officer
Nobuhisa Kusanagi Accountants' Co. -
Group Representative Partner
Independent Ernst & Young
- 13,300 -
Auditor ShinNihon LLC
Remuneration System of the Asset Manager Decision-Making Based on Stringent Processes
• Employing a management fee system that matches unitholder’s interests and benefits of the
asset management company Decision-making based on stringent processes
Item Calculation of Compensation
Remuneration
Share (Interested parties: 5 sponsor companies and their parent companies, subsidiaries
(Dec. ‘18)
and affiliates)
Fixed fee 12.5 million yen per month 75 million yen 13.4% • Acquisition of properties or assets from interested parties
2% of JPR’s total revenue • Sale of properties or assets to interested parties
Incentive Fee 1 275 million yen 49.2%
(1.5% for 8 billion yen or higher) • Consignment of property management to interested parties
Incentive Fee 2
3% of JPR’s income before income taxes
209 million yen 37.4% • Brokerage or agency by interested parties for transactions
(income before income taxes before deducting Incentive Fee 2)
• Placement of orders for construction works (costing over 10 million yen) to
Incentive Fee 3 0.25% of the acquisition price upon new acquisition - - interested parties
• Leasing of properties to interested parties
23MEMO
24JAPAN PRIME REALTY INVESTMENT CORPORATION 3. Financial Results and Forecasts of Financial Results
253. Financial Results and Operating Overview of Financial Results for the 34th Fiscal Period (Dec. ’18) (period-on-period
Forecasts comparison)
Results of the 34th fiscal period ended December 2018
DPU:7,326 yen (up81 yen, period-on-period)
Rent revenue continued to increase, reflecting steady progress in attracting new tenants and revising rents
upward. The absence of non-operating income posted the previous period was absorbed and cash distributions
increased for the 10th consecutive fiscal period.
Item 33rd Period 34th Period Change 33rd Period 34th Period
Item Change
(Jun. 30, 2018) (Dec. 31, 2018)
(Jun. 30, 2018) (Dec. 31, 2018)
Operating revenue 15,204 15,652 +447 Operating revenue 15,204 15,652 +447
Rental revenue 15,204 15,652 +447 Rental revenue 14,380 14,723 +342
Operating expense 7,869 8,066 +197 Rents and common charge 12,343 12,630 +286 ①
Land rent 1,630 1,679 +49 ②
Expenses related to rent business 7,114 7,311 +196
Revenue and Other fixed income 406 413 +7
Selling, general and adminisutrative expenses 754 755 +0
profit Other rental revenue 824 929 +104
Operating income 7,335 7,586 +250
(million yen) Incidental income 673 801 +128 ③
Non-operating income 227 27 -200 ⑥
Cancellation penalty, etc 14 16 +1
Non-operating expenses 877 851 -25 ⑦ Income equivalent to expense for restoration
to original condition 101 77 -23
Ordinary income 6,685 6,761 +75 Other variable income 35 33 -1
Net income 6,686 6,760 +74 Expenses related to rent business 7,114 7,311 +196
DPU (yen) (per unit) 7,245 7,326 +81 Outsourcing fees 586 594 +7
Utilities expenses 748 891 +143 ④
Number of units outstanding 923,000 923,000 -
Property and other taxes 2,217 2,210 -6
Insurance premiums 24 24 +0
Operating revenue Repairs and maintenance 473 569 +96
① [Rents and common charge]Increased (up 2.3% from the previous period) due to progress in attracting new tenants and
新規テナントの誘致や賃料増額改定が進捗し増収(前期比+2.3%)
upwardly revising rents
Property management fees 289 279 -10
② [Land rent] 大手町タワー(底地)の地代改定が通期寄与
Revision of land rent of Otemachi Tower (land with leasehold interest) contributed throughout the whole period
Management association accounts 567 568 +0
③ [Incidental income] 主に季節要因により増収
Increased mainly due to seasonal factors
Depreciation 1,943 1,943 +0
Expenses related to rent business Other expenses related to rent business 262 227 -34 ⑤
④ [Utilities expense] 主に季節要因により増加、水道光熱収支は悪化(-14百万円)
Increased mainly due to seasonal factors and the balance of utilities expenses deteriorated (-14 million yen) NOI 10,033 10,285 +251
⑤ [Other operating expenses] 仲介手数料等が減少
Brokerage fees and other expenses decreased NOI yield (book value) 4.9% 5.0% +0.1%pt
Rental income-real estate 8,090 8,341 +250
Non-operating income and expenses After-depreciation (book value) 4.0% 4.0% - %pt
Decreased mainly due to absence of settlement on management association accounts
⑥ [Nonoperating income] 管理組合精算金の剥落(臨時精算金の剥落を含む)等により減収
(including for extraordinary accrual) Rent-paying occupancy rate (period average) 96.9% 98.3% +1.4%pt
⑦ [Non-operating expenses] 支払利息・投資法人債利息等の財務コストが減少
Financial costs such as interest expense on loans and investment corporation bonds decreased
263. Financial Results and Operating Overview of Financial Results for the 34th Fiscal Period (Dec. ’18) (period-on-period
Forecasts comparison)
Result of the 35th fiscal period ended December 2018
Total assets: 447.1 billion yen, NAV per unit: 258,626 yen
Item 33rd Period 34th Period Change Increase or decrease in cash and deposits
(Jun. 30, 2018) (Dec. 31, 2018) Change
Current Asset 33,836 35,516 +1,679 Net cash provided by operating activities +9,229
Cash and deposits (including trust) 33,181 35,056 +1,875 Income before income taxes +6,761
Other current asset 655 459 -195 Depreciation and amortization +1,943
Noncurrent assets 412,314 411,514 -800 Other, net +524
Property, plant and equipment 397,104 396,273 -830 Net cash provided by investing activities -568
Intangible assets 14,690 14,690 -0 Purchase of property, plant and equipment -815
Investments and other assets 519 549 +30 Other, net +247
Deferred assets 146 127 -19 Net cash provided by financing activities -6,785
Investment corporaton bond issuance costs 123 111 -11 Proceeds from lisbilities +10,000
Investment unit issuance expenses 22 15 -7 Repayment of liabilities -10,100
Total assets 446,297 447,157 +859 Dividends paid -6,685
Current liabilities 24,889 27,383 +2,494 Total cash and deposits +1,875
Balance Short-term loans payable - - -
Sheet
(million yen)
Current portion of long-term loans payable 17,200 17,100 -100 Increase or decrease in noncurrent assets
Current portion of investment corporation bonds 2,000 4,000 +2,000 Change
Other current liabilities 5,689 6,283 +594 Capital expenditures +1,126
Noncurrent liabilities 182,769 181,062 -1,707 Depreciation -1,943
Long-term loans payable 136,420 138,420 +2,000 Others +17
Investment corporation bonds 25,500 21,500 -4,000 Noncurrent assets -800
Tenant leasehold and security deposits 20,849 21,142 +292
Total liabilities 207,659 208,445 +786 Increase or decrease in liabilities
Repayment/ Balance at end of
Unitholders' capital 231,653 231,653 - New procurement
redemption current period Change
Surplus 6,985 7,059 +73 Short-term loans payable - - - -
Reserve for reduction entry 284 284 - Long-term loans payable 10,000 8,100 155,520 +1,900
Unappropriated retained earnings 6,701 6,774 +73 Investment corporation bonds - 2,000 25,500 -2,000
Total net assets 238,638 238,712 +73 Total liabilities 10,000 10,100 181,020 -100
27You can also read