2023 Property Values and Assessment Practices Report - Assessment Year 2022 - Property Tax Division
←
→
Page content transcription
If your browser does not render page correctly, please read the page content below

2023 Property Values and
Assessment Practices Report
 Assessment Year 2022

 Property Tax Division
 March 1, 2023

Per Minnesota Statutes, section 3.197, any report to the Legislature must contain, at the beginning of the
report, the cost of preparing the report, including any costs incurred by another agency or another level of
government.

This report cost $8,100.
Commissioner’s Letter

March 1, 2023

To Members of the Legislature of the State of Minnesota:
I am pleased to present to you this report on property values and assessment practices in Minnesota, the
20th annual version of this report. Since 2012, this report has been combined with the annual report
related to agricultural properties and Green Acres, satisfying the requirements of both Minnesota Statutes,
section 273.1108, and Minnesota Laws 2001, First Special Session, chapter 5, article 3, section 92.
This report provides a summary of assessed property values and assessment practices in Minnesota, with
an emphasis on market values for 2a agricultural and 2b rural vacant land properties, and Green Acres
value methodology and determinations.

Sincerely,

Paul Marquart
Commissioner
Minnesota Department of Revenue

600 N. Robert St., St. Paul, MN 55146 An equal opportunity employer
www.revenue.state.mn.us This material is available in alternate formats.

 2023 Property Values and Assessment Practices Report i
Contents

Table of Contents
Commissioner’s Letter ............................................................................................................................... i
Introduction .................................................................................................................................. 1
 Data Sources............................................................................................................................................................. 1
 Overview of the Minnesota Department of Revenue’s Role ................................................................... 1
Estimated Market Values and the Sales Ratio Study ............................................................... 3
 Sales Used for the 2022 Assessment Year ..................................................................................................... 3
 Analysis of Sales Impacting Market Value Changes .................................................................................. 3
 2022 Assessment Quality and Sales Ratio Studies on EMVs .................................................................. 4
 Statewide Change in Value by Property Type .............................................................................................. 5
Taxable Market Value ................................................................................................................ 20
 Exclusion and Deferral Trends .......................................................................................................................... 22
 Green Acres and Rural Preserve ...................................................................................................................... 23
Tax Distribution .......................................................................................................................... 24
 Taxable Value ......................................................................................................................................................... 25
 2022 Trends ............................................................................................................................................................ 25
Appendix A – Summary of 2022 State Board Orders............................................................. 27
 Sales Ratios and Coefficients of Dispersion ................................................................................................ 27
 State Board Orders by County for 2022 Assessment Year .................................................................... 28
Appendix B – Sales Ratio Studies ............................................................................................. 32
Appendix C – Classification Rates (2022 Assessment) ............................................................ 34
Appendix D – Green Acres and Rural Preserve Values .......................................................... 36
 Taxable Green Acres Value ................................................................................................................................ 36
 Rural Preserve ........................................................................................................................................................ 38
 County Average Value Per Acre – Assessment Year 2022 ..................................................................... 39
Appendix E – Maps: Statewide Market Values and Assessment Practices Indicators ........ 41
Appendix F – Glossary ............................................................................................................... 47

 ii Minnesota Department of Revenue – Property Tax Division
Introduction

Introduction
This is the 21st annual report to the Minnesota Legislature on property tax values and assessment
practices in the state. The Legislature mandated this report from the Minnesota Department of Revenue in
2001. Since 2012, this report has been combined with the annual report about agricultural properties and
Green Acres, satisfying the requirements of both Minnesota Statutes, section 273.1108, and Minnesota
Laws 2001, First Special Session, chapter 5, article 3, section 92.

As required by those mandates, this report contains:
 ▪ Information by major types of property on a statewide basis and at various jurisdictional levels
 ▪ Recent market value trends
 ▪ Trend analysis of excluded market value
 ▪ Assessment quality indicators, including sales ratios and coefficients of dispersion for counties
 ▪ A summary of State Board Orders issued in 2022
 ▪ Green Acres value methodology and determinations
 ▪ Assessment and classification practices for class 2a agricultural and 2b rural vacant land property

This report provides an accurate description of the current state of property tax assessment and an
overview of the department’s responsibility to oversee the state’s property tax assessment process. This
report collects property value data for the purpose of monitoring and analyzing underlying value trends
and assessment quality. This information and analysis informs government officials and the public about
valuation trends within the property tax system.

Data Sources
The data for the assessment practices report is gathered through data submissions from all 87 counties in
Minnesota. The data used in this report for assessment year 2022 is from the PRISM 2 files, submitted on
September 1, 2022.

Historical data is gathered from PRISM 3 submissions, submitted on April 1 of the taxes-payable year.
The April 1 file may reflect minor changes to taxable market value that occur between September 1 and
December 31, such as properties that become exempt. Prior to the 2021 Assessment Practices Report, all
data used was from PRISM 2 submissions, and therefore may cause small differences when comparing
data to earlier reports.

Overview of the Minnesota Department of Revenue’s Role
Property taxes are an important source of revenue for all local units of government in Minnesota, including
counties, cities, townships, and school districts. The primary responsibility of the department’s Property Tax
Division is to ensure fair and uniform administration of, and compliance with, state property tax laws.

The Property Tax Division measures compliance with property tax laws through:
 ▪ The State Board of Equalization ensures that property owners pay their fair share – no more and
 no less. The Department of Revenue, acting as the State Board of Equalization, has the authority
 to increase or decrease assessed market values in order to bring about equalization.
 ▪ Promotion of uniformity of administration among the counties to ensure that each taxpayer will be
 treated in the same manner regardless of where the taxpayer lives.

 2023 Property Values and Assessment Practices Report 1
Introduction

 ▪ Delivery of accurate and timely aid calculations, certifications, and actual aid payments.
 ▪ Education and information for county officials, including technical manuals, bulletins, answers to
 specific questions, and courses taught by division staff. These offerings provide county officials
 the support and training necessary to administer property tax laws equitably and uniformly.

The classification system is another part of the Minnesota Department of Revenue’s efforts to measure
assessment quality. The sales ratio study and State Board of Equalization use property classifications to
study value trends and accuracy of assessors’ valuations. For the purposes of this report, the department
has focused on the following major classification types:
 ▪ Residential
 ▪ Seasonal recreational residential (cabins)
 ▪ Apartments
 ▪ Commercial
 ▪ Industrial
 ▪ Agricultural and rural lands

 2 Minnesota Department of Revenue – Property Tax Division
Sales Ratio Study

Estimated Market Values and the Sales Ratio Study
Minnesota law requires that all property be valued at its market value. For property tax assessment
purposes, the market value is rounded to the nearest $100. Assessors are required to determine the value
of the land, the value of the structures and improvements to the land, and the resulting total market value.

The “market value” used for property tax purposes is the “open market value,” which is the price a
property would sell for under typical, normal, and competitive conditions. It is also called the estimated
market value (EMV). The most common method to determine EMVs is the comparable sales approach.

To evaluate the accuracy and uniformity of assessments within the state (and to ensure compliance with
property tax laws), the Minnesota Department of Revenue conducts annual sales ratio studies. These
studies measure the relationship between appraised values and the actual sales price.

Sales Used for the 2022 Assessment Year
The number of total sales and the number of good sales increased between the 2020 and 2021 sales ratio
study years. The data comes from sales that occurred October 1, 2020 - September 30, 2021.

There were 162,451 Certificates of Real Estate Value (CRVs) received in the 2021 sales ratio study for
the 2022 State Board of Equalization. Of these, 104,269 were considered good, current-year, open-market
sales. This was an increase in the number of sales and good sales from the previous year (138,971 sales,
87,523 of them good sales). Additionally, this represented an increase in the ratio of good sales compared
to overall sales (64.2% compared with 63% last year).

Analysis of Sales Impacting Market Value Changes
Sales ratio studies measure the relationship between appraised values and the actual sales price. A sales
ratio is the assessor’s estimated market value of a property divided by its actual sales price, as seen here:

 Assessor's Estimated Market Value
 Sales Ratio =
 Sales Price
 Equation 1

For example, assume a home was valued by the assessor at $100,000. The home sold for $105,000. The
sales ratio would be calculated as follows:

 $100,000
 Sales Ratio = = 95%
 $105,000

 2023 Property Values and Assessment Practices Report 3
Sales Ratio Study

2022 Assessment Quality and Sales Ratio Studies on EMVs
The two primary measures of assessment quality are the sales ratio and the coefficient of dispersion
(COD).1

Sales ratios measure the level of assessment (how close appraisals are to market value on an overall
basis). For the 2021 sales ratio study (for the 2022 assessment), the statewide median sales ratios for all
property types were in the acceptable targeted range of 90 to 105%.

Coefficients of dispersion measure the uniformity of assessment (how close individual appraisals are to
the median ratio and each other). The lower the COD, the more uniform the assessments. A high
coefficient suggests a lack of equality among individual assessments, with some parcels being assessed at
a considerably higher ratio than others. Note that property types with smaller sample sizes tend to have
lower sales ratios and higher CODs. This is an area of concern with smaller sales samples.

Assessment quality decreased slightly between the 2020 and 2021 sales ratio studies (for assessment years
2021 and 2022). Sales ratios worsened for all property types other than Commercial/Industrial, while the
COD of all property types aside from resorts and miscellaneous saw a small increase in their COD.

See Appendix A for the median sales ratios and CODs by property type.

State Board Orders
The State Board of Equalization issues corrective orders when the median sales ratio for a property type is
outside the 90 to 105% acceptable range. Thirteen counties were issued State Board Orders for the 2021
sales ratio study, compared to five counties for the 2020 study.

The Minnesota Department of Revenue’s appraisal staff works with assessors to identify areas of concern
for future assessments to help avoid State Board Orders. These issues usually fall into three categories:
 1. Low sales ratios in areas with a history of few sales
 2. Sales ratios near the 90 to 105% range boundaries
 3. Areas with uniformity concerns
(See Appendix A for a list of 2022 State Board Orders by county and Appendix B for a detailed
explanation of sales ratio studies used for these board orders.

1
 As a general rule, sales ratios and coefficients of dispersion are more accurate in classes with more sales activity because a
larger sales sample is more likely to reflect the range of values for all properties in the jurisdiction.

 4 Minnesota Department of Revenue – Property Tax Division
Value Trends in 2022

Statewide Change in Value by Property Type
Methods of Examining Value
The following sections will examine how EMV changed for the 2022 assessment year. To do so, we will
use two different types of EMV: aggregate EMV and “Constant Class” (CC) EMV. We will also look at
sale numbers, class changes, and the value of new improvements.

Aggregate EMV is the amount of assessed value that is classified and categorized as each property type.
This can change based on values for that property increasing or decreasing, existing properties changing
from one type to another, or construction or destruction of properties of that type.

CC EMV is aggregate EMV without considering classification changes and does not factor in new
construction or destruction of improvements. CC EMV numbers are estimates that depend on the quality
of data submitted, and therefore are not as accurate as Aggregate EMV. Nonetheless, CC EMV is
extremely helpful as it shows how values of different property types are increasing or decreasing without
having to worry about new construction or classification changes.2

Sale numbers are collected from good eCRV submissions and can help show what types of properties
were sold during the year. Class changes show when a property was changed from one type to another;
this is usually due to the use changing from year to year, but can also be due to law changes reclassifying
a use from one property type to another. Lastly, new improvements are the total value added by new
construction and new improvements minus the value lost by demolition of improvements for each
property type.

These figures are compared across the major property types, determined by classification and other data
submitted by counties. These property types are:

 • Agricultural homestead house, garage, and acre (HGA)
 • Agricultural homestead land
 • Agricultural non-homestead land
 • Seasonal residential recreational non-commercial (cabins)
 • Residential homestead
 • Residential non-homestead (1-3 units)
 • Apartments
 • Commercial
 • Industrial

Comparing to Previous Years
As with the 2021 assessment year, the first since the COVID-19 pandemic and subsequent market shifts,
the 2022 assessment again provided trends that are unique compared to assessment year 2020 and before.
Due to these unique factors, last year’s report compared the 2021 data with the previous four-year average

2
 Example: a residential home was valued at $200,000 in AY2020. During 2020 they built a new garage. For AY 2021, the
house was valued at $220,000 and the garage valued at $30,000, bringing the total value to $250,000. Aggregate EMV would
show a 25% increase (from $200,000 to $250,000), while CC EMV would show a 10% increase (the increased value of the
house from $200,000 to $220,000).

 2023 Property Values and Assessment Practices Report 5
Value Trends in 2022

 change in EMV instead of only examining the change from one year to the next3. The following sections
 will compare EMV numbers from the 2022 assessment, 2021 assessment, and the same previous average
 from 2016-2020.

 Statewide Trends in 2022
 Estimated market values in assessment year 2022 saw large increases across all property types, with
 almost all seeing increases more than double the changes in 2021. This follows the increase in the number
 of good sales in the most recent sales ratio study, which was the largest of the 2016-2022 period.

 Percent Change in Statewide Aggregate EMV by Property Type
35.0%

30.0% 28.9%
 27.8%

25.0%
 22.0%

20.0%
 17.8% 17.8%

 14.6% 14.1%
15.0%
 12.4%

 9.8% 10.1%
10.0% 7.3%
 6.2% 6.3% 6.8% 7.4%
 5.9%
 4.7% 5.6%
 5.0% 4.7% 4.0%
 3.6%
 2.9%

 0.0% 0.1%
 0.0%
 0.1%
 -1.4% -1.5%

-5.0%

 2016-2020 Averages 2021 2022
Chart 1

 Residential properties, making up the majority of statewide market value, saw especially large gains close
 to triple their increases last year or over the four-year average. This in turn resulted in the largest
 statewide aggregate EMV increase since our data began in 2005, as seen in Chart 2.

 3
 This averaged the change in EMV from 2016-2017, 2017-2018, 2018-2019, and 2019-2020.

 6 Minnesota Department of Revenue – Property Tax Division
Value Trends in 2022

 Statewide Change in Aggregate EMV by Year

 Assessment Year 2005 2006 2007 2008 2009 2010 2011 2012 2013

 Change 11.9% 11.3% 6.5% 0.7% -1.7% -4.2% -1.8% -1.1% 5.2%

 Assessment Year 2014 2015 2016 2017 2018 2019 2020 2021 2022

 Change 7.9% 2.9% 3.0% 4.5% 5.3% 5.4% 4.5% 4.1% 17.0%

 Table 1

 Looking at CC EMV, we again see large increases across all property types, with some types4 seeing
 larger percentage increases than aggregate EMV. This suggests that there were large value increases for
 established property types irrespective of new construction or classification changes.

 Percent Change in Constant Class EMV
30.0%

 25.0%
25.0%

20.0% 19.0%
 17.9%
 17.0%

 14.4% 14.9%
15.0%

 11.0%
10.0% 8.4%
 7.4%
 5.3% 5.4%
 4.9% 5.7% 4.8% 5.0%
 5.0% 4.4% 4.5%
 2.6% 2.8% 3.1% 3.1%
 1.4%
 0.1%
 0.0%
 -0.1%
 -0.8% -0.7%
 -2.4%
-5.0%

 2016-2020 Average Change 2020-2021 Change (COVID) 2022 Change
Chart 2

 4
 Agricultural homestead HGA, agricultural homestead land, and residential homestead

 2023 Property Values and Assessment Practices Report 7
Value Trends in 2022

 Chart 3 provides additional historical context by examining the aggregate change in EMV for certain
 property groups between 2013 and 2022.

 Percent Change in Estimated Market Value by Property Class
 Assessment Years 2013-2022
 2013 2014 2015 2016 2017 2018 2019 2020 2021 2022
30.0%
25.0%
20.0%
15.0%
10.0%
 5.0%
 0.0%
-5.0%
 Agricultural Apartment Commercial Industrial Residential Seasonal
Chart 3 Land Non-Commercial

 Regional Trends in 2022
 To examine regional trends, we again divided EMV data into three regions:

 • Twin Cities Metro Area
 • Non-Metro Cities
 • Greater Minnesota

 The Non-Metro Cities category includes all cities of the first and second class outside the seven-county
 Metro area (instead of only Duluth, Mankato, and St. Cloud). This change provides a clearer distinction
 between these cities and the rest of Greater Minnesota.5

 Table 1 compares the percent change in both aggregate and CC EMV by region for all property types for
 assessment years 2022, 2021, and the four-year average between 2016-2020. From these numbers, we can
 see that between 2016 and 2020, on average the Metro saw greater increases in both aggregate and CC
 EMV than Non-Metro Cities, which in turn had greater increases than the rest of Greater Minnesota.
 These numbers converged in 2021, with the Metro and Non-Metro Cities seeing reduced increases in both
 aggregate and CC EMV, while Greater Minnesota’s increases grew. While all regions shared in the

 5
 The 11 non-Metro cities include: Rochester, Duluth, St. Cloud, Moorhead, Mankato, Winona, Owatonna, Austin, Elk River,
 Faribault, and Northfield. (Part of Northfield falls into Dakota County; this is included in EMV totals for the non-Metro cities
 category.)

 8 Minnesota Department of Revenue – Property Tax Division
Value Trends in 2022

 dramatic increases in 2022, Greater Minnesota’s relative upward trend continued and saw the highest
 EMV increases in both aggregate and CC EMV.

 Percent Change in EMV (All Property Types)
 (Average EMV is the Average Change from 2016-2020)

 Region 2016-2020
 2021 2022 2016-2020
 Average
 (2022 EMV in Aggregate Aggregate Average CC 2021 CC EMV 2022 CC EMV
 Aggregate
 millions) EMV EMV EMV
 EMV

 Twin Cities
 Metro Area 6.8% 4.3% 15.6% 4.7% 2.8% 14.1%
 ($521,702)
 Non-Metro
 Cities 5.9% 4.9% 15.2% 4.1% 3.4% 13.6%
 ($55,771)
 Greater
 Minnesota 2.6% 3.7% 19.2% 2.2% 2.8% 17.5%
 ($403,468)
Table 2

 Agricultural Land
 Agricultural land includes both agricultural and rural vacant land, and is almost entirely located in Greater
 MN (95% of total market value). For that reason, it is much more useful to examine the differences
 between homestead and non-homestead land; agricultural homestead HGAs will be examined in the
 residential section.

 Looking at both homestead and non-homestead aggregate EMV in Table 3, we see increases to both, and
 a much larger increase for non-homestead land than for homestead. These increases are the highest for
 aggregate EMV since 2014 and 2013, respectively, as since then agricultural EMV has generally
 remained flat or decreased. Examining CC EMV, we see that both increased at a much more similar pace.
 This is expected, as increased value of the land would be unlikely to distinguish between homesteaded
 and non-homesteaded land.

 2023 Property Values and Assessment Practices Report 9
Value Trends in 2022

 Percent Change in Statewide Agricultural Land EMV
 (Average EMV is the Average Change from 2016-2020)

 Land Type
 Average 2021 2022
(2022 Nominal Average CC
 Aggregate Aggregate Aggregate 2021 CC EMV 2022 CC EMV
 EMV in EMV
 EMV EMV EMV
 millions)

 Agricultural
 Homestead
 Land -1.4% 0.0% 9.8% -0.8% 0.1% 14.4%
 ($89,086)
 Agricultural
 Non-
 Homestead 0.1% 0.1% 22.0% -0.7% -0.1% 14.9%
 Land
 ($60,975)
All Agricultural
 Land -0.9% 0.0% 14.5% -0.8% 0.0% 14.6%
 ($150,061)
Table 3

 The fact that the CC EMV increase of all agricultural land is almost the same as that of aggregate EMV
 suggests that the increase in value was likely due to increased value of the land rather than new land being
 used for farming. Indeed, looking at Chart 4 we see that acreage decreased from 2021 to 2022, and that
 the trendline for acreage is mostly flat.

 All Agricultural Land EMV and Acreage
155,000,000,000 34,500,000

150,000,000,000
 34,000,000

145,000,000,000

 33,500,000
140,000,000,000

135,000,000,000
 33,000,000

130,000,000,000

 32,500,000
125,000,000,000

120,000,000,000 32,000,000
 2016 2017 2018 2019 2020 2021 2022

 All Ag Land EMV All Ag Land Acreage Linear (All Ag Land Acreage)
Chart 4

 10 Minnesota Department of Revenue – Property Tax Division
Value Trends in 2022

 Splitting out EMV and acreage based on homestead status, we see that acreage has been generally
 increasing for non-homesteaded land at the expense of homesteaded land since at least 2016. This is
 reflected in the EMV trends by the fact that homestead EMV has generally been decreasing slightly, while
 non-homestead EMV has held steady.

 It is important to remember that these increases are just for the Estimated Market Value, which is
 calculated before any deferrals such as Green Acres or Rural Preserve are applied. Those programs and
 their effects are discussed in their own section below.

 Homestead Agricultural Land EMV and Acreage
90,000,000,000 20,000,000

88,000,000,000
 19,500,000

86,000,000,000
 19,000,000

84,000,000,000
 18,500,000
82,000,000,000

 18,000,000
80,000,000,000

 17,500,000
78,000,000,000

76,000,000,000 17,000,000
 2016 2017 2018 2019 2020 2021 2022

 Ag Homestead EMV Homestead Acreage Linear (Homestead Acreage)
Chart 5

 Non-Homestead Agricultural Land EMV and Acreage
70,000,000,000 15,200,000

 15,000,000
60,000,000,000
 14,800,000
50,000,000,000 14,600,000

 14,400,000
40,000,000,000
 14,200,000
30,000,000,000
 14,000,000

20,000,000,000 13,800,000

 13,600,000
10,000,000,000
 13,400,000

 0 13,200,000
 2016 2017 2018 2019 2020 2021 2022

 Ag Non-Hmstd EMV Non-Hmstd Acreage Linear (Non-Hmstd Acreage)
Chart 6

 2023 Property Values and Assessment Practices Report 11
Value Trends in 2022

 Apartments
 Aggregate apartment EMV increased by double-digits in all regions after seeing lower-than-average
 increases in 2021. The increases were all similar regionally, meaning that the increase in Greater
 Minnesota is double that than the pre-2021 average, while the increase in the Metro only represents a
 1.2% increase compared to the prior average. Most market value for apartments is located in the Metro
 (82.5%), which means that the statewide numbers generally reflect that region, while others may see more
 swings due to the lower EMV.

 Percent Change in Apartment EMV
 (Average EMV is the Average Change from 2016-2020)

 Region
 (2022 Nominal Average 2021 2022
 Average CC
 EMV in millions Aggregate Aggregate Aggregate 2021 CC EMV 2022 CC EMV
 EMV
 and % of total EMV EMV EMV
 regional EMV)

Twin Cities Metro
 Area 13.3% 7.5% 14.5% 8.3% 1.1% 7.9%
($53,207; 10.2 %)
Non-Metro Cities
 10.7% 7.3% 14.2% 4.8% 3.1% 10.0%
 ($5,531; 9.9%)
 Greater
 Minnesota 7.0% 6.6% 15.8% 3.1% 3.0% 10.8%
 ($5,729; 1.4%)
Table 4
 Constant Class EMV increases are again several percentage points lower than those of aggregate EMV,
 although both saw much larger increases compared to 2021 and a less dramatic difference between
 aggregate and CC EMV. This suggests that a large contributor to EMV increases are due to new
 construction or classification changes. For the second year in a row Greater Minnesota saw higher
 increases than in the Metro, which is especially noteworthy given that from 2016-2020 the Metro
 averaged a much higher increase than that of Greater Minnesota.

 As a whole, apartments make up approximately 10% of all market value in the Metro and Non-Metro
 Cities, though these numbers both decreased by around 0.1% from 2021. This is likely due to the larger
 increase in residential property, which already makes up a larger amount of statewide EMV. Apartments
 have seemingly returned to similar rates of EMV increases from pre-2021, albeit with increases seen more
 in Greater Minnesota than the Metro. Meanwhile since 2021, Non-Metro Cities have seen changes in
 aggregate EMV similar to the Metro area, but with changes in CC EMV more akin to that of Greater MN.

 12 Minnesota Department of Revenue – Property Tax Division
Value Trends in 2022

 Residential Property
 Residential properties are likely the most important type of properties we examine in this report, as they
 contain a plurality of the market value of all three regions, and a majority of market value for the Metro
 and Non-Metro Cities (table 5). Therefore the changes in residential property, especially residential
 homestead, greatly affect the tax base of all of Minnesota.

 Residential Proportion of Area’s Total EMV by Property Type for Assessment 2022
 Total EMV (in millions)

 Property Type Twin Cities Metro Area Non-Metro Cities Greater Minnesota

 Homestead 62.3% ― $325,188 58.3% ― $32,497 36.2% ― $146,192
 Non-Homestead 10.2% ― $52,987 11.3% ― $6,303 5.1% ― $20,517
 Table 5

 Aggregate EMV sharply increased for both residential homestead EMV and non-homestead EMV, and we
 again see larger increases in non-homestead compared to homestead across all regions. These increases
 were all at least double the increase in assessment 2021 and the previous 2016-2020 averages. This
 represents a significant increase in the residential tax base, as homesteaded property EMV was already
 more than five times the next highest EMV statewide ($427.9 billion in 2021, next highest is agricultural
 homestead land at $81.1 billion). Given the large increase this past year, this gap is only increasing.

 Percent Change in Residential Aggregate EMV
 (Average EMV is the Average Change from 2016-2020)

 Average 2021 2022 Average Non- 2021 Non- 2022 Non-
 Region Homestead Homestead Homestead Homestead Homestead Homestead
 EMV EMV EMV EMV EMV EMV

 Twin Cities Metro
 6.4% 4.5% 16.6% 7.2% 11.8% 27.0%
 Area

 Non-Metro Cities 6.0% 5.0% 16.2% 6.1% 12.4% 28.2%

 Greater Minnesota 6.1% 5.7% 20.8% 5.7% 19.6% 34.6%
Table 6

 Percent Change in Agricultural HGA EMV
 (Average EMV is the Average Change from 2016-2020)

 Average 2021 2022
 Average CC
 Region Aggregate Aggregate Aggregate 2021 CC EMV 2022 CC EMV
 EMV
 EMV EMV EMV

 Statewide 4.7% 6.2% 17.8% 3.7% 2.8% 15.5%
Table 7

 2023 Property Values and Assessment Practices Report 13
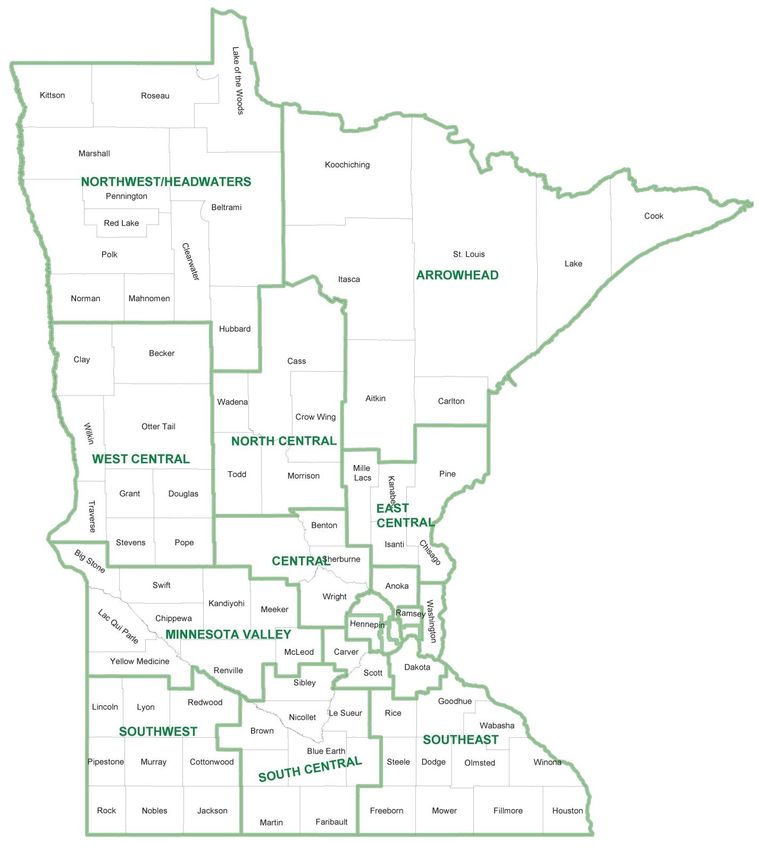
Value Trends in 2022

 Percent Change in Residential CC EMV
 (Average EMV is the Average Change from 2016-2020)

 Average 2021 2022 Average Non- 2021 Non- 2022 Non-
 Region Homestead Homestead Homestead Homestead Homestead Homestead
 EMV EMV EMV EMV EMV EMV

Twin Cities Metro
 5.1% 4.1% 16.9% 6.3% 4.5% 16.0%
 Area

Non-Metro Cities 4.8% 5.0% 16.9% 4.9% 5.3% 16.4%
 Greater
 4.6% 5.3% 20.3% 4.2% 5.3% 19.7%
 Minnesota
Table 8
 We see similar increases to homestead CC EMV as to aggregate EMV, which suggests that much of these
 increases are due to increase in value rather than new construction or classification changes. As with last
 year, Greater Minnesota saw larger increases in both CC and aggregate EMV than the Metro area, which
 is a reversal of the trend we saw from 2016-2020. Agricultural Homestead HGA, which is almost entirely
 located in Greater Minnesota (91%), also saw larger increases in aggregate and CC EMV compared to
 previous years, with the 2021 increase in aggregate EMV even higher than that of the 2016-2020 average.
 Non-Metro cities saw similar increases to the Metro in aggregate and CC EMV this year after seeing
 increases more aligned with Greater Minnesota last year.
 One point of note is that the increase in aggregate non-homestead EMV for assessment year 2021 was
 originally much higher as reported on PRISM 2 and in the 2022 Assessment Practices Report, with a
 similar EMV added to aggregate homestead EMV. Because there is much more homestead EMV than
 non-homestead, these changes can significantly alter the percentage increase of non-homestead EMV.
 This suggests that there were more mid-year homesteads, which flattened out the 2021 numbers.
 Especially given this years’ high increase in non-homestead EMV, this provides an important reminder
 that EMV numbers for residential properties can fluctuate based on homestead status.
 For more specific geographic breakdowns, we can use the geographic regions from the Property Tax
 Burden (Voss) Report. This breaks the state into twenty separate regions and allows us to examine if there
 were disproportionate increases in certain areas of the Metro or of Greater Minnesota. See a map of the
 different Voss regions in appendix F.
 Looking at residential homestead by Voss region, we see that the largest percentage increases were in
 North Central and East Central Minnesota; these regions also have lower EMV to begin with, although
 residential property makes up over 56% of all EMV in East Central Minnesota. For regions falling inside
 the Metro, there was a large gap: Washington, Anoka, and Carver/Scott all increased by more than 20%,
 which is especially significant given that residential homesteads already make up over two-thirds of all
 EMV in the region. This is contrasted by Minneapolis, with by far the lowest increase of all regions at
 only 6%, and Southeast Hennepin and Saint Paul following at 12.5% and 13.3% respectively. These
 regions also had a lower proportion of homestead EMV compared to the Metro regions that saw larger
 increases. Meanwhile the lowest increase in a region in Greater Minnesota was 16.3% in Southeast
 Minnesota, meaning that regions in Greater Minnesota had much less of a gap compared to the Metro.

 14 Minnesota Department of Revenue – Property Tax Division
Value Trends in 2022

Region Arrowhead Central East Minnesota North Northwest/ South Central
 Central Valley Central Headwaters

Change
 20.2% 21.6% 24.2% 17.5% 28.1% 20.6% 19.6%
Nominal EMV in
 $22,408 $37,158 $13,981 $9,217 $14,177 $8,523 $14,446
millions and % of
 (47.6%) (59.2%) (56.8%) (25.0%) (37.0%) (26.1%) (31.4%)
regional EMV

Region West
 Southeast Southwest Central Anoka Carver/Scott Dakota Minneapolis

Change
 16.3% 17.6% 16.5% 20.7% 22.0% 15.8% 6.0%
Nominal EMV in
 $37,172 $4,886 $16,567 $36,791 $32,447 $46,673 $29,055
millions and % of
 (44.1%) (13.7%) (32.7%) (72.1%) (67.8%) (67.5%) (44.2%)
regional EMV

Region Southeast Southwest
 Washington
 North Hennepin Saint Paul Hennepin Hennepin Suburban Ramsey

Change
 18.2% 13.3% 12.5% 18.0% 15.0% 22.1%
Nominal EMV in
 $30,768 $18,064 $30,832 $43,627 $23,167 $33,918
millions and % of
 (66.2%) (53.1%) (56.0%) (64.5%) (63.2%) (70.2%)
regional EMV

Table 9

 Seasonal Recreational Residential Property
 Seasonal residential recreational (cabins) saw some of the largest increases in aggregate EMV of any
 property type, and the highest increase in CC EMV of all property types. The aggregate EMV increase of
 27.8% was the largest increase for cabins since at least 2005 when our data begins, and the first increase
 of more than double-digits since between 2005-2007. CC EMV increased at almost the same rate,
 suggesting that the majority of this large increase was simply due to increasing value for cabin property.
 Cabin CC EMV increased at a higher rate than any other type of property, suggesting that, on average
 across the state, a cabin’s market value increased by 25% without any new construction or changes to the
 classification of the property.

 Percent Change in Seasonal Recreational Residential EMV
 (Average EMV is the Average Change from 2016-2020)

 Average 2021 2022
 (2022 Nominal Average CC
 Aggregate Aggregate Aggregate 2021 CC EMV 2022 CC EMV
 EMV in millions) EMV
 EMV EMV EMV

 Statewide
 2.9% 4.7% 27.8% 2.6% 5.4% 25.0%
 ($38,553)
 Table 10

 2023 Property Values and Assessment Practices Report 15
Value Trends in 2022

 While cabins have one of the lowest statewide market shares of the major property types we examine
 (higher only than industrial and agricultural homestead HGA), they represent a little over 9% of all
 Greater Minnesota’s EMV, which is fourth most in the region (after residential homestead, agricultural
 homestead land, and agricultural non-homestead land). This makes them an important part of the local tax
 base, as well as the state tax base as one of the property types that pays into the state general tax base.

 Commercial/Industrial Property
 Starting with the 2020 Assessment Practices report, commercial property has been reviewed
 independently from industrial property due to trends showing commercial property EMV is increasing at
 a much lower rate than industrial property EMV.

 Properties that are considered commercial include office buildings, retail stores, malls, hotels, banks,
 restaurants, and service outlets. We also include seasonal recreational commercial properties within the
 commercial section. Industrial properties include property used for manufacturing, warehouses, and
 distribution facilities.

 Commercial Property

 Percent Change in Commercial EMV
 (Average EMV is the Average Change from 2016-2020)

 Region
 (2021 Nominal Average 2021 2022
 Average CC
 EMV in millions Aggregate Aggregate Aggregate 2021 CC EMV 2022 CC EMV
 EMV
 and % of total EMV EMV EMV
 regional EMV)

Twin Cities Metro
 Area 4.1% -2.1% 2.4% 3.4% -2.8% 1.9%
 ($49,250; 9.4%)
Non-Metro Cities
 2.9% 0.7% 6.3% 2.0% -1.4% 4.9%
($8,536; 15.3%)
 Greater
 Minnesota 2.4% -0.2% 8.6% 1.1% 0.6% 6.3%
 ($13,491; 3.3%)
Table 11

 Commercial property rebounded after seeing decreases in both aggregate and CC EMV in 2021; however,
 similar to 2021 there were pronounced regional differences. In the Metro, where just over 69% of all
 commercial EMV is located, the increases in both aggregate and CC EMV were lower than the 2016-2020
 average and the 2.4% increase in aggregate EMV is the lowest since 2014 (other than in 2021).
 Meanwhile in non-metro cities and Greater Minnesota, which both fared better than the Metro in 2021,
 saw increases more than double their 2016-2020 averages in both aggregate and CC EMV. For non-metro
 cities, this represents the largest increase since 2008, and the largest for Greater Minnesota since 2007.

 16 Minnesota Department of Revenue – Property Tax Division
Value Trends in 2022

 Commercial property is especially important to the tax base because it, like industrial property, has the
 highest classification rate of all major property types in addition to paying into the state general tax. As a
 result, commercial property generally maintains about twice the net tax share as market value statewide,
 whereas residential and agricultural properties usually have a higher market value share than net tax share
 (see the Tax Distribution section for more info). Chart 7 shows the percentage of regional EMV for
 commercial property for all three regions, as well as statewide, and Chart 8 shows the commercial
 aggregate EMV by year broken out by region. These charts show that over the last decade, despite
 commercial EMV mostly increasing, the market value share of commercial property compared to other
 property types has decreased. This trend has accelerated since 2020, with commercial property’s share of
 regional EMV dropping in all regions, leading to a 2% decrease statewide. This shows the effect of the
 difference in EMV increases for commercial property compared to other property types- less of the tax
 base is commercial, which results in other property types taking on more of the tax share.

 Commercial EMV as Percentage of Regional Total EMV
25.0%

20.0% 19.4% 19.4%
 19.0% 19.2% 19.2%
 18.5% 18.7% 18.6% 18.6%
 18.0% 18.0%
 17.3% 17.3%
 16.9%
 16.4% 16.4% 16.3% 16.6%

 15.3%
15.0%
 13.5% 13.4% 13.3% 13.7% 13.6%
 13.1%
 12.7% 12.9% 12.6%
 12.2% 12.3%
 11.8%
 11.4% 11.4% 11.4%
 10.9% 10.9% 10.7%
 10.0% 10.1% 9.9% 9.8% 9.7%
10.0% 9.4% 9.3% 9.4%
 8.9% 8.8% 8.9% 8.8% 9.1% 9.1% 9.1% 8.8% 8.6% 8.6%
 8.2%
 7.3%

 4.5% 4.4% 4.3% 4.3% 4.5% 4.5% 4.4% 4.4% 4.2%
 5.0% 3.9% 3.9%
 3.7% 3.8% 3.8% 3.8% 3.8% 3.8% 3.7%
 3.3%

 0.0%
 2004 2005 2006 2007 2008 2009 2010 2011 2012 2013 2014 2015 2016 2017 2018 2019 2020 2021 2022

 NonMetroCities Metro Statewide Greater MN
Chart 7

 2023 Property Values and Assessment Practices Report 17
Value Trends in 2022

 Commercial Aggregate EMV by Year
80,000,000,000

70,000,000,000

60,000,000,000

50,000,000,000

40,000,000,000

30,000,000,000

20,000,000,000

10,000,000,000

 0
 2004 2005 2006 2007 2008 2009 2010 2011 2012 2013 2014 2015 2016 2017 2018 2019 2020 2021 2022

 Metro Non-Metro Cities Greater Minnesota
Chart 8

 Industrial Property
 After smaller increases in both aggregate and steady EMV in 2021, industrial aggregate EMV increased
 by double-digits, while CC EMV increased at rates more than double that of the 2016-2020 average. The
 only region to not see aggregate increases greater than their previous average was non-metro cities, which
 has the lowest EMV of the three regions and therefore is more likely to have larger swings. Industrial
 property maintains the lowest statewide EMV of all property types (other than agricultural homestead
 HGA). Chart 9 shows how statewide industrial EMV has compared with other non-agricultural property
 types since 2004- industrial EMV has been steadily increasing since 2015 and was poised to surpass
 cabins before the latter’s large increase this year. Unlike cabins, the majority (78%) of industrial EMV is
 located in the Metro area. Given that apartments and commercial property are also mainly located in the
 Metro, this has meant that despite industrial EMV increases its share of EMV in the Metro has only
 increased by 0.9% in that same timeframe (3.8% in 2015 to 4.7% now).

 18 Minnesota Department of Revenue – Property Tax Division
Value Trends in 2022

 Percent Change in Industrial EMV
 (Average EMV is the Average Change from 2016-2020)

 Region
 (2022 Nominal Average 2021 2022
 Average CC
 EMV in millions Aggregate Aggregate Aggregate 2021 CC EMV 2022 CC EMV
 EMV
 and % of total EMV EMV EMV
 regional EMV)

Twin Cities Metro
 Area 10.4% 5.7% 15.1% 6.3% 3.8% 12.7%
 ($24,685; 4.7%)
 Non-Metro Cities
 12.4% 3.1% 10.4% 1.1% 0.5% 5.5%
 ($1,773; 3.2%)
 Greater
 Minnesota 8.4% 6.3% 10.9% 1.0% 0.8% 6.2%
 ($5,243; 1.3%)
Table 12

 Statewide EMV by Year by Property Type
80,000,000,000

70,000,000,000

60,000,000,000

50,000,000,000

40,000,000,000

30,000,000,000

20,000,000,000

10,000,000,000

 0
 2004 2005 2006 2007 2008 2009 2010 2011 2012 2013 2014 2015 2016 2017 2018 2019 2020 2021 2022

 Cabin Apartment Commercial Industrial
 Chart 9

 2023 Property Values and Assessment Practices Report 19
Tax Distribution

Taxable Market Value
In Minnesota, taxes are not directly based on the estimated market value. State property tax laws contain a
number of exclusions, value deferrals, and exemptions that decrease the amount of the EMV that is
subject to taxation.

Taxable Market Value (TMV) refers to the amount of value that is actually used in calculating property
taxes. This often differs from EMV due to special programs and exclusions. Sample TMV calculations
can be found in the Property Tax Administrator’s Manual, available at www.revenue.state.mn.us.

Taxable market value not only decreases an individual property’s tax burden, it also decreases the tax
base for the taxing jurisdiction. The taxable market value is used to determine the tax base for levying
authorities (cities, counties, towns, etc.).

For example, a given county’s levy (budget) is spread among all classes of taxable property by
determining the cumulative net tax capacity of all the properties. The net tax capacity (taxable market
value multiplied by the class rate) of all taxable properties in a jurisdiction is the tax base.

A simple illustration of how property tax rates are determined is shown below:

 Step 1: Total proposed budget
 − All non-property tax revenue (state aids and fees)
 = Property tax revenue needed

 Step 2: Property tax revenue needed
 ÷ Total tax capacity of all taxable properties
 = Local tax rate

When taxable market values change, the tax burden is redistributed within the jurisdiction. If the levy
remains constant, property taxes for a single property may still change depending on changes in the
classification rate or taxable market value of other properties in the jurisdiction. Table 13 provides figures
for some of the more common exclusions and deferrals that remove taxable value from the tax base, while
Chart 10 shows the historical figures of the percent change in TMV for major property groups since 2013.

 20 Minnesota Department of Revenue – Property Tax Division
Tax Distribution

 Value Exclusions and Deferrals

 All Values in Millions

 Exclusion/Deferral 2021 Value 2022 Value % Change

 Homestead Market Value Exclusion $21,249 $16,626 -21.8%

 Veterans with a Disability Exclusion $3,862 $4,307 11.5%

 Green Acres $2,683 $3,665 36.6%

 Open Space $731 $770 5.3%

 Rural Preserve $599 $773 29.1%

 Plat Law $421 $696 65.5%

 Table 13

 Percent Change in Taxable Market Value by Property Class
 Assessment Years 2013-2022
 2013 2014 2015 2016 2017 2018 2019 2020 2021 2022
30.0%

25.0%

20.0%

15.0%

10.0%

 5.0%

 0.0%

-5.0%
 Agricultural Apartment Commercial Industrial Residential Seasonal
 Chart 10 Land Non-Commercial

 2023 Property Values and Assessment Practices Report 21
Tax Distribution

 Exclusion and Deferral Trends
 As indicated in Table 11, the sharp increase in residential and agricultural homestead EMV led to a large
 decrease in the homestead market value exclusion (HMVE) between 2021 and 2022. Chart 11 shows the
 breakdown of what homesteads receive for the market value exclusion, broken down by percentages per
 $5,000 increment.6 This shows the effect of steadily increasing residential values. In 2017, a plurality of
 homes received between $20,000-$25,000 of exclusion, and 43.4% saw over $20,000 excluded. The
 largest exclusion that can be received is just over $30,400 for homesteads worth $76,000. Examining the
 portion of homes that receive above or below the midpoint (approximately $15,000), we see that in 2017,
 64% received over $15,000 in exclusion. Looking at the initial 2022 data, the distribution has reversed:
 only around 33% receive over $15,000, meaning that almost 66% receive under $15,000 in exclusion.
 Additionally, a plurality (24.5%) of homesteads now receive no market value exclusion, up from only 9%
 in 2017. These changes compound with the increase in homesteaded property’s EMV to result in even
 more of the tax base shifting to residential and agricultural homesteaded properties.

 Annual Percentage Breakdown of HMVE Value
 (in $5,000 increments)
100.0%
 7.9%
 14.5% 12.9% 11.5%
 90.0% 19.1% 16.5%
 10.7%
 80.0% 15.2%
 17.1%
 18.9%
 21.7% 14.2%
 70.0%
 24.3%
 19.4%
 60.0%
 20.6% 16.5%
 20.7%
 50.0% 20.9%
 20.7% 17.5%
 14.4%
 40.0% 16.7%
 15.8%
 14.3%
 30.0% 12.1% 10.4%
 13.0%
 11.0%
 10.2%
 20.0% 9.2%
 8.1% 7.9%
 6.5% 7.1%
 5.8% 24.5%
 10.0% 4.9%
 13.3% 15.1%
 10.5% 12.2%
 9.0%
 0.0%
 2017 2018 2019 2020 2021 2022

 None 0-5K 5-10K 10-15K 15-20K 20-25K 25-30.4K Over Max. Veterans Exclusion
 Chart 11

 6
 Some parcels receive above the maximum Homestead Market Value Exclusion amount due to there being multiple
 homesteads on the parcel (parcels that have multiple houses, housing cooperatives, etc.). Parcels also cannot receive a HMVE
 if they are also receiving a homestead exclusion for veterans with a disability. Both categories make up under 1.5% of parcels
 for all years in the chart.

 22 Minnesota Department of Revenue – Property Tax Division
Tax Distribution

The Homestead Exclusion for Veterans with a Disability amount continued to increase. While the
exclusion had steadily increased by around 10% between 2013-2019, it had only seen increases of around
5% in 2020 and 2021, leading to questions of whether the exclusion was flattening out. This years’
increase of 11.5% represents a return to previous levels. While we cannot say definitively why exclusion
amounts have continued to increase, more properties continue to receive the exclusion annually (over
1,000 between 2021 and 2022), suggesting that qualifying veterans are continuing to learn about the
program and apply.

Plat law saw its largest increase for the deferral since our data begins in 2004, increasing by around $275
million. This is expected given the large increases in EMV and residential EMV in particular, suggesting
that there was increased development. While this is still a large amount of deferred value, it only
represents 0.05% of all residential market value for assessment year 2022. Regardless, this magnitude of
new market value being deferred under the program shows the extent of development. Given that this
exclusion only provides a deferral for a limited number of years per parcel7 and can be cut short due to
new construction or the transfer of the property, it is possible that the large increase in deferred value this
year will abruptly end sometime in the coming years.

Open Space increased by a little over 5%, which again is somewhat expected given the increased
development. Open Space is a program that has comparatively few properties enrolled, which can result
in large swings based on enrollment and reporting.

Green Acres and Rural Preserve
Green Acres and Rural Preserve are property tax deferral programs that help keep farm property values
from increasing due to non-agricultural influences such as development or recreational uses on nearby
properties. The taxable market value of qualifying farmland is based on its agricultural use, rather than its
highest and best use (which may be impacted by sales of nearby land for development or speculation).

The Department of Revenue determines a Green Acres value for tillable and non-tillable class 2a
agricultural land for each county to reflect market and agricultural conditions. Counties use the Green
Acres value when calculating property taxes. Rural Preserve provides a similar benefit for class 2b rural
vacant land that is part of a farm. (See Appendix D for details about Green Acres and Rural Preserve
values for the 2022 assessment.)

7
 Plat Law phases in new market value when raw land is platted into a subdivision. The new value is phased in over three years
in the Metro, or seven years in Greater Minnesota (and some exceptions in the Metro).

 2023 Property Values and Assessment Practices Report 23
Tax Distribution

Green Acres Values: 2022 Assessment Year Impact
For assessment year 2022 (taxes payable 2023), statewide taxable values of agricultural land increased by
13.9%, 0.6% less than the increase in aggregate EMV due to Green Acres and Rural Preserve. Data for
Green Acres and Rural Preserve for the last three years is shown in Table 14.

The percentage of value deferred for Green Acres increased to the highest value since at least 2016,
despite the double-digit increase in agricultural land EMV, emphasizing the even higher increases in other
classification’s EMV and increased development pressure. Enrolled market value increased by almost
14% from 2021, despite a decrease in the number of enrolled acres (from 3.093 million in 2021 to 3.021
million in 2022). This resulted in almost $1 billion increase in deferred value, a 36.6% increase from
2021.

Rural Preserve also saw large increases in enrolled and deferred value, despite enrolled acreage
decreasing by around 2,000 acres. Rural Preserve actually had a higher percent of market value deferred
in 2019 that sharply dropped in 2020, though that was partly due to a small number of counties that
contained a disproportionately large amount of deferred value changing their base values between 2019
and 2020.

 Green Acres and Rural Preserve Deferrals
All Values in Millions
Green Acres 2020 2021 2022
Enrolled Market Value $14,725 $14,719 $16,767
 Taxable Value $11,972 $12,036 $13,102
 Deferred Value $2,753 $2,683 $3,665
 Percent Deferred* 18.7% 18.2% 21.9%

Rural Preserve 2020 2021 2022
 Enrolled Market Value $1,377 $1,373 $1,605
 Taxable Value $788 $774 $832
 Deferred Value $589 $599 $773
 Percent Deferred* 42.7% 43.6% 48.1%
 * Percent Deferred = Percentage of Total EMV (Deferred Value + Taxable Value) that received deferral
 Table 14

The large increases in Green Acres and Rural Preserve this year show the importance of the program,
providing a tax deferral to enrolled agricultural and rural vacant land in the face of increased development
pressure.

Tax Distribution
Minnesota’s property tax system has several components including classification, valuation, and special
programs that reduce taxable value, credits, and different levies. These components determine which
properties will pay a greater or lesser share of taxes.

 24 Minnesota Department of Revenue – Property Tax Division
Tax Distribution

Taxable Value
The nature of Minnesota’s property tax system is that if the taxable value of one class of property
decreases, it pays a smaller share of the overall tax burden and other property classes pay a larger share.

For example, agricultural and homesteaded properties have typically received preferential property tax
treatment through classification rates and programs – such as Green Acres and the Homestead Market
Value Exclusion – and through homestead credits and school bonding credits,

Conversely, commercial/industrial properties typically pay a greater share of taxes than residential or
agricultural properties of equal value due to a higher class rate, lesser eligibility for special programs, and
being subject to additional levies such as the state general tax. (See Appendix C for details about the
classification rates used for the 2022 assessment.)

The impact of these components is clear when reviewing tax liability and effective tax rates. Based on
preliminary estimates from the 2022 assessment year (taxes payable 2023):

 • Agricultural property and rural vacant land represent around 15% of taxable property value and
 pay a bit more than 5% of net property taxes statewide. (See Table 12, next page.)

 • Residential property makes up almost 60% all market value and pays just over 54% of all net
 property taxes

 • Commercial property accounts for about 7.4% of market value and pays 17% of property taxes.

 • Industrial property accounts for about 3% of market value and pays about 8% of property taxes.

These numbers are affected by where the majority of each property type is located and the surrounding
tax base, but they still provide insight into how different classifications contribute to the tax base.

2022 Trends
Net Tax Liability
Table 13 shows the net tax and tax share for each major property class. The numbers in italics represent
the percent change in the market value and net tax share from last year.

Agricultural and Residential Property
Despite increases in EMV, market value share of agricultural property continued to decrease, continuing a
downward trend since 2014. These decreases have slowed in the last two years, only decreasing by 0.5%
and 0.7% compared to previous decreases that were around 1% or higher; agricultural market share had
been 21% as recently as 2016. While last year’s decreases were due to other property types not increasing
as much and agricultural land staying steady, this year saw a lower decrease due to other property types
seeing much higher increases than normal. Green Acres and Rural Preserve also have helped temper the
higher increase in agricultural land’s aggregate EMV.

 2023 Property Values and Assessment Practices Report 25
Tax Distribution

 Net Tax Liability and Tax Share by Property Class
 Assessment Year 2022, Taxes Payable 2023 (Preliminary Estimates)
 Market Value Net Tax Market Value Net Tax
 Properties by Class
 (Millions) (Millions) Share Share
 Agricultural/Rural Vacant $145,606 $636 15.3% (-0.5%) 5.2% (-0.2%)
 Residential $563,571 $6,649 59.1% (+1.6%) 54.2% (+1.9%)
 Apartments $64,456 $922 6.8% (-0.1%) 7.5% (-0.1%)
 Seasonal (Non-Commercial) $38,541 $303 4.0% (+0.2%) 2.5% (+/- 0%)
 Commercial $70,560 $2,081 7.4% (-1.0%) 17.0% (-1.6%)
 Industrial $31,698 $949 3.3% (-0.1%) 7.7% (+/- 0%)
 All Other $39,671 $718 4.2% (+/- 0%) 5.9% (+0.1%)
 Total Real & Personal $954,105 $12,259 100.0% 100.0%
 Table 15 Please note that due to rounding, there may be some small differences between the listed totals and sums of all classes.

Residential property continues to see larger market value and net tax share due to the large increases in
EMV. The past two years have seen increases greater than 1% to both market value and net tax share, and
have also seen tax share increases larger than market value increases. This is likely due to a multitude of
factors, such as decreases in other property’s market value share that pay more in tax (such as commercial
property), but it also corresponds with the large decreases in value from the Homestead Market Value
Exclusion this year. The consistent increases have meant that both the residential market value and net tax
share has risen by around 6% since 2016 (52.8% and 48.5% in 2016 respectively). It is important to note
that the percentage of tax share varies considerably by region as shown in Table 9 in the Residential
section; while the statewide proportions can inform general trends, each taxing jurisdiction will have its
own breakdown of the tax base.

Commercial and Industrial Property
For commercial property, market value share dropped by a full percent following a smaller increase in
aggregate EMV compared to other property types. This is the largest decrease in both market value and
net tax share since at least 2017. This is especially significant given that commercial property has a higher
classification rate and therefore generally pays more tax, so it takes more market value of other property
types to make up the same net tax capacity. Commercial properties still pay the second highest share of
net tax behind residential property, though residential property has seen increases rather than decreases in
net tax share. Industrial property market value share and net tax share were virtually unchanged.

 26 Minnesota Department of Revenue – Property Tax Division
You can also read