2023 Medicaid and CHIP Beneficiary Profile: Enrollment, Expenditures, Characteristics, Health Status, and Experience - Released April 2023
←
→
Page content transcription
If your browser does not render page correctly, please read the page content below
2023 Medicaid and CHIP Beneficiary
Profile: Enrollment, Expenditures,
Characteristics, Health Status, and
Experience

                          Released April 2023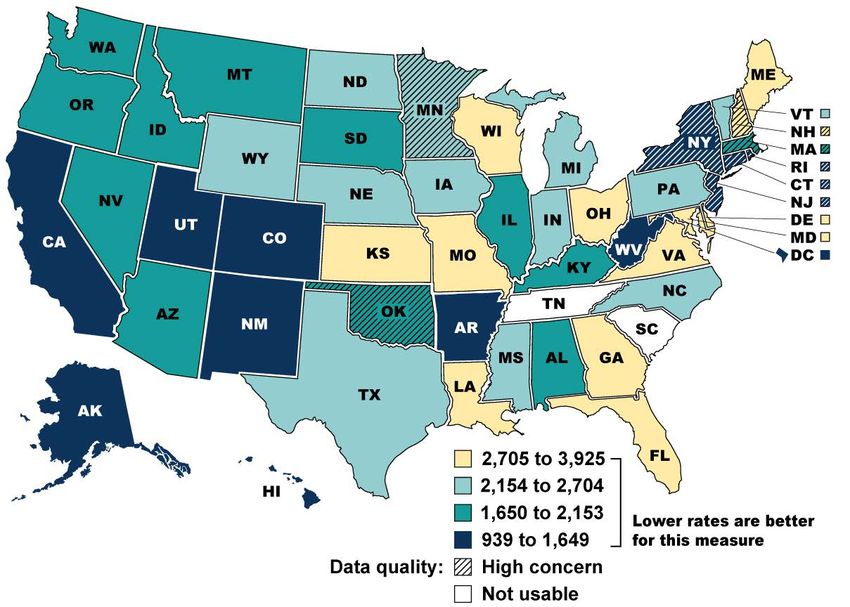
Introduction

The Medicaid and Children’s Health Insurance Program (CHIP) Beneficiary Profile
provides an overview of Medicaid and CHIP enrollment, expenditures, characteristics,
health status, and experience of the beneficiaries served by Medicaid and CHIP. It is not
intended as a comprehensive assessment of Medicaid and CHIP.

• The charts in the profile are based on the most recent data sources that allowed for
  meaningful comparative analysis. Most exhibits are based on publicly available,
  published data sources. Some exhibits are based on primary analyses of Centers for
  Medicare & Medicaid Services (CMS) claims and other administrative data.
• The data sources included in the profile vary in terms of the time frame available and
  the populations included. Please refer to the sidebar on each chart for notes (including
  populations excluded from the data), data sources, and links (where available). Please
  refer to the Appendix for more information on each data source.

More information about the Medicaid and CHIP programs, their beneficiaries, and the
quality of care is available in the following additional resources:

• 2023 Medicaid and CHIP Beneficiaries at a Glance shows key highlights from the
  Medicaid and CHIP Beneficiary Profile. It is available at:
  https://www.medicaid.gov/medicaid/quality-of-care/index.html.                               Suggested Citation:
                                                                                              Center for Medicaid and CHIP
• CMS developed the Medicaid and CHIP Scorecard to increase public transparency               Services, Division of Quality and
  and accountability about the programs’ administration and outcomes. It is available at:     Health Outcomes. 2023 Medicaid
                                                                                              and CHIP Beneficiary Profile.
  https://www.medicaid.gov/state-overviews/scorecard/index.html.                              Centers for Medicare & Medicaid
• More information on the measurement of quality of care in Medicaid and CHIP,                Services. Baltimore, MD. Released
                                                                                              April 2023.
  including the Child and Adult Core Sets of health care quality measures, is available at:
  https://www.medicaid.gov/medicaid/quality-of-care/index.html.

2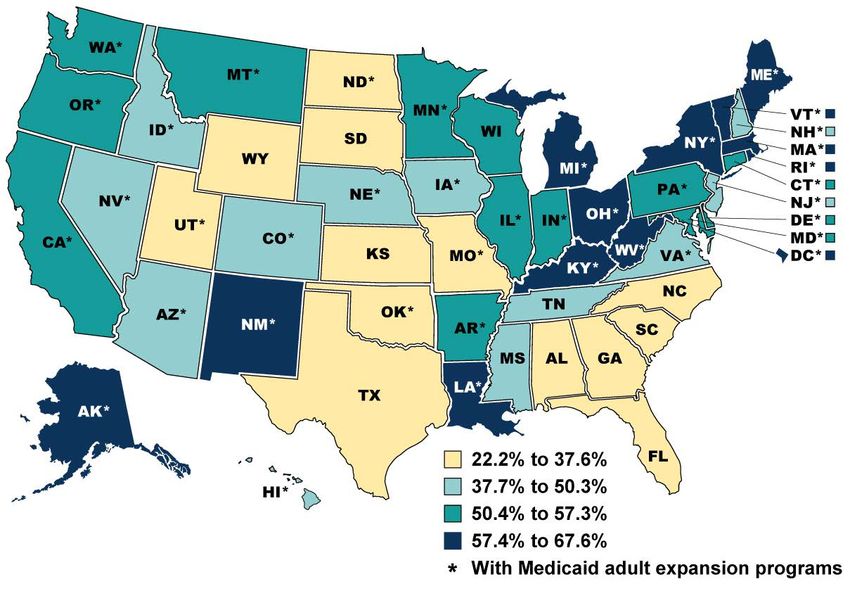
Table of Contents

About the Medicaid and CHIP Beneficiary Profile…………………………………..     4

Medicaid and CHIP Enrollment………..…...…...…...…………………………..…..       6

Beneficiary Expenditures…….………………………………………………………..                 14

Beneficiary Characteristics ……………………….…………………………………..              18

Beneficiary Health Status……………….……………………………………………..                24

Beneficiary Experience………………………………………………………………...                  34

Special Topic: Health-Related Social Needs ……..…………………...…………...   43

Appendix: Data Sources……………………………………………………………….                    54

3
ABOUT THE MEDICAID AND CHIP
       BENEFICIARY PROFILE

4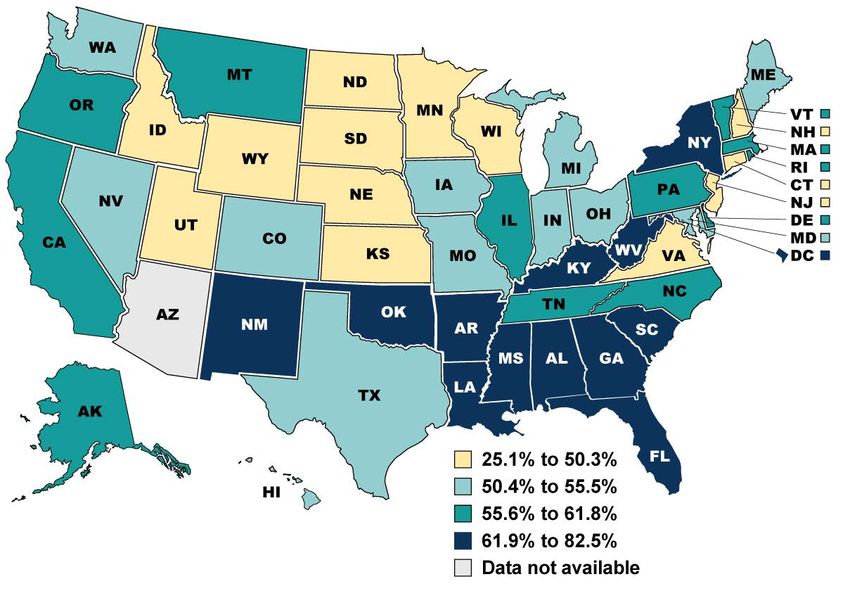
About the Medicaid and CHIP Beneficiary Profile

The Medicaid and CHIP Beneficiary Profile provides an overview of Medicaid     Unless otherwise noted,
                                                                               charts include all Medicaid
and CHIP enrollment, expenditures, characteristics, health status, and         and CHIP beneficiaries in
experience of the beneficiaries served by Medicaid and CHIP. This profile      the 50 states and the
release also contains a special section devoted to the health-related social   District of Columbia. One
needs for children and adults covered by Medicaid and CHIP.                    notable exclusion is
                                                                               institutionalized
                                                                               individuals; surveys tend
As the agency responsible for ensuring quality health care coverage for        to exclude such individuals
                                                                               from their samples. Please
Medicaid and CHIP beneficiaries, CMS plays a key role in promoting quality     refer to the sidebar on each
health care for adults and children in Medicaid and CHIP.                      chart for notes (including
                                                                               exclusions), data sources,
                                                                               and links (where available).
The profile covers the following domains:                                      Please refer to the
• Medicaid and CHIP Enrollment                                                 Appendix for more
                                                                               information on data
• Beneficiary Expenditures                                                     sources.
• Beneficiary Characteristics
• Beneficiary Health Status
• Beneficiary Experience
• Special Topic: Health-Related Social Needs

5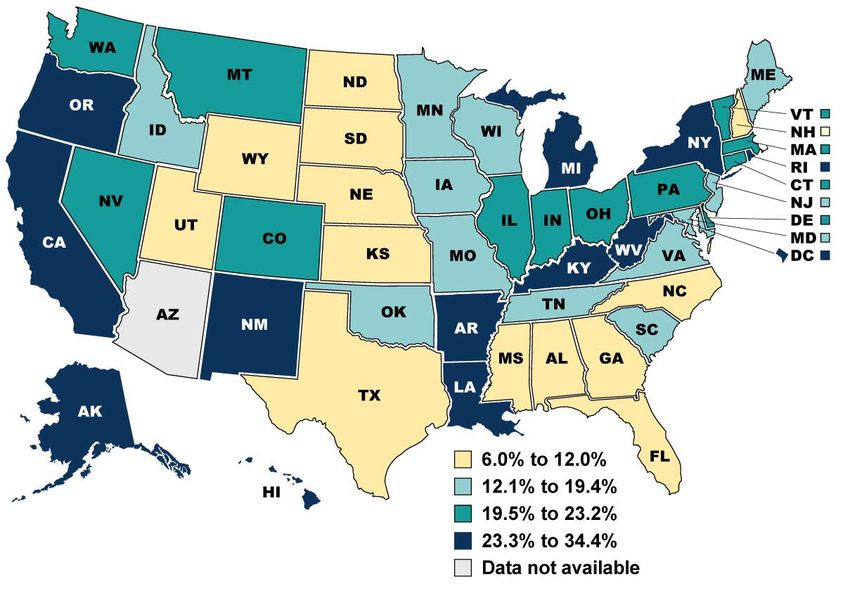
MEDICAID AND CHIP ENROLLMENT

6
Medicaid and CHIP Enrollment

Fast fact: As of November 2022, Medicaid and CHIP covered
more than 91.7 million individuals in the United States (slide
8).

This section of the profile provides context on Medicaid and CHIP enrollment.

The charts in this section include:
• National Medicaid and CHIP Enrollment Trends
• Percentage of Child and Adult Population Enrolled in Medicaid or CHIP, by
  State
• Percentage of Child Population Enrolled in Medicaid or CHIP, by State
• Percentage of Adult Population Enrolled in Medicaid or CHIP, by State
• Percentage of Medicaid Beneficiaries in Comprehensive Managed Care,
  by State
• Percentage of Medicaid Beneficiaries Who Were Dually Eligible for
  Medicare and Medicaid, by State

7
National Medicaid and CHIP Enrollment Trends
(in millions), February 2020 – November 2022
Population: Beneficiaries of all ages with full Medicaid or CHIP benefits

                                                                             From February 2020 to
                                                                             November 2022, national
                                                                             Medicaid and CHIP
                                                                             enrollment increased by
                                                                             approximately 21 million
                                                                             individuals (almost 30%).

                                                                            Notes: Enrollment totals represent the total
                                                                            unduplicated number of individuals enrolled
                                                                            in Medicaid and CHIP as of the last day of
                                                                            the reporting period. These figures are
                                                                            point-in-time counts of program enrollment
                                                                            and include only those individuals with
                                                                            comprehensive benefits. The Families First
                                                                            Coronavirus Response Act (FFCRA) made
                                                                            available a temporary 6.2 percentage point
                                                                            increase to each state or territory's federal
                                                                            medical assistance percentage (FMAP). As
                                                                            a condition of receiving the FMAP increase,
                                                                            states must meet several requirements
                                                                            pertaining to eligibility and maintenance of
                                                                            enrollment.

                                                                            Source: CMS. November 2022 Medicaid
                                                                            and CHIP Enrollment Trends Snapshot.
                                                                            Figure 1 and Appendix A.

                                                                            Available at:
                                                                            https://www.medicaid.gov/medicaid/program
                                                                            -information/medicaid-chip-enrollment-
                                                                            data/medicaid-and-chip-enrollment-trend-
                                                                            snapshot/index.html

  8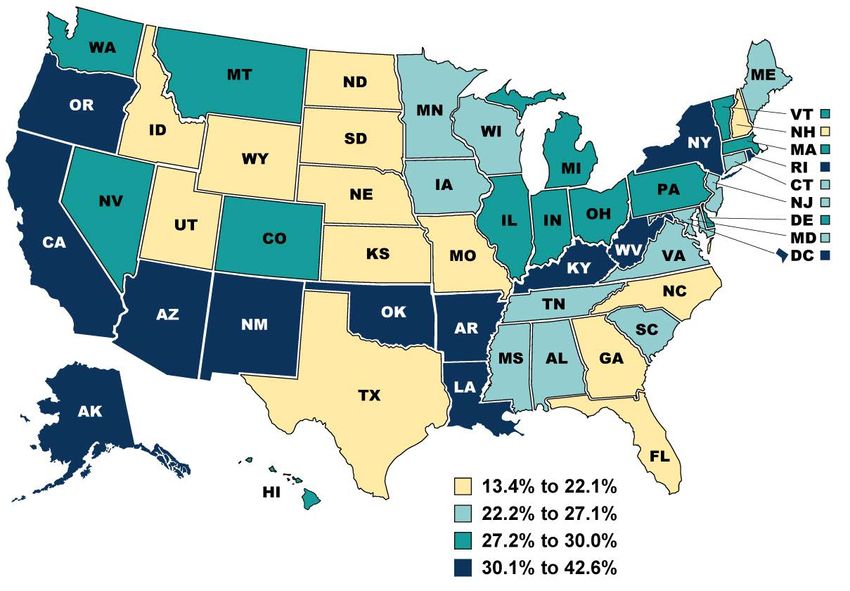
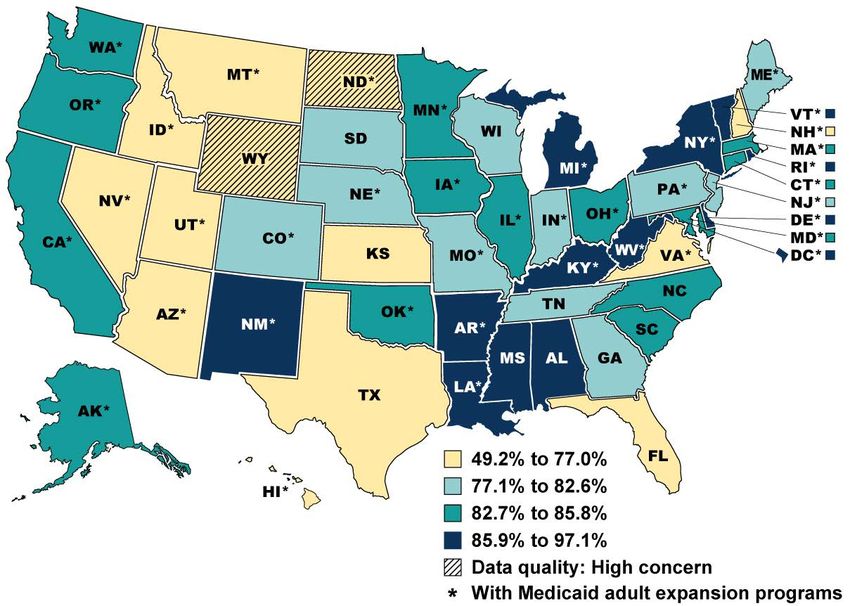
Percentage of Child and Adult Population Enrolled
in Medicaid or CHIP, by State, July 2022
Population: Beneficiaries of all ages with full Medicaid or CHIP benefits

                                                                            Notes:
                                                                            Enrollment in Medicaid or CHIP includes
                                                                            individuals with full Medicaid or CHIP
                                                                            benefits and excludes individuals who are
                                                                            eligible only for restricted benefits, such
                                                                            as Medicare cost-sharing, family
                                                                            planning-only benefits, and emergency
                                                                            services-only benefits. The percentage of
                                                                            each state’s population enrolled in
                                                                            Medicaid or CHIP was calculated by
                                                                            dividing administrative, monthly point-in-
                                                                            time counts of Medicaid and CHIP
                                                                            enrollment by estimates of each state’s
                                                                            resident population. Results were
                                                                            rounded to one decimal place, and then
                                                                            states were assigned to quartiles.

                                                                            Sources:
                                                                            CMS. Updated July 2022 Applications,
                                                                            Eligibility, and Enrollment Data (as of
                                                                            November 3, 2022).
                                                                            Available at:
                                                                            https://www.medicaid.gov/medicaid/progr
                                                                            am-information/medicaid-and-chip-
                                                                            enrollment-data/monthly-
                                                                            reports/index.html

                                                                            U.S. Census Bureau. Estimates of the
                                                                            Resident Population for July 1, 2022.
                                                                            Table SCPRC-EST2022-18+POP.
                                                                            Available at:
                                                                            https://www.census.gov/data/tables/time-
                                                                            series/demo/popest/2020s-national-
                                                                            detail.html

9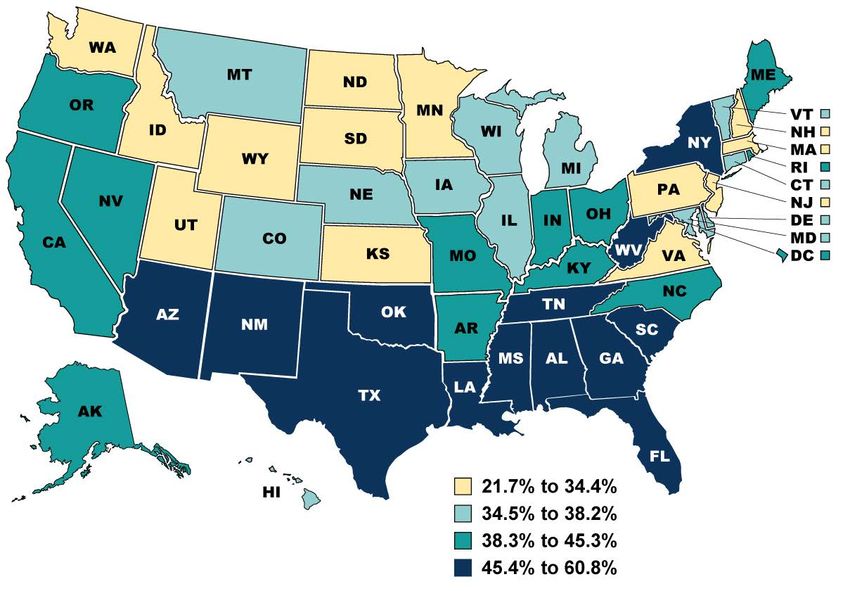
Percentage of Child Population Enrolled in
Medicaid or CHIP, by State, July 2022
Population: Beneficiaries up to age 19 with full Medicaid or CHIP benefits

                                                                             Notes:
                                                                             Enrollment in Medicaid or CHIP includes
                                                                             individuals with full Medicaid or CHIP
                                                                             benefits and excludes individuals who are
                                                                             eligible only for restricted benefits, such as
                                                                             Medicare cost-sharing, family planning-only
                                                                             benefits, and emergency services-only
                                                                             benefits. The percentage of each state’s
                                                                             population enrolled in Medicaid or CHIP was
                                                                             calculated by dividing administrative,
                                                                             monthly point-in-time counts of Medicaid
                                                                             and CHIP child enrollment by estimates of
                                                                             each state’s resident population of children.
                                                                             Children enrolled in Medicaid or CHIP in
                                                                             each state include children and adolescents
                                                                             up to age 19. Estimates of each state’s
                                                                             resident population include children under
                                                                             age 18. AZ did not report age-specific
                                                                             enrollment data to CMS. Results for all other
                                                                             states were rounded to one decimal place,
                                                                             and then states were assigned to quartiles.

                                                                             Sources:
                                                                             CMS. Updated July 2022 Applications,
                                                                             Eligibility, and Enrollment Data (as of
                                                                             November 3, 2022).
                                                                             Available at:
                                                                             https://www.medicaid.gov/medicaid/program
                                                                             -information/medicaid-and-chip-enrollment-
                                                                             data/monthly-reports/index.html

                                                                             U.S. Census Bureau. Estimates of the
                                                                             Resident Population for July 1, 2022. Table
                                                                             SCPRC-EST2022-18+POP.
                                                                             Available at:
                                                                             https://www.census.gov/data/tables/time-
                                                                             series/demo/popest/2020s-national-
                                                                             detail.html

10
Percentage of Adult Population Enrolled in
Medicaid or CHIP, by State, July 2022
Population: Beneficiaries age 19 and older with full Medicaid or CHIP benefits
Notes:
Enrollment in Medicaid or CHIP includes
individuals with for full Medicaid or CHIP
benefits and excludes individuals who are
eligible only for restricted benefits, such as
Medicare cost-sharing, family planning-only
benefits, and emergency services-only
benefits. The percentage of each state’s
population enrolled in Medicaid or CHIP was
calculated by dividing administrative,
monthly point-in-time counts of Medicaid
and CHIP adult enrollment by estimates of
each state’s resident population of adults.
Adults enrolled in Medicaid or CHIP in each
state include adults and seniors age 19 and
older. Estimates of each state’s resident
population include adults age 18 and over.
AZ did not report age-specific enrollment
data to CMS. Results for all other states
were rounded to one decimal place, and
then states were assigned to quartiles.
Sources:
CMS. Updated July 2022 Applications,
Eligibility, and Enrollment Data (as of
November 3, 2022).
Available at:
https://www.medicaid.gov/medicaid/program
-information/medicaid-and-chip-enrollment-
data/monthly-reports/index.html
U.S. Census Bureau. Estimates of the
Resident Population for July 1, 2022. Table
SCPRC-EST2022-18+POP.
Available at:
https://www.census.gov/data/tables/time-
series/demo/popest/2020s-national-
detail.html
11Percentage of Medicaid Beneficiaries in
Comprehensive Managed Care, by State, 2020
Population: Beneficiaries of all ages with full Medicaid or CHIP benefits
Nationally, 72.0% of
Medicaid beneficiaries
were enrolled in a
comprehensive managed
care plan in 2020.
Notes:
Medicaid enrollment in comprehensive
managed care represents an
unduplicated count of Medicaid
beneficiaries enrolled in a managed care
plan that provides comprehensive
benefits (acute, primary care, specialty,
and any other), as well as PACE
programs. It excludes beneficiaries who
are enrolled in a Financial Alignment
Initiative Medicare-Medicaid Plan as their
only form of managed care. Nine states
have less than 1% of beneficiaries in
comprehensive managed care. Results
for the remaining states were rounded to
one decimal place, and then states were
assigned to quartiles.
Source:
2020 CMS Managed Care Enrollment
Report.
Available at:
https://www.medicaid.gov/medicaid/mana
ged-care/enrollment-report/index.html
12Percentage of Medicaid Beneficiaries Who Were Dually
Eligible for Medicare and Medicaid, by State, 2021
Population: Beneficiaries of all ages with full Medicaid benefits
Nationally, 10.8% of
Medicaid beneficiaries
(8.6 million individuals)
were dually eligible for
Medicare and receive full
Medicaid benefits.
Notes:
The percentage of the Medicaid population
that is dually eligible by state was calculated
by dividing total, full-benefit, dual-eligible
enrollment by total Medicaid enrollment.
Results were rounded to one decimal place,
and then states were assigned to quartiles.
The national percentage was calculated by
dividing the sum of the state totals.
Sources:
CMS Medicare-Medicaid Coordination Office
Quarterly Enrollment Snapshot (December
2021 data, as of December 21, 2022).
Available at:
https://www.cms.gov/Medicare-Medicaid-
Coordination/Medicare-and-Medicaid-
Coordination/Medicare-Medicaid-
Coordination-Office/Analytics
CMS. Updated December 2021
Applications, Eligibility Determinations, and
Enrollment Data (as of December 21, 2022).
Available at:
https://www.medicaid.gov/medicaid/program
-information/medicaid-and-chip-enrollment-
data/monthly-reports/index.html
13BENEFICIARY EXPENDITURES 14
Beneficiary Expenditures

Fast fact: In 2020, children accounted for 38.1% of
beneficiaries and 15.7% of expenditures. People eligible for
Medicaid on the basis of disability accounted for 12.1% of
Medicaid beneficiaries and 32.8% of expenditures (slide 17).

This section of the profile shows annual Medicaid expenditures by service
category and by beneficiary category.

The charts in this section include:
• Annual Medicaid and CHIP Expenditures by Service Category
• Medicaid Enrollment, Expenditures, and Average Cost, by Beneficiary
  Category

15
Annual Medicaid and CHIP Expenditures by
Service Category (billions of dollars), 2020 and
2021
                                                                   Total expenditures
                                                                   Notes:

                          Key Facts                                Total Medicaid & CHIP Expenditures include
                                                                   federal, state, and local expenditures. Data
                                                                   are for Federal Fiscal Years 2020 and 2021.
                          Total Medicaid & CHIP   $756.3 Billion   Source:
                                                                   CMS National Health Expenditures
                          Expenditures, 2021                       Accounts (2020 and 2021 data, as of Dec
                                                                   15, 2022).
                          Total Medicaid & CHIP   $693.3 Billion   Available at:
                          Expenditures, 2020                       https://www.cms.gov/Research-Statistics-
                                                                   Data-and-Systems/Statistics-Trends-and-
                                                                   Reports/NationalHealthExpendData/Nationa
                                                                   lHealthAccountsHistorical

                                                                   Expenditures by service category
                                                                   Notes: Expenditures by service category do
                                                                   not sum to the total expenditures. Total
                                                                   expenditures also include Medicare
                                                                   payments for some beneficiaries and
                                                                   adjustments to prior year payments.
                                                                   Managed care expenditures cover the same
                                                                   services that are delivered via fee-for-
                                                                   service. Data do not permit allocation of
                                                                   managed care expenditures to the different
                                                                   service categories. Data are for Federal
                                                                   Fiscal Year 2021.
                                                                   Source:
                                                                   CMS analysis of CMS-64 expenditure
                                                                   reports for Federal Fiscal Year 2021 from
                                                                   the Medicaid Budget and Expenditure
                                                                   System/State Children's Health Insurance
                                                                   Program Budget and Expenditure System
                                                                   (MBES/CBES).
                                                                   Additional information available at:
                                                                   https://www.cms.gov/research-statistics-
                                                                   data-and-systems/computer-data-and-
                                                                   systems/medicaidbudgetexpendsystem

16
Medicaid Enrollment, Expenditures, and Average
Cost, by Beneficiary Category, 2020
Population: Beneficiaries of all ages with full or partial Medicaid benefits
Notes:
These national estimates include state-
reported data from the 50 states, D.C.,
Puerto Rico, and the U.S. Virgin Islands.
They exclude all spending and enrollment
through Medicaid-expansion CHIP and
separate CHIP programs. CMS used
Transformed Medicaid Statistical Information
System (T-MSIS) data to determine the
percentage of total Medicaid expenditures
accounted for by each beneficiary category,
then applied that percentage to the net total
Medicaid expenditures (federal and state)
states reported to the Medicaid Budget and
Expenditure System (MBES) in form CMS-
64. Total net expenditures exclude spending
for administrative expenses and
disproportionate share hospital payments.
Enrollment totals represent the count of total
beneficiary years in T-MSIS aggregated
across five beneficiary categories. People
with Disabilities includes beneficiaries of any
age who are eligible for Medicaid on the
basis of disability. Adults: ACA Medicaid
Expansion includes adults made eligible for
Medicaid under the Affordable Care Act
beginning in 2014. Some adult eligibility
groups may include a small number of
individuals under age 21 and over age 64.
Source:
CMS calculations using calendar year 2020
MBES expenditure data and 2020 T-MSIS
data on enrollees and expenditures.
Full website links for each data source can
be found in the Appendix.
17BENEFICIARY CHARACTERISTICS 18
Beneficiary Characteristics

Fast fact: In 2021, 25.8% of the 92.1 million Medicaid and
CHIP beneficiaries were females of reproductive age (ages 15                    Note:
to 49).1                                                                        1 These counts include beneficiaries

                                                                                who were: (1) enrolled in Medicaid or
                                                                                CHIP for at least one day during 2021,
                                                                                and (2) were eligible for full benefits or
                                                                                the equivalent as of their latest
This section of the profile shows the demographic characteristics of Medicaid   enrollment in 2021. Beneficiaries
and CHIP beneficiaries by age group and sex. It also shows estimates of         eligible for family planning services only
                                                                                are excluded. Calculations exclude
births paid for by Medicaid, by state.                                          beneficiaries who had claims but no
                                                                                eligibility data for the year. Calculations
                                                                                also exclude beneficiaries with missing
                                                                                or invalid age or a missing value for
The charts in this section include:                                             gender when age is between 15 and 49
• Demographics of Medicaid and CHIP Beneficiaries                               in T-MSIS (
Demographics of Medicaid and CHIP Beneficiaries,
2021
Population: Beneficiaries of all ages with full Medicaid or CHIP benefits
Nationally, 54.1% of Medicaid
beneficiaries were female and
45.9% were male in 2021.
Beneficiaries by age group and sex
Notes: Data include beneficiaries who were
enrolled in Medicaid or CHIP for at least one
day in 2021 and eligible for full-scope
benefits. This exhibit assigns beneficiaries
to age categories using the age field in TAF,
while the analysis on slide 17 also uses the
eligibility category field. The eligibility
category field includes information about the
eligibility pathway (for example, whether the
individual is eligible based on disability).
This exhibit also differs from the exhibit on
slide 17 in terms of the population included:
this exhibit includes CHIP beneficiaries and
is limited to beneficiaries with full-scope
benefits. Calculations also exclude
beneficiaries with missing age or gender in
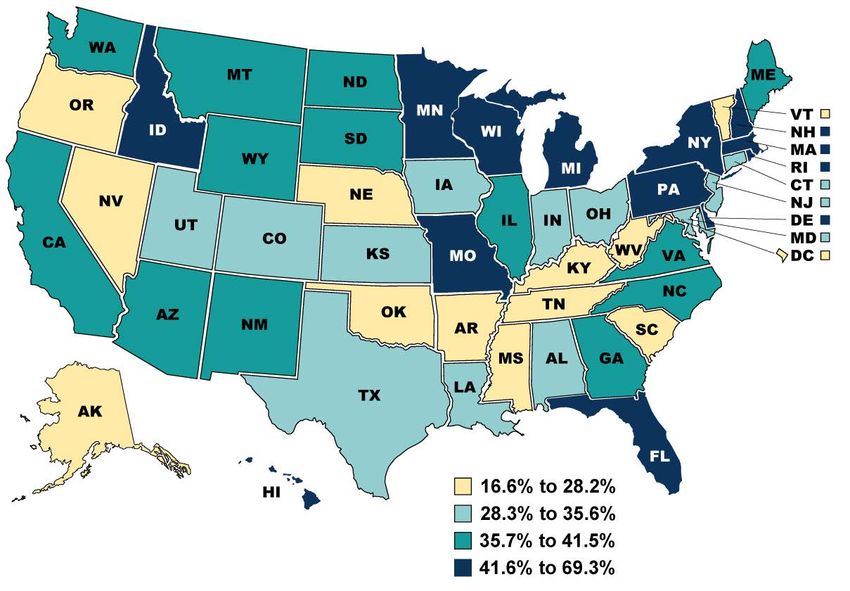
T-MSIS (Percentage of Births Covered by Medicaid, by
State, 2021
Population: All births with Medicaid as principal payer for the delivery
Nationally, 41.0% of
births were covered by
Medicaid in 2021.
Notes:
Births where Medicaid is the principal
payer for the delivery are shown.
Percentages were rounded to one
decimal place, and then states were
assigned to quartiles. Births with an
unknown payer are excluded from
calculations. In 5 states (MO, PA, TX,
UT, and WA), 2 to 3% of births have an
unknown payer. For all other states,Percentage of Medicaid and CHIP Beneficiaries
Living in Rural Areas, by State, 2021
Population: Beneficiaries of all ages with full Medicaid or CHIP benefits
Notes:
The denominator for each state includes
Medicaid and CHIP beneficiaries with full
benefits and excludes beneficiaries who are
eligible only for partial benefits, such as
Medicare cost-sharing, family planning-only
benefits, and emergency services-only
benefits. Each beneficiary was assigned a
rural or urban classification based on the ZIP
code from their last valid address in 2021.
Rural and urban assignments are based on
the 2010 Rural-Urban Commuting Area
(RUCA) coding system. The rural category
includes all micropolitan, small town, or rural
areas (RUCA codes 4-10). The urban category
includes metropolitan areas within an
urbanized area (UA) or with >10% primary flow
commuting to a UA (RUCA codes 1-3).
Beneficiaries whose ZIP code does not match
to a RUCA code were assigned to a “missing
or unknown” residence category and are
included in the denominator. In 4 states (MO,
RI, VT, and WY), 5 to 10% of beneficiaries
have missing or unknown residence. For all
other states,Percentage of Medicaid and CHIP Beneficiaries by Race
and Ethnicity, 2021
Population: Beneficiaries of all ages covered by Medicaid, CHIP, or other public
insurance coverage for low-income populations
Notes:
Data include individuals who self-report
coverage through Medicaid, CHIP, or
other public insurance coverage for
low-income populations. The Census
Bureau uses two separate questions
(one for Hispanic or Latino origin and
one for race) to collect information on
respondents’ races and ethnicities. The
Hispanic or Latino category shown in
the exhibit includes individuals of any
race. The other seven categories
exclude individuals who identify as
Hispanic or Latino. The Multiracial
category includes individuals who
selected more than one category for the
survey’s race question. The All Other
Self-Identities category includes
individuals who selected “some other
race” for the race question.
Source:
Mathematica analysis of U.S. Census
Bureau, American Community Survey,
2021 PUMS data.
Available at:
https://www2.census.gov/programs-
surveys/acs/data/pums/2021/1-Year/
23BENEFICIARY HEALTH STATUS 24
Medicaid and CHIP Beneficiary Health Status

Fast fact: In 2021, 30% of children ages 3-17 had a mental,
emotional, developmental, or behavioral problem (based on
parent-reported data), and 20% of adults ages 18-64 reported
they regularly had feelings of worry, nervousness, or anxiety
(slides 28 and 31).

This section of the profile shows the parent-reported or self-reported health
status of children and adults covered by Medicaid or CHIP (a parent or other
adult familiar with the child’s health reports on behalf of children ages 0 to
17). Information is presented on current health status, health conditions,
behavioral health, and oral health.

The charts in this section include:
• Current Health Status of Children and Adults Enrolled in Medicaid or CHIP
• Common Conditions of Children Enrolled in Medicaid or CHIP
• Mental Health Status of Children Enrolled in Medicaid or CHIP
• Children and Adolescents Who Received Oral Examinations or Topical
  Fluoride Treatments
• Health Conditions of Adults Enrolled in Medicaid or CHIP
• Mental Health Status of Adults Enrolled in Medicaid or CHIP
• Behavioral Health Status of Adults Enrolled in Medicaid or CHIP
• Emergency Department Visits for Non-Traumatic Dental Conditions per
  100,000 Adult Beneficiaries, by State

25
Current Health Status of Children and Adults
Enrolled in Medicaid or CHIP, 2021
Population: Non-institutionalized beneficiaries ages 0 to 64 covered by Medicaid,
CHIP, or other public insurance coverage for low-income populations

                                                                                    Children
                                                                                    Notes: Data include non-
                                                                                    institutionalized children ages 0 to 17
                                                                                    covered by public insurance (alone or in
                                                                                    combination with private insurance).
                                                                                    Responses of missing in error (
Common Conditions of Children Enrolled in
Medicaid or CHIP, 2021
Population: Non-institutionalized beneficiaries ages 0 to 17 with any public
insurance coverage
Notes:
Data include non-institutionalized
children covered by public insurance
(alone or in combination with private
insurance). The prevalence of allergies
and asthma is among all children ages
0-17. All other conditions are limited to
children ages 3-17. Allergies include
food, drug, insect, and other allergies.
The survey asks about each condition
individually; conditions shown are not
mutually exclusive or exhaustive. The
category Other Genetic or Inherited
Condition (6% of respondents) is not
shown in the exhibit because
information on the conditions included
was not publicly available. Responses
of missing (≤1% of responses for each
health condition) are excluded.
ADD or ADHD = Attention-Deficit
Disorder or Attention
Deficit/Hyperactivity Disorder
Source:
Mathematica analysis of National
Survey of Children’s Health, 2021
Public Use Data files.
Available at:
https://www.census.gov/programs-
surveys/nsch.html
27Mental Health Status of Children Enrolled in
Medicaid or CHIP, 2021
Population: Non-institutionalized beneficiaries ages 3 to 17 with any public
insurance coverage
Notes:
Data include non-institutionalized children
ages 3 to 17 covered by public insurance
(alone or in combination with private
insurance). All indicators are based on
parent report. To qualify as having a mental,
emotional, developmental, or behavioral
problem, the child must qualify on the
Children with Special Health Care Needs
(CSHCN) Screener criteria for ongoing
emotional, developmental or behavioral
conditions and/or have any of 10 conditions
currently (Tourette Syndrome, anxiety
problems, depression, behavioral and
conduct problem, developmental delay,
intellectual disability, speech or other
language disorder, learning disability, autism
or ASD, ADD or ADHD). Receipt of mental
health care is defined as receiving any
treatment or counseling from a mental
health professional. Level of difficulty
obtaining care is among those who needed
and received care. Totals do not sum to 100
asChildren and Adolescents Who Received Oral
Examinations or Topical Fluoride Treatments, 2018
Population: Beneficiaries under age 21 with full Medicaid or CHIP benefits for at least 6
continuous months in 2018
Notes:
Oral examinations are defined according to
logic adapted from the 2021 Oral
Evaluation, Dental Services (OEV-CH-A)
measure in the Dental Quality Alliance
(DQA) Pediatric Measure Set. Due to
concerns with the quality of Provider
Taxonomy information in T-MSIS analytic
files (TAF), this exhibit does not require the
service be rendered by or under the
supervision of a dentist and instead counts
all services billed with a Current Dental
Terminology (CDT) code indicating an oral
examination (D0120, D0145, D0150).
Topical fluoride treatments are defined
according to logic adapted from the 2021
Prevention: Topical Fluoride for Children at
Elevated Caries Risk, Dental or Oral Health
Services (TFL-CH-A(D/OH)) measure in the
DQA Pediatric Measure Set, which identifies
services with CDT codes D1206 and D1208.
Beneficiaries with at Least One Oral Examination Topical fluoride treatments also include
services with the Current Procedural
Terminology (CPT) code 99188 for fluoride
varnish application. This exhibit does not
require the service be rendered by or under
the supervision of a dentist and instead
counts all services billed with a CDT or CPT
code indicating a fluoride treatment. Totals
may not sum to 100% due to rounding.
Source:
Mathematica analysis of calendar year 2018
T-MSIS Analytic Files (TAF), v 4.0.
Additional information is available at:
https://www.medicaid.gov/medicaid/benefits/
downloads/2023-oral-health-at-a-glance.pdf
29Health Conditions of Adults Enrolled in Medicaid
or CHIP, 2021
Population: Non-institutionalized beneficiaries ages 18 to 64 covered by Medicaid,
CHIP, or other public insurance coverage for low-income populations
Notes:
Data include all non-institutionalized
civilian adults ages 18 to 64 covered by
Medicaid, CHIP, or other state-
sponsored health plans. All data on
health conditions are based on self-
report. Anxiety disorder includes
generalized anxiety disorder, social
anxiety disorder, panic disorder, post-
traumatic stress disorder, obsessive-
compulsive disorder, and phobias.
Gestational diabetes is limited to female
respondents. Responses of refused,
not ascertained, and don’t know (≤1%
of responses for each indicator) are
excluded.
COPD = Chronic Obstructive
Pulmonary Disease
Source:
Mathematica analysis of National
Center for Health Statistics, National
Health Interview Survey, 2021.
Available at:
https://www.cdc.gov/nchs/nhis/data-
questionnaires-documentation.htm
30Mental Health Status of Adults Enrolled in
Medicaid or CHIP, 2021
Population: Non-institutionalized beneficiaries ages 18 to 64 covered by Medicaid,
CHIP, or other public insurance coverage for low-income populations
Notes:
Data include all non-institutionalized
civilian adults ages 18 to 64 covered by
Medicaid, CHIP, or other state-sponsored
health plans. All indicators are based on
beneficiary self-report. Regularly had
feelings of worry, nervousness, or anxiety
is defined as: (1) feeling worried, nervous,
or anxious daily and describing the level
of those feelings as somewhere in
between a little and a lot, or a lot, OR (2)
feeling worried, nervous, or anxious
weekly and describing the level of those
feelings as a lot. Regularly had feelings of
depression is defined as: (1) feeling
depressed daily and describing the level
of those feelings as somewhere in
between a little and a lot, or a lot, OR (2)
feeling depressed weekly and describing
the level of those feelings as a lot.
Regularly had feelings of worry, nervous,
anxiety, or depression includes
respondents who met either (or both)
criteria. Responses of refused, not
ascertained, and don’t know (≤3% of
responses for each indicator) are
excluded.
Source:
Mathematica analysis of National Center
for Health Statistics, National Health
Interview Survey, 2021.
Available at:
https://www.cdc.gov/nchs/nhis/data-
questionnaires-documentation.htm
31Behavioral Health Status of Adults Enrolled in
Medicaid or CHIP, 2020
Population: Non-institutionalized beneficiaries age 18 and older covered by
Medicaid or CHIP
Notes:
Serious mental illness (SMI) and substance
Key Fact use disorder (SUD) measures are based
on respondents’ answers to survey
8%
questions and use criteria developed by
Percentage of Adults who Met Criteria the Substance Abuse and Mental Health
for Serious Mental Illness During the Service Administration. SMI is estimated
based on a statistical model of a clinical
Past Year, 2020 diagnosis and responses to questions in
the survey on distress (Kessler-6 scale),
impairment (truncated version of the World
Health Organization Disability Assessment
Schedule), past year major depressive
episode, past year suicidal thoughts, and
age. SMI is defined as currently or at any
time in the past year having had a
diagnosable mental, behavioral, or
emotional disorder resulting in substantial
impairment in carrying out major life
activities. SUD measures follow the criteria
in the Diagnostic and Statistical Manual of
Mental Disorders, 5th edition. Illicit drugs
include marijuana, cocaine, heroin,
hallucinogens, inhalants,
methamphetamine, and the misuse of
prescription psychotherapeutic drugs (i.e.,
pain relievers, tranquilizers, stimulants, and
sedatives). Opioid use disorders are a
subset of illicit drug use disorders.
Source:
Mathematica analysis of National Survey
on Drug Use and Health, 2020.
Available at:
https://www.datafiles.samhsa.gov/dataset/
national-survey-drug-use-and-health-2020-
nsduh-2020-ds0001
32Emergency Department Visits for Non-Traumatic Dental
Conditions per 100,000 Adult Beneficiaries, by State, 2019
Population: Beneficiaries ages 21 to 64 with full Medicaid or CHIP benefits and not
dually eligible for Medicare
Notes:
Non-traumatic dental conditions (NTDCs)
are dental conditions such as cavities or
dental abscesses that might have been
prevented with regular dental care.
Emergency Department (ED) visits for
NTDCs may indicate a lack of access to
more appropriate sources of medical and
dental care. CMS assessed state-level
data quality in the 2019 TAF file using the
following metrics: total enrollment,
inpatient (IP) and other services (OT)
claims volume; completeness of diagnosis
code (IP file); completeness of procedure
code (OT and IP files); and expected type
of bill code (IP file). States with an
unusable data quality assessment (TN,
SC) are shown in white. Results for
remaining states were rounded to whole
numbers, and then states were assigned
to quartiles. States with a high concern
data quality assessment are shown with a
hatched overlay. For additional information
regarding state variability in data quality,
please refer to the Medicaid DQ Atlas,
available at: https://www.medicaid.gov/dq-
atlas/welcome.
Source:
CMS analysis of calendar year 2019 T-
MSIS Analytic Files (TAF), v 5.0.
Additional information available at:
https://www.medicaid.gov/medicaid/benefit
s/downloads/adult-non-trauma-dental-ed-
visits.pdf
and
https://www.medicaid.gov/medicaid/benefit
s/dental-care/index.html
33BENEFICIARY EXPERIENCE 34
Beneficiary Experience
                                                                                               Notes:
                                                                                               The Agency for Healthcare Research and
                                                                                               Quality (AHRQ) CAHPS Database includes
Fast fact: In 2022, 60% of survey respondents reported that their child                        data submitted directly by state Medicaid
                                                                                               agencies or individual health plans. In states
always got needed care, and 70% reported that their child always got                           with fee-for-service or primary care case
                                                                                               management delivery systems, health plan
care quickly. For adults, 52% of survey respondents reported that they                         refers to the Medicaid program. The data
                                                                                               are submitted voluntarily to the CAHPS
always got needed care, and 56% reported that they always got care                             Database and are not from a statistically
quickly (slides 39 and 40).                                                                    representative sample of all plans. They are
                                                                                               not representative of all plans, enrollees, or
                                                                                               states. The results included in this Profile
                                                                                               are based on data collected between July
This section of the profile shows data from the Consumer Assessment of Healthcare              2021 and July 2022. The Child Medicaid
Providers and Systems (CAHPS) Health Plan Survey, which captures the experience of             survey results include 66,182 respondents
                                                                                               across 166 plans in 37 states. The Adult
Medicaid and CHIP beneficiaries. The AHRQ CAHPS Database includes information about            Medicaid survey results include 50,336
the experiences of Medicaid children and adults overall and across key dimensions of getting   respondents across 197 plans in 41 states.
                                                                                               The Child Medicaid results from seven
needed care, getting care quickly, how well doctors communicate, and health plan information   states account for 45% of responses and
and customer service.                                                                          Adult Medicaid results from seven states
                                                                                               account for 47% of responses. Thus, the
                                                                                               estimates may be biased, and it is not
                                                                                               possible to compute precision estimates
                                                                                               from the data. See the maps on the
The charts in this section include:                                                            following pages for more information on the
                                                                                               percentage distribution of survey
•    Percentage Distribution of Child Medicaid CAHPS Survey Respondents, by State              respondents by state for the Child and Adult
•    Percentage Distribution of Adult Medicaid CAHPS Survey Respondents, by State              Medicaid surveys.

•    Overall Ratings                                                                           Source:
•    Getting Needed Care                                                                       Agency for Healthcare Research and
                                                                                               Quality, CAHPS Health Plan Survey
•    Getting Care Quickly                                                                      Database 2022 Chartbook.
•    How Well Doctors Communicate                                                              Available at:
•    Health Plan Information and Customer Service                                              https://www.ahrq.gov/sites/default/files/wysi
                                                                                               wyg/cahps/cahps-database/2022-hp-
                                                                                               chartbook.pdf

35
Percentage Distribution of Child Medicaid CAHPS
Survey Respondents, by State, 2022
Population: Beneficiaries enrolled in Medicaid who responded to the survey
Notes:
The Agency for Healthcare Research
and Quality (AHRQ) CAHPS Database
includes data submitted directly by
state Medicaid agencies or individual
health plans. In states with fee-for-
service or primary care case
management delivery systems, health
plan refers to the Medicaid program.
The data are submitted voluntarily to
the CAHPS Database and are not from
a statistically representative sample of
all plans. They are not representative of
all plans, enrollees, or states. These
results are based on data collected
between July 2021 and July 2022. The
Child Medicaid survey results include
66,182 respondents across 166 plans
in 37 states. Results from seven states
account for 45% of responses. States
excluded from this analysis include
those that did not conduct the Child
Medicaid CAHPS survey or that did not
submit data to the AHRQ CAHPS
Database.
Source:
Agency for Healthcare Research and
Quality, CAHPS Health Plan Survey
Database 2022 Chartbook.
Available at:
https://www.ahrq.gov/sites/default/files/
wysiwyg/cahps/cahps-database/2022-
hp-chartbook.pdf
36Percentage Distribution of Adult Medicaid CAHPS
Survey Respondents, by State, 2022
Population: Beneficiaries enrolled in Medicaid who responded to the survey
Notes:
The Agency for Healthcare Research
and Quality (AHRQ) CAHPS Database
includes data submitted directly by
state Medicaid agencies or individual
health plans. In states with fee-for-
service or primary care case
management delivery systems, health
plan refers to the Medicaid program.
The data are submitted voluntarily to
the CAHPS Database and are not from
a statistically representative sample of
all plans. They are not representative of
all plans, enrollees, or states. These
results are based on data collected
between July 2021 and July 2022. The
Adult Medicaid survey results include
50,336 respondents across 197 plans
in 41 states. Results from seven states
account for 47% of responses. States
excluded from this analysis include
those that did not conduct the Adult
Medicaid CAHPS survey or that did not
submit data to the AHRQ CAHPS
Database.
Source:
Agency for Healthcare Research and
Quality, CAHPS Health Plan Survey
Database 2022 Chartbook.
Available at:
https://www.ahrq.gov/sites/default/files/
wysiwyg/cahps/cahps-database/2022-
hp-chartbook.pdf
37Medicaid Beneficiaries Who Responded to the Survey and
Gave a Rating of 9 or 10 for Overall Ratings, 2022
Population: Beneficiaries enrolled in Medicaid who responded to the survey
Notes:
The results from the AHRQ CAHPS
Database are based on data collected
between July 2021 and July 2022. The
Child Medicaid survey results include
66,182 respondents across 166 plans
in 37 states. The Adult Medicaid survey
results include 50,336 respondents
across 197 plans in 41 states. In states
with fee-for-service or primary care
case management delivery systems,
plan refers to the Medicaid program.
The Child Medicaid survey results from
seven states account for 45% of
responses and Adult Medicaid survey
results from seven states account for
47% of responses. Values represent
responses of 9 or 10 on a scale of 0 to
10. Child Medicaid excludes CHIP. Due
to the variability in response rates from
different states, the data presented in
this exhibit are not nationally
representative.
Source:
Agency for Healthcare Research and
Quality, CAHPS Health Plan Survey
Database 2022 Chartbook.
Available at:
https://www.ahrq.gov/sites/default/files/
wysiwyg/cahps/cahps-database/2022-
hp-chartbook.pdf
38Medicaid Beneficiaries Who Responded to the Survey
and Selected ‘Always’ for Getting Needed Care, 2022
Population: Beneficiaries enrolled in Medicaid who responded to the survey
Notes:
The results from the AHRQ CAHPS
Database are based on data collected
between July 2021 and July 2022. The
Child Medicaid results include 66,182
respondents across 166 plans in 37
states. The Adult Medicaid results
include 50,336 respondents across 197
plans in 41 states. In states with fee-for-
service or primary care case
management delivery systems, plan
refers to the Medicaid program. The
Child Medicaid survey results from
seven states account for 45% of
responses and Adult Medicaid survey
results from seven states account for
47% of responses. Values represent
responses of Always. Child Medicaid
excludes CHIP. Getting Needed Care
Composite combines responses to the
two individual questions. Due to the
variability in response rates from
different states, the data presented in
this exhibit are not nationally
representative.
Source:
Agency for Healthcare Research and
Quality, CAHPS Health Plan Survey
Database 2022 Chartbook.
Available at:
https://www.ahrq.gov/sites/default/files/
wysiwyg/cahps/cahps-database/2022-
hp-chartbook.pdf
39Medicaid Beneficiaries Who Responded to the Survey
and Selected ‘Always’ for Getting Care Quickly, 2022
Population: Beneficiaries enrolled in Medicaid who responded to the survey
Notes:
The results from the AHRQ CAHPS
Database are based on data collected
between July 2021 and July 2022. The
Child Medicaid results include 66,182
respondents across 166 plans in 37
states. The Adult Medicaid results
include 50,336 respondents across 197
plans in 41 states. In states with fee-for-
service or primary care case
management delivery systems, plan
refers to the Medicaid program. The
Child Medicaid survey results from
seven states account for 45% of
responses and Adult Medicaid survey
results from seven states account for
47% of responses. Values represent
responses of Always. Child Medicaid
excludes CHIP. Getting Care Quickly
Composite combines responses to the
two individual questions. Due to the
variability in response rates from
different states, the data presented in
this exhibit are not nationally
representative.
Source:
Agency for Healthcare Research and
Quality, CAHPS Health Plan Survey
Database 2022 Chartbook.
Available at:
https://www.ahrq.gov/sites/default/files/
wysiwyg/cahps/cahps-database/2022-
hp-chartbook.pdf
40Medicaid Beneficiaries Who Responded to the Survey
and Selected ‘Always’ for How Well Doctors
Communicate, 2022
Population: Beneficiaries enrolled in Medicaid who responded to the survey
Notes:
The results from the AHRQ CAHPS
Database are based on data collected
between July 2021 and July 2022. The
Child Medicaid results include 66,182
respondents across 166 plans in 37 states.
The Adult Medicaid results include 50,336
respondents across 197 plans in 41 states.
In states with fee-for-service or primary
care case management delivery systems,
plan refers to the Medicaid program. The
Child Medicaid survey results from seven
states account for 45% of responses and
Adult Medicaid survey results from seven
states account for 47% of responses.
Values represent responses of Always.
Child Medicaid excludes CHIP. How Well
Doctors Communicate Composite
combines responses to the five individual
questions for Child Medicaid and four
individual questions for Adult Medicaid.
Due to the variability in response rates
from different states, the data presented in
this exhibit are not nationally
representative.
Source:
Agency for Healthcare Research and
Quality, CAHPS Health Plan Survey
Database 2022 Chartbook.
Available at:
https://www.ahrq.gov/sites/default/files/wys
iwyg/cahps/cahps-database/2022-hp-
chartbook.pdf
41Medicaid Beneficiaries Who Responded to the Survey
and Selected ‘Always’ for Getting Health Plan
Information and Respectful Customer Service, 2022
Population: Beneficiaries enrolled in Medicaid who responded to the survey
Notes:
The results from the AHRQ CAHPS
Database are based on data collected
between July 2021 and July 2022. The
Child Medicaid results include 66,182
respondents across 166 plans in 37 states.
The Adult Medicaid results include 50,336
respondents across 197 plans in 41 states.
In states with fee-for-service or primary
care case management delivery systems,
plan refers to the Medicaid program. The
Child Medicaid survey results from seven
states account for 45% of responses and
Adult Medicaid survey results from seven
states account for 47% of responses.
Values represent responses of Always.
Child Medicaid excludes CHIP. Health Plan
Information and Customer Service
Composite combines responses to the two
individual questions. Due to the variability
in response rates from different states, the
data presented in this exhibit are not
nationally representative.
Source:
Agency for Healthcare Research and
Quality, CAHPS Health Plan Survey
Database 2022 Chartbook.
Available at:
https://www.ahrq.gov/sites/default/files/wys
iwyg/cahps/cahps-database/2022-hp-
chartbook.pdf
42SPECIAL TOPIC:
HEALTH-RELATED SOCIAL NEEDS
43Special Topic: Health-Related Social Needs
Fast fact: In 2021, half of households reported at least one housing
problem. The most common housing problem was high housing costs;
46% of households reported that monthly household costs exceeded 30%
of monthly income (slide 49).
This section of the profile presents information on the health-related social needs among
children and adults enrolled in Medicaid or CHIP.
The charts in this section include:
• Percentage of Children with Family Income Below the Federal Poverty Threshold Who
Were Enrolled in Medicaid or CHIP, by State
• Percentage of Adults with Family Income Below the Federal Poverty Threshold Who Were
Enrolled in Medicaid or CHIP, by State
• Percentage of Adults Enrolled in Medicaid or CHIP with a High School Degree or Higher,
by State
• Employment Status, Access to Sick Leave, and Transportation Among Adults Enrolled in
Medicaid or CHIP
• Housing Problems in Households with at Least One Person Enrolled in Medicaid or CHIP
• Number of People Experiencing Sheltered Homelessness per 10,000 People, by State Note:
• Percentage of People Experiencing Sheltered Homelessness Who are in Families with For more information on Medicaid and
Children, by State CHIP authorities that can be used to
address individuals’ unmet health-
• Internet Access in Households with at Least One Person Enrolled in Medicaid or CHIP, by related social needs, please see:
State https://www.medicaid.gov/health-
related-social-needs/index.html
• Food Security Status of Children and Adults Enrolled in Medicaid or CHIP
44Percentage of Children with Family Income Below the Federal
Poverty Threshold Who Were Enrolled in Medicaid or CHIP, by
State, 2021
Population: Beneficiaries ages 0 to 17 covered by Medicaid, CHIP, or other public insurance
coverage for low-income populations
Notes:
The denominator for each state represents
the total number of children ages 0 to 17
whose family income for the previous 12
months was less than the federal poverty
threshold. The Census Bureau uses money
income thresholds that vary by family size
and number of children to determine who is
living in poverty. The poverty thresholds do
not vary geographically, but they are
updated for inflation. Individuals who are
under age 15 and are either living in a
housing unit but are unrelated to the
householder or are living in select group
quarters are excluded from poverty
calculations (20 percentage points)
for those estimates. The map shows states
with Medicaid adult expansion programs
that were implemented as of July 2021.
Sources:
Mathematica analysis of U.S. Census
Bureau, American Community Survey, 2021
PUMS data; and CMS. Adult Coverage
Expansion as of July 2021.
Full website links for each data source can
be found in the Appendix.
45Percentage of Adults with Family Income Below the Federal
Poverty Threshold Who Were Enrolled in Medicaid or CHIP, by
State, 2021
Population: Beneficiaries ages 18 to 64 covered by Medicaid, CHIP, or other public
insurance coverage for low-income populations
Notes:
The denominator for each state
represents the total number of adults ages
18 to 64 whose family income for the
previous 12 months was less than the
federal poverty threshold. The Census
Bureau uses money income thresholds
that vary by family size and number of
children to determine who is living in
poverty. The poverty thresholds do not
vary geographically, but they are updated
for inflation. The numerator for each state
represents the total number of adults ages
18 to 64 who are included in the
denominator and who have coverage
through Medicaid, CHIP, or other public
insurance coverage for low-income
populations (based on self-report). State
percentages were rounded to one decimal
place, and then states were assigned to
quartiles. The map shows states with
Medicaid adult expansion programs that
were implemented as of July 2021.
Sources:
Mathematica analysis of U.S. Census
Bureau, American Community Survey,
2021 PUMS data.
Available at:
https://www2.census.gov/programs-
surveys/acs/data/pums/2021/1-Year/
CMS. Adult Coverage Expansion as of
July 2021.
Available at:
https://www.medicaid.gov/medicaid/progra
m-information/downloads/medicaid-
expansion-state-map-10-2021.pdf
46Percentage of Adults Enrolled in Medicaid or CHIP with
a High School Degree or Higher, by State, 2021
Population: Beneficiaries ages 25 to 64 covered by Medicaid, CHIP, or other
public insurance coverage for low-income populations
Notes:
The denominator for each state
represents the total number of adults
ages 25 to 64 who self-report coverage
through Medicaid, CHIP, or other public
insurance coverage for low-income
populations. The numerator for each
state represents the total number of
adults ages 25 to 64 who are included
in the denominator and who self-report
that they have a regular high school
diploma, a General Education
Development Test (GED) or alternative
credential, or a higher level of
educational attainment. State
percentages were rounded to one
decimal place, and then states were
assigned to quartiles.
Source:
Mathematica analysis of U.S. Census
Bureau, American Community Survey,
2021 PUMS data.
Available at:
https://www2.census.gov/programs-
surveys/acs/data/pums/2021/1-Year/
47Employment Status, Access to Sick Leave, and Transportation
Among Adults Enrolled in Medicaid or CHIP, 2021
Population: Beneficiaries ages 18 to 64 covered by Medicaid, CHIP, or other public
insurance coverage for low-income populations
Employment status and sick leave
Employment Status Access to Paid Sick Leave Notes: Data include all non-institutionalized
civilian adults ages 18 to 64 covered by
Medicaid, CHIP, or other state-sponsored
health plans. Worked in the last week
includes adults who: (1) worked for pay in the
last week, (2) were performing seasonal or
contract work and worked in the past 12
months, and (3) were working at a job or
business but not for pay in the last week.
45%
Access to paid sick leave is asked only of
46% adults who: (1) were working at or were on
temporary leave from a paid job or business
last week, (2) work, but not for pay at a family
of adults reported of adults with a period of employment business, or (3) are not currently working but
in the past 12 months reported had some period of employment in the past
they had worked in the last 12 months. Responses of refused, not
week they had paid sick leave ascertained, and don’t know (≤4% of
responses for each indicator) are excluded.
Source: Mathematica analysis of National
Center for Health Statistics, National Health
Interview Survey, 2021.
Primary mode of transportation
Notes: Data include adults ages 18 to 64
who report that they are currently employed
and report coverage through Medicaid, CHIP,
or other public insurance coverage for low-
income populations. Private vehicle or ride
hailing includes car, truck or van, taxicab, and
motorcycle (ride share is not a response
option). Public transportation includes bus,
subway, train or rail, streetcar, trolley, and
ferry boat.
Source: Mathematica analysis of U.S.
Census Bureau, American Community
Survey, 2021 PUMS data.
Full website links for each data source can be
found in the Appendix.
48Housing Problems in Households with at Least One
Person Enrolled in Medicaid or CHIP, 2021
Population: Households with at least one person covered by Medicaid, CHIP, or
other public insurance coverage for low-income populations
Notes:
Data include households where at least
one person reported coverage through
Medicaid, CHIP, or other public insurance
coverage for low-income populations. To
meet the Department of Housing and Urban
Development (HUD) criteria for housing
problems, a household must satisfy at least
one of the following: (1) housing unit lacks
complete kitchen facilities, (2) housing unit
lacks complete plumbing facilities, (3)
household is overcrowded, or (4)
household is cost burdened. Any
overcrowding is defined as a ratio of more
than 1 person per room; severe
overcrowding is more than 1.5 people per
room. Any cost burden is defined as
monthly housing costs (including utilities)
that exceed 30% of monthly household
income; severe cost burden is monthly
housing costs that exceed 50% of monthly
income. For more information, see:
https://www.huduser.gov/portal/datasets/cp/
CHAS/bg_chas.html. Households with
missing information on cost burden (Number of People Experiencing Sheltered
Homelessness per 10,000 People, by State, 2021
Population: Individuals staying in emergency shelters, transitional housing
programs, or safe havens (regardless of insurance type)
Notes:
The Point-in-Time (PIT) count is a
nationwide unduplicated count of
people experiencing homelessness
on a single night in the last week of
January. The PIT count provides
state-level estimates of
homelessness, as well as estimates
of chronically homeless persons,
homeless veterans, and homeless
children and youth. Due to pandemic-
related disruptions, the 2021 report
focuses on people experiencing
sheltered homelessness and
excludes unsheltered populations.
Sheltered homelessness refers to
people who are staying in emergency
shelters, transitional housing
programs, or safe havens. The rate
for each state was obtained from the
report cited below, and then states
were assigned to quartiles.
Source:
U.S. Department of Housing and
Urban Development. 2021 Annual
Homeless Assessment Report to
Congress. Part 1: PIT Estimates of
Sheltered Homelessness. Appendix
B.
Available at:
https://www.huduser.gov/portal/sites/
default/files/pdf/2021-AHAR-Part-
1.pdf
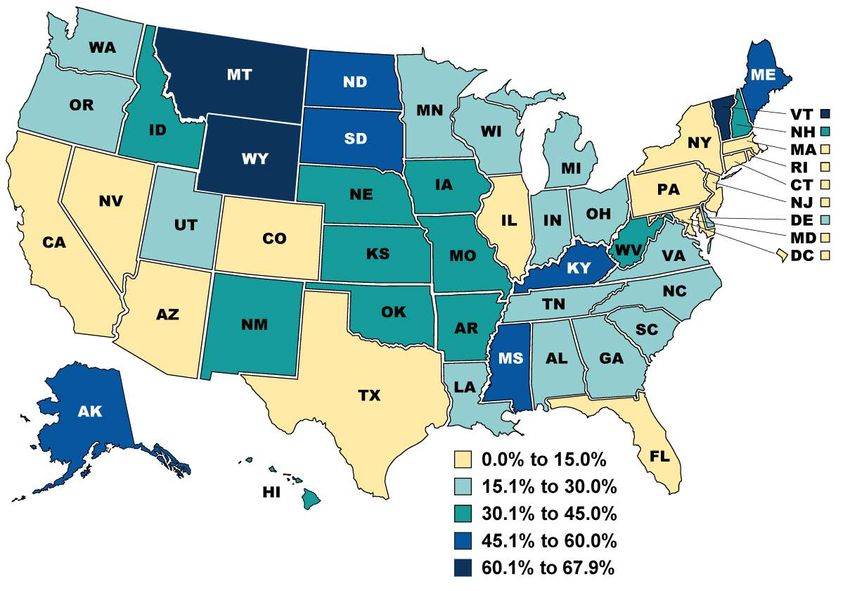
50Percentage of People Experiencing Sheltered Homelessness
Who are in Families with Children, by State, 2021
Population: Individuals staying in emergency shelters, transitional housing programs, or
safe havens (regardless of insurance type)
Notes:
The Point-in-Time (PIT) count is a
nationwide unduplicated count of people
experiencing homelessness on a single
night in the last week of January. The PIT
count provides state-level estimates of
homelessness, as well as estimates of
chronically homeless persons, homeless
veterans, and homeless children and
youth. Due to pandemic-related
disruptions, the 2021 report focuses on
people experiencing sheltered
homelessness and excludes unsheltered
populations. Sheltered homelessness
refers to people who are staying in
emergency shelters, transitional housing
programs, or safe havens. Estimates of
people in families with children include
people who are experiencing
homelessness as part of a household that
has at least one adult (age 18 and older)
and one child (under age 18). The
percentage for each state was obtained
from the report cited below, and then
states were assigned to quartiles.
Source:
U.S. Department of Housing and Urban
Development. 2021 Annual Homeless
Assessment Report to Congress. Part 1:
PIT Estimates of Sheltered
Homelessness. Appendix B.
Available at:
https://www.huduser.gov/portal/sites/defa
ult/files/pdf/2021-AHAR-Part-1.pdf
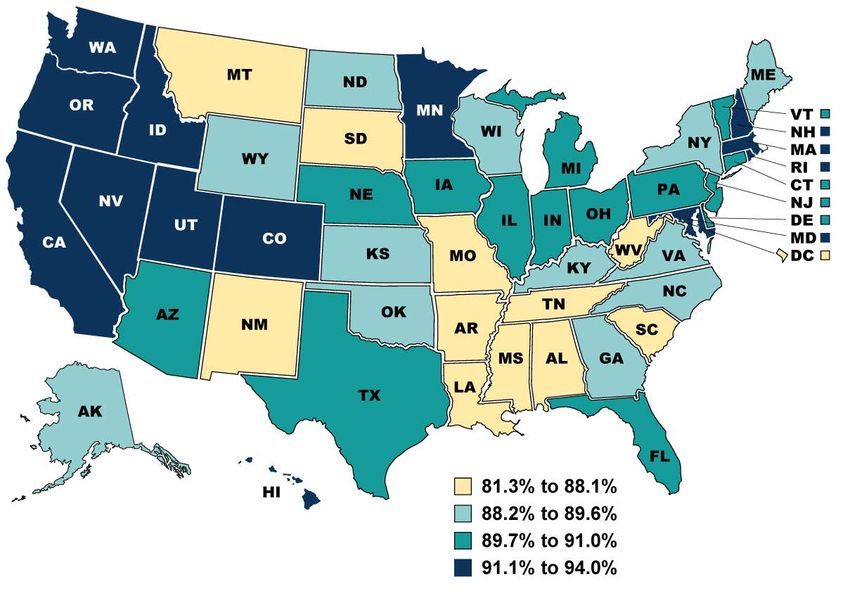
51Internet Access in Households with at Least One Person
Enrolled in Medicaid or CHIP, by State, 2021
Population: Households with at least one person covered by Medicaid, CHIP, or
other public insurance coverage for low-income populations
Notes:
The denominator for each state
represents the total number of
households where at least one person
reported coverage through Medicaid,
CHIP, or other public insurance
coverage for low-income populations.
The numerator for each state
represents the total number of
households that are included in the
denominator and where the survey
respondent indicated that at least one
household member has access to the
internet (either by paying a cell phone
company or internet service provider, or
without paying). State percentages
were rounded to one decimal place,
and then states were assigned to
quartiles.
Source:
Mathematica analysis of U.S. Census
Bureau, American Community Survey,
2021 PUMS data.
Available at:
https://www2.census.gov/programs-
surveys/acs/data/pums/2021/1-Year/
52You can also read