2020 US CONSTRUCTION INDUSTRY ANALYSIS DURING COVID - RESEARCH & CONSULTING

Page created by Craig Ramirez
 
CONTINUE READING
2020 US CONSTRUCTION INDUSTRY ANALYSIS DURING COVID - RESEARCH & CONSULTING
November 2020

                        2020 US CONSTRUCTION INDUSTRY
                        ANALYSIS DURING COVID
                        Updated Analysis and Outlook for 2021

RESEARCH & CONSULTING
2020 US CONSTRUCTION INDUSTRY ANALYSIS DURING COVID - RESEARCH & CONSULTING
At a Glance

Ducker is a leading global
market intelligence and
consulting firm with 60 years            60 200+ 9                                 1 goal
                                         years   professionals offices       to support our clients’
of experience in the                                                       growth mandates in their
construction industry and a                                                most important markets

long-standing partner of USG

       Deep Industry Expertise           Global Capabilities                                    Proven Research and Consulting Services
       Dedicated sector practices for:   Dedicated research                                     Separate signal from noise to understand opportunities and
                                         practices for 80+ markets across:                      market risks through:
       • Automotive & Transportation     • Asia Pacific                                         • Deep construction expertise and renowned access to
       • Building & Construction         • Latin America                                          decision makers
       • Consumer Products               • Europe                                               • Valuable proprietary data and forecasts
       • Healthcare                      • Middle East & North Africa                           • Custom research and analytics
       • Heavy Equipment                 • Sub-Saharan Africa                                   • Innovative research tools, methods across quantitative,
       • Industrial                      • North America                                          qualitative and digital
       • Private Equity
       • Technology

                                                            CONFIDENTIAL -DUCKER HOLDINGS LLC                                                                2
2020 US CONSTRUCTION INDUSTRY ANALYSIS DURING COVID - RESEARCH & CONSULTING
Industry Insights Leading Up to COVID CRISIS

                                                                                                     CONSTRUCTION ($) PIP TREND
                        $700,000

                        $600,000

                        $500,000

                        $400,000

                        $300,000

                        $200,000

                        $100,000

                                                                                                      Great Recession
                              $-
                                       2002        2003        2004        2005     2006      2007            2008       2009        2010      2011       2012        2013   2014   2015   2016   2017   2018   2019

                                                                                       Residential Building          Nonresidential Building      Nonbuilding Construction

                                         • Residential construction spending experienced significant decline in past recession due to unqualified lending and less
                                           healthy consumers
                                         • Residential was demonstrating an adjustment in 2019, however likely a false negative given excellent rebound in December
                                           through February
                                         • Nonresidential performing typical cycle behaviors with some concern for office/bank/retail activity in 2018 and 2019
                                         • Infrastructure needs, improved state and local balance sheets and political alignment fueled slow, steady growth in spending

Sources: Census, NAHB, AIA, FRED, CBRE, HUD, NAR, Ducker Interviews and Expertise

                                                                                                                        CONFIDENTIAL -DUCKER HOLDINGS LLC                                                              3
2020 US CONSTRUCTION INDUSTRY ANALYSIS DURING COVID - RESEARCH & CONSULTING
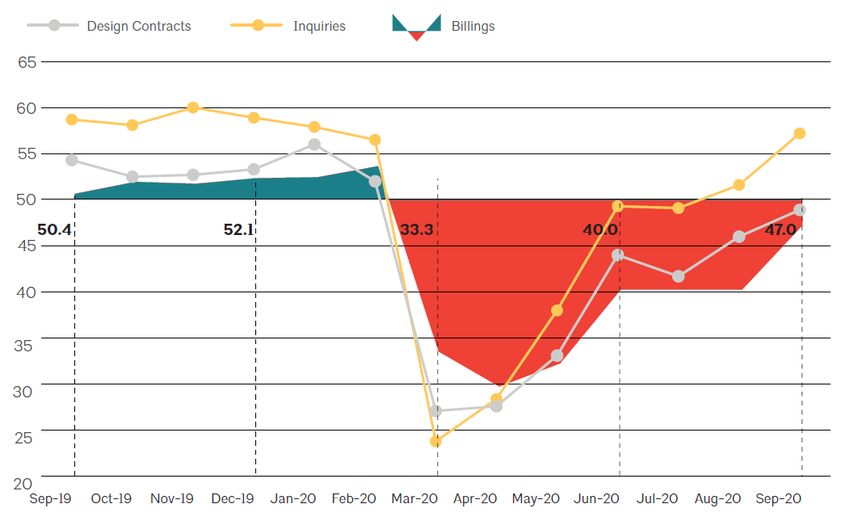
Construction Has Not Kept Up with Household Growth
Residential construction has not kept pace with the minimum housing requirement – causing a shortage of available supply for new households and likely
long-term benefits beyond 2020.

                                                                      MINIMUM HOUSING REQUIREMENTS VS. COMPLETIONS &
                                                                             PLACEMENTS OF NEW HOUSING UNITS
                                                                                                                 Millions of units
                                                                                                                                                                                   ▪ After a decade of low levels of
              2.25
                                                                                                                                The Census Bureau indicates the U.S.                 building due to conservative
                                                                                                                                Housing market needs 350 K units per year            development plans, housing stock
                                                                                                                                above new households just to replace lost            is currently well short of US
                                                                                                                                units, which has not happened since 2008
              2.00                                                                                                                                                                   demand

                                                                                                                                                                                   ▪ In 2017 Freddie Mac estimated
              1.75                                                                                                                                                                   the U.S. was ~2.5 million housing
                                                                                                                                                                                     units below what is needed to
                                                                                                                                                                                     match long term demand, with an
              1.50                                                                                                                                                                   annual rate of construction
                                                                                                                                                                                     ~370,000 units below the level
                                                                                                                                                                                     required to meet demand
              1.25
                                                                                                                                                                                   ▪ Single family builders cite labor
                                                                                                                                                                                     shortages, profitability concerns,
              1.00                                                                                                                                                                   and land economics/availability as
                                                                                                                                                                                     reasons for inability to meet full
                                                                                                                                                                                     demand and likely a long runway
              0.75                                                                                                                                                                   of build potential
                             Minimum Housing Requirement          Completions & Placements of New Units

                                                                                                                                                                                   ▪ New SF home rental communities
              0.50
                                                                                                                                                                                     looking to fill the gap
                      2000                2002             2004            2006               2008        2010           2012              2014            2016             2018

Sources: Ducker Analysis, JCHS, Freddie Mac

                                                                                                             CONFIDENTIAL -DUCKER HOLDINGS LLC                                                                            4
Industry Insights Leading Up to COVID CRISIS

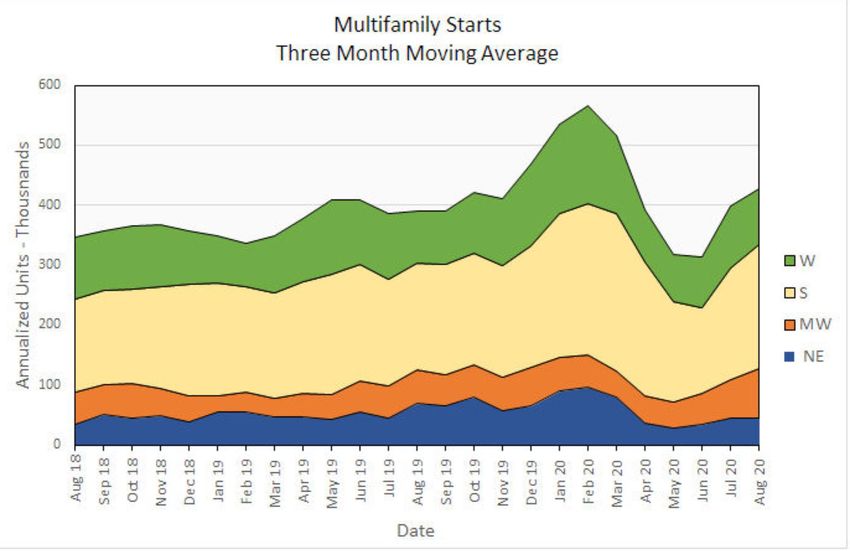
                                    Multifamily has outperformed single-family for the last several years. Very strong start to 2020 pre COVID and opportunities will continue
                                             long term, particularly in nonurban areas for low - and mid-rise projects (rental living increases relative to ownership)

                                                S F, M F S TA R T S I N D E X E D , O O O s
     300

     250

     200

     150

                                                                                                       Land mix
     100                                                                                               Labor shortage
                                                                                                       Entry level segment

      50

                                                                                     Great Recession
       0

                                                                           SF       MF

Sources: Census, NAHB, AIA, FRED, CBRE, HUD, NAR, Ducker Interviews and Expertise

                                                                                                        CONFIDENTIAL -DUCKER HOLDINGS LLC                                        5
Industry Insights Through COVID Crisis

              Multi-family has outperformed single family for the last several years but has                                                                      Housing Starts         2019A      2020F     change     2021F      change
              been more volatile through the COVID crisis. Single family to be the growth                                                                         (‘000)
                           driver going forward, particularly in nonurban areas                                                                                   Single Family           888        938        +6%       1,047     +12%

           120%                                                                                                                     50%                           Multi-Family            402        410        +2%       349        -15%

           100%                                                                                                                     40%
                                                                                                                                                                  Total Starts           1,290      1,348       +4%       1,395      +4%
           80%
                                                                                                                                    30%

           60%

                                                                                                                                            Existing Home Sales
                                                                                                                                    20%                           ▪ Housing starts recovered rapidly after April-May collapse led by single
           40%                                                                                                                                                      family activity
  Starts

                                                                                                                                    10%
           20%
                                                                                                                                                                  ▪ Single family September YTD up 4 percent over prior year. Multi-family
                                                                                                                                    0%
                                                                                                                                                                    up 10 percent
            0%
                                                                                                                                                                  ▪ Similar V curve for existing home sales which rose to a new 14 year
                   Jan           Feb           Mar            Apr           May           Jun      Jul         Aug        Sep
           -20%
                                                                                                                                    -10%                            high in September
                                                                                                                                                                  ▪ Home sales still 2% behind 2019 YTD
           -40%                                                                                                                     -20%
                                                                                                                                                                  ▪ Activity still constrained by a lack of inventory but delayed selling
           -60%                                                                                                                     -30%                            season - low interest rates and millennials coming to the market have
                               Single Family Starts                 Multi-Family Starts         Total Starts          Existing Home Sales                           fueled strong demand

Sources: Census, NAHB, AIA, FRED, CBRE, HUD, NAR, Ducker Interviews and Expertise

                                                                                                                CONFIDENTIAL -DUCKER HOLDINGS LLC                                                                                             6
Industry Insights Through COVID Crisis

                      • Retail building material expenditures have driven the growth in construction activity - significantly outpacing wholesale expenditures
                      • Price increases over the past year for most material categories, led by lumber and softwood lumber pricing
                      • Cost of new home builds increasing up to 20% from initial budgets

                                                                                                                                                       SEPTEMBER PRODUCER PRICE INDEX, 12 MONTH
                      Y E A R - O N - Y E A R C H A N G E I N C E N S U S B U I L D I N G M AT E R I A L
                                                                                                                                                                       CHANGE
                                                     EXPENDITURES
         20.0%                                                                                                                                                           Sep-20 PPP             change vs. Sep-19
                                                                                                                                                 450                                                                                      90%
                                                                                                                                                 400                                                          81.2%                       80%
         15.0%                                                                                                     Retail

                                                                                                                                                                                                                                                 change from Sep-19
                                                                                                                 YTD +10%                        350                                                                                      70%
                                                                                                                                                 300                                                                                      60%

                                                                                                                                    Sep-20 PPP
         10.0%                                                                                                                                                                                  52.4%                                     50%
                                                                                                                                                 250
                                                                                                                 Wholesale                                                                                                                40%
          5.0%                                                                                                   YTD +1%                         200
                                                                                                                                                                                                                             28.4%        30%
                                                                                                                                                 150                                                                                      20%
          0.0%                                                                                                                                   100                                                                                      10%
                     Jan-20         Feb-20         Mar-20         Apr-20        May-20   Jun-20   Jul-20      Aug-20
                                                                                                                                                  50                                                                                 5.5%
                                                                                                                                                          2.8%       -0.1%          2.4%                                                  0%
         -5.0%
                                                                                                                                                   0                                                                                      -10%
        -10.0%

        -15.0%

        -20.0%
                                                               Retail       Wholesale
                                                                                                                                                                 *Structural, Architectural, Pre-Engineered Metal Products

Sources: Census, NAHB, AIA, FRED, CBRE, HUD, NAR, Ducker Interviews and Expertise

                                                                                                           CONFIDENTIAL -DUCKER HOLDINGS LLC                                                                                                                          7
AIA Indicators and Recovery
A healthy, early indicator of future construction and major remodeling activity is the AIA/ABI Index on activities, inquiries and sentiment across the
architectural community. Data through September show improving conditions with a steady increase in inquiries.

                                        ABI ACTIVITY TRACKING                                                                        AIA SENTIMENT FOR SERVICES BY
                                                                                                                                             BUILDING TYPE

                       • Since mid-May – inquiries increasing at significant rate for architectural and design services, both for new construction but also for built out and remodel
                         for post-covid environment – occupancy protection, management, densify/open plan etc.
                       • Contracts kept pace through early July - rebound after holiday vacation dip and slower processes to award work
                       • Broad categories of commercial and industrial had the biggest decline but also are seeing a V shaped recovery given scale of demand and opportunities
                         across many geographies and applications

Sources: Ducker, AIA

                                                                                          CONFIDENTIAL -DUCKER HOLDINGS LLC                                                             8
Industry Insights Post COVID

                                        CONSTRUCTION ($) PIP FORECAST –
                                                                                                                                                             Residential - rapid recovery after spring drop. Single
                                       OCTOBER 2020 SCENARIO FOR FUTURE                                                                                      family strength with low interest rates and new market
                                           (POST-COVID) OPTIMISTIC                                                                                           entrants unleashing short-term pent-up demand.
                                                                                                                                                             Flattening over next 2 years with lagged impact of
                                                           ABI ACTIVITY TRACKING                                              Healthy Q1 2020
                                                                                                                              SF AND MF rapid
                                                                                                                                                             severe economic downturn dampening continued
      $700,000                                                                                                                recovery post                  increase in existing home sales.
                                                                                                                              COVID
      $600,000
                                                                                                                                                             Nonresidential - greater negative impact and declines
      $500,000                                                                                                                                               for a period depending on suburban growth, vaccine.
                                                                                                                                                             Healthcare and services offer unique opportunities of
      $400,000
                                                                                                                                                             demand.

      $300,000
                                                                                                                                                             The long-term growth of infrastructure will pause until
                                                                                                           Infrastructure OPEX
                                                                                                           typically outperforms                             Federal stimulus kicks in. Some tail of activity will
      $200,000
                                                                                                           CAPEX                                             continue due to recent bonds passage and multi-year
                                                                                                                                                             funded projects. Future local government balance
      $100,000
                                                                                                                                                             sheets likely to be strained – tax revenues down,
                                                                                                                                                             reducing project spend and a lag period of impact. OPEX
             $0                                                                                                                                              likely to outperform CAPEX.
                    2010     2011      2012      2013      2014      2015      2016    2017      2018       2019      2020F    2021F   2022F    2023F

                                                   Residential         Nonresidential Building          Nonbuilding

Sources: Census, NAHB, AIA, FRED, CBRE, HUD, NAR, Ducker Interviews and Expertise

                                                                                                                         CONFIDENTIAL -DUCKER HOLDINGS LLC                                                             9
Industry Insights Post COVID – Forecast Scenarios

                                               CONSTRUCTION ($) PIP FORECAST – APRIL 2020 SCENARIO FOR FUTURE (POST COVID)

              All scenarios show an overall decline but with different projections for each segment. Residential housing impact very different to previous recession and shorter
              and less severe than originally forecasted. Non-residential building hardest hit and recovery likely to be delayed for 2 to 3 years. Nonresidential building
              dependent on future government policy.

                       DOWNSIDE - POST COVID PIP $,000                                             BASE CASE - POST COVID PIP $,000                                   UPSIDE - POST COVID PIP $,000
      $700,000                                                                      $700,000                                                         $700,000
      $600,000                                                                      $600,000                                                         $600,000
      $500,000                                                                      $500,000                                                         $500,000
      $400,000                                                                      $400,000                                                         $400,000
      $300,000                                                                      $300,000                                                         $300,000
      $200,000                                                                      $200,000                                                         $200,000
      $100,000                                                                      $100,000                                                         $100,000
             $0                                                                          $0                                                               $0

                  Residential                     Nonresidential Building                      Residential                 Nonresidential Building              Residential                  Nonresidential Building
                  Nonbuilding Construction                                                     Nonbuilding Construction                                         Nonbuilding Construction

                                         2019-2023                                                                     2019-2023                                                          2019-2023
                                            CAGR                                                                          CAGR                                                              CAGR
                       Residential Building                     0.9%                                   Residential Building               2.1%                           Residential Building                3.9%
                       Nonresidential Building                 -5.6%                                   Nonresidential Building           -4.4%                           Nonresidential Building            -2.3%
                       Nonbuilding Construction                 0.0%                                   Nonbuilding Construction           0.9%                           Nonbuilding Construction            2.1%
                       Total PIP Construction                  -1.5%                                   Total PIP Construction            -0.3%                           Total PIP Construction              1.4%

Sources: Census, NAHB, AIA, FRED, CBRE, HUD, NAR, Ducker Interviews and Expertise

                                                                                                        CONFIDENTIAL -DUCKER HOLDINGS LLC                                                                              10
Five Key Factors Representing New Norm in Construction
The COVID crisis has shifted practices, housing preferences and regional construction dynamics offering new opportunities with new strategies and business
models.

         POST VIRUS SOCIETY DRIVES A NEW NORM IN CONSTRUCTION

                                                                                             • Severe shock to society drives conservancy in spending, balance sheet and affordability
                                                                                    1        • Refocus on what’s most important to protect, maintain business and living
                                                                                             • Building owner and homeowners focus on home improvement and “quality of home”

                                                                                    2        • Accelerating digitalization in each stage of design and construction process
                                                                                             • Governments upgrading communications, digital competencies
                                                                                             • Network bandwidth expansion for infrastructure across public, private data demand

                                                                                             • Purposeful, disciplined construction process that favors longer cycles, prefab construction
                                                                                    3        • Decrease in open plan environments, increase in private spaces (social distance friendly)
                                                                                             • Increased square footage in demand, value trade-off against premium finishes

                                                                                             • Increase in storage, warehousing and multi-function areas
                                                                                             • Healthcare facilities upgrade, retrofit and build out
                                                                                    4        • Expanding distribution and last-mile storage/delivery
                                                                                             • Finally addressing infrastructure needs – road and communications investments

                                                                                    5        • Growth of lower density construction areas – suburban, rural in demand
                                                                                             • More renting- rental communities with homes, single payment will thrive
                                                                                             • Luxury and Custom construction/remodel to lead the rebound in 2021
                                                                                             • Bump to existing home sales and remodeling outside of large urban areas

Sources: Census, NAHB, AIA, FRED, CBRE, HUD, NAR, Ducker Interviews and Expertise

                                                                                        CONFIDENTIAL -DUCKER HOLDINGS LLC                                                                    11
Residential Construction COVID Developments

            Business Profitability
    01      • Profitability of select producers and suppliers far better through the crisis than forecasted – some note record quarterly performance
            • Financials lifted through improving demand, lower SG&A costs and ability to sell out inventories
            • Lower cost of sales with favorable input prices helped several sectors outperform adjusted forecast or YOY targets

            Significant Pricing Dynamics
    02      •
            •
                Import challenges increase domestic source demand and improve average pricing through the channel
                Lumber price appreciation significant- negative impact to framing and new housing costs
            •   Resin/plastic price favorability leading contributing to improved cost basis and better margins - remodeling
            •   Many sectors launching price increases for early 2021 - ranging from 4-9% upside

            Big Box Retail Performance
    03       • Essential business status led to significant store traffic and purchases by DIY and DIFM
             • Transition from renter to home-buyer increased variety of interior project/décor spend
             • New digital programs by Lowes and Home Depot – and healthy inventory attracted professionals

            Continued home remodeling, outdoor and exteriors pent up demand
           • COVID themes and risks driving more outdoor living, family and pet friendly environments
    04     • Migration from apartment living to existing single-family increasing upgrades and improvements
           • Long lead times for windows, siding, fencing, decking will create pent-up demand through Q2 2021 as industry works to balance new
             construction growth and remodeling demand

                                                             CONFIDENTIAL -DUCKER HOLDINGS LLC                                                         12
Nonresidential COVID Related Developments

            Nonresidential Backlog                                                            Delayed Office Vacancy Decline
            While nonresidential, new construction reached                                    Federal and state stimulus helped businesses
            peak in late 2019, starts in Q4 allowed progress                                  complete lease payments through the early COVID
            on backlog through Q3 2020 –however, future                                       crisis. Some businesses returning. Full affect of
            activity likely to slow with completion of backlog                                office vacancy and lease levels yet to be
            and reduction in permits/starts.                                                  experienced with many implementing office layout
                                                                                              improvements or posting return to office in H2
                                                                                              2021.

            Building Stock MRO and Reset                                                      REIT $ Shift to Detached Rental Housing
             Aging nonresidential building stock still                                        With pressures on nonresidential lease rates,
             represents a significant opportunity for the                                     vacancy levels and new construction projects,
             industry. Planned expenditures and major                                         more REIT development and investment moving
             improvements paused in April/May but resumed                                     funds to address trend in large single-family rental
             in June with many MRO participants. Interiors                                    communities. New partnerships and ventures
             redesign post-COVID to enclosed workspaces                                       forming with REIT players and independent
             represent new opportunities for occupancy                                        builder/developer - new trend to watch in 2021.
             safety, health and design.

                                                          CONFIDENTIAL -DUCKER HOLDINGS LLC                                                          13
Industry Developments Our Experts are Watching for in 2021

        For a more comprehensive analysis of these developments, please look for Ducker’s 2021 Industry Outlook and Key Opportunity/Risk
                                          Analysis for the US construction industry coming in early 2021

                                                              CONFIDENTIAL -DUCKER HOLDINGS LLC                                            14
USG Post COVID Opportunities

 D U C K E R ’ S W O R K A C R O S S T H E C O R P O R AT E A N D P R I VAT E E Q U I T Y S P E C T R U M Y I E L D I M P O R TA N T N E W D I S C I P L I N E S
 AND AREAS OF FOCUS FOR BEST -IN-CLASS BUILDING PRODUCT BUSINESSES FOR POST COVID SUCCESS.

                                                            BNC CORPORATE STRATEGY FOCUS

                    Portfolio and                   Digital Channel                       Pricing Audits and
                                                                                                                       Adjacency Profile
                     Market Mix                   and UX Experience                            Program
                                                                                                                         and Pursuit
                    Optimization                        Update                               Optimization

                                                     Innovation:                           Modular Systems
                                                   Product, Service,                        and Design-to-
                                                   Business Model                          Install Programs

                                                                      CONFIDENTIAL -DUCKER HOLDINGS LLC                                                            15
RESEARCH & CONSULTING

THIS CONCLUDES OUR PRESENTATION.
THANK YOU.
Today’s presentation was prepared by Ducker Research and Consulting/Ducker Holdings LLC. To the fullest extent permissible by applicable law, all
information contained herein is for informational purposes only and is provided “AS IS”. The information is provided (i) with no guaranty of            BANGALORE | BERLIN | DETROIT | LONDON | NEW YORK | PARIS | SHANGHAI
accuracy, completeness, timeliness or that any defects will be corrected and (ii) without any representations, warranties or other contractual terms
of any kind including, without limitation, warranties of title, merchantability or fitness for a particular purpose. Even if Ducker was advised, knew                              www.ducker.com
or should have known that claims or damages could arise from the use, misuse or delay of use of the information, Ducker assumes no legal liability
for any direct, indirect, consequential, special, punitive or similar claims or damages. The information contained herein does not represent
financial, legal, regulatory or other advice and recommendations from Ducker. Any use of the information is undertaken at your sole risk.
You can also read