2020 FULL-YEAR RESULTS - URW

Page created by Willie Shelton
 
CONTINUE READING
2020 FULL-YEAR RESULTS - URW
2020
FULL-YEAR
RESULTS
2020 FULL-YEAR RESULTS - URW
FY-20
OVERVIEW
JEAN-MARIE TRITANT
       CEO
2020 FULL-YEAR RESULTS - URW
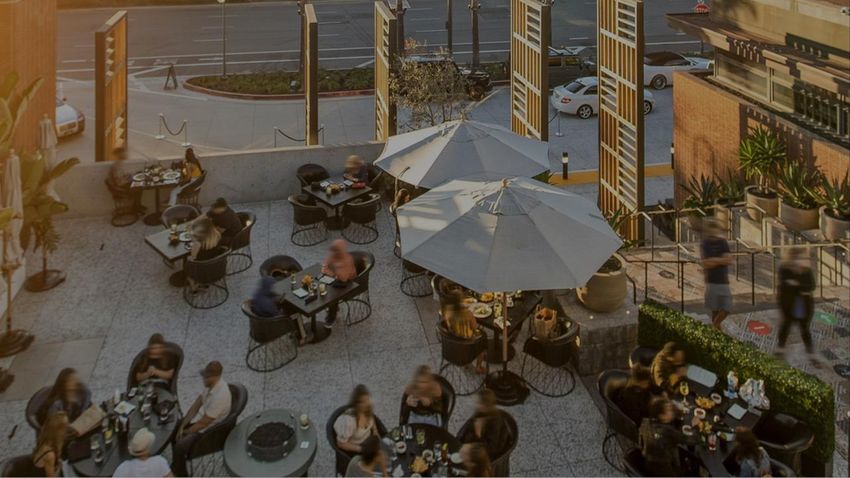
Resilience and readiness

     URW’s organisation has demonstrated resilience in extreme operating conditions
    with positive consumer demand whenever restrictions eased or lifted during 2020

     Flagship destinations continue to attract leading brands and emerging players –
          working together to innovate in a rapidly evolving retail environment

     Focused operational plan for 2021 and clear commitment to deleveraging - URW
           will emerge as a stronger business harnessing the market rebound

                                                                                2020 FULL-YEAR RESULTS   3
2020 FULL-YEAR RESULTS - URW
Tough conditions with positive recovery when restrictions eased
                                                              Total URW footfall and sales excluding F&B and Entertainment

                                    Pre COVID-19                             First wave                        Recovery in Europe                      Second / Third wave
      120%

      100%

      80%

      60%

      40%

      20%

        0%
                                January        February         March            April            May   June         July      August       September October   November December

                                                                                                         (1)                                (2)
                                         SC fully open in % GMV                     SC restricted in % GMV          Footfall in % of 2019         Sales in % of 2019

(1)   Restrictions are defined as closure of the F&B and / or Entertainment sector. Capacity
      restrictions, shelter at home orders, curfews and other comparable measures are not taken
      into account. GMV weighted by restrictions and the proportionate impact on the month                                                                                   2020 FULL-YEAR RESULTS   4
(2)   Includes US footfall only for those assets where reliable figures are available
2020 FULL-YEAR RESULTS - URW
Tough conditions with positive recovery when restrictions eased

        Tough conditions            Strong rebound         Working with tenants

         Strong start to 2020
         but only 70 days of        Footfall recovery,
       normal operations, and     outperformed by sales    Partnership approach to
         93 days on average                                  support tenants and
     “closed”. URW was heavily      Q3 Cont. Europe          innovative response
       impacted due to central     77% of 2019 footfall;        to restrictions
     locations and F&B exposure     86% of 2019 sales

                                                                              2020 FULL-YEAR RESULTS   5
2020 FULL-YEAR RESULTS - URW
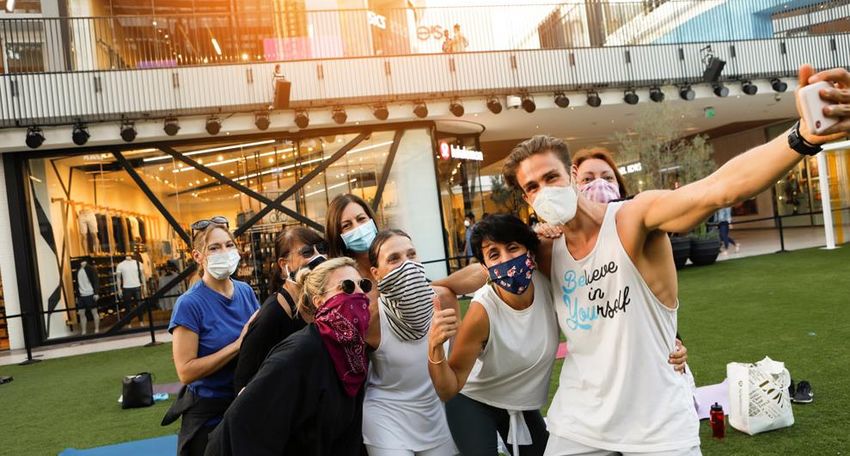
Innovative solutions for tenants and consumers

We ensured a safe and convenient drive-to-store                                                                        … and explored innovative solutions to
experience for customers visiting our centres…                                                                         extend reach of independent retailers
                                                                                                                       Acceleration of technology driven initiatives to
      Industry leading certified health &
                                                                                                                       deliver omni-channel URW experience in
      safety protocols(1): sanitation,
                                                                                                                       collaboration with digital and logistic partners
      social distancing, capacity
      monitoring and hands-free shopping

      Activated additional outdoor space                                                                                                     Maximise sales from stores by
      for tenants - dining terraces                                                                                                          connecting them to the marketplace
      and markets
                                                                                                                                             Access to Zalando’s digital audience -
      Curbside and click & collect in all                                                                                                    5 countries(2)
      US centres and 11 in Europe

      Launched Line Pass – store                                                                                                             Automated outdoor click & collect and
      appointment booking system                                                                                                             ship-from-store hub – open 24/7
      to avoid queues                                                       Open Air Market at Westfield Valley Fair
                                                                                                                                             Proof-of-concept in Westfield Vélizy 2
                                                                                                                                             (France)

(1)   Rolled out to 100% of assets, 87% now certified by Bureau Veritas following audit
(2)   Ongoing roll-out in Germany, The Netherlands, Poland, Spain and Sweden                                                                                   2020 FULL-YEAR RESULTS   6
2020 FULL-YEAR RESULTS - URW
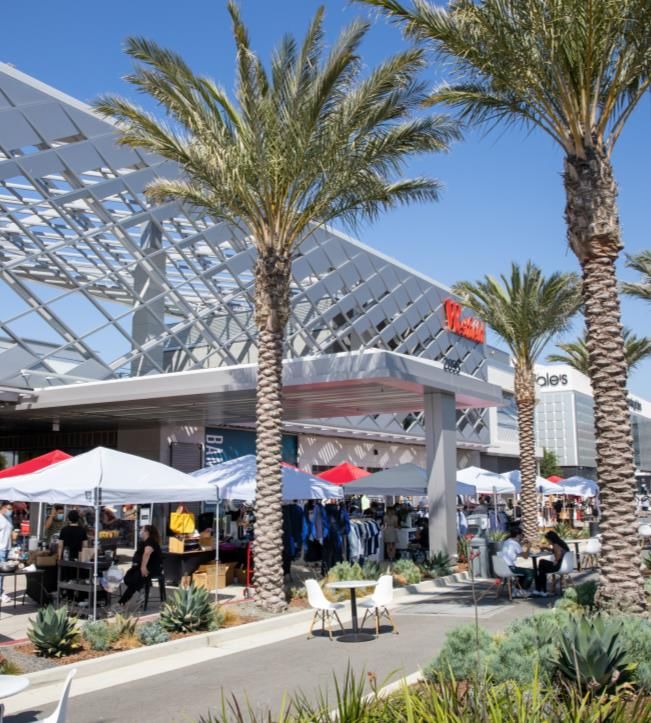
Consumers seek experiences – even at a social distance

                                    Westfield Mission Valley   Westfield Arkadia

Wroclavia                           Westfield London           Westfield Century City

            Continuing to invest in the Westfield brand and experience

                                                                                        2020 FULL-YEAR RESULTS   7
2020 FULL-YEAR RESULTS - URW
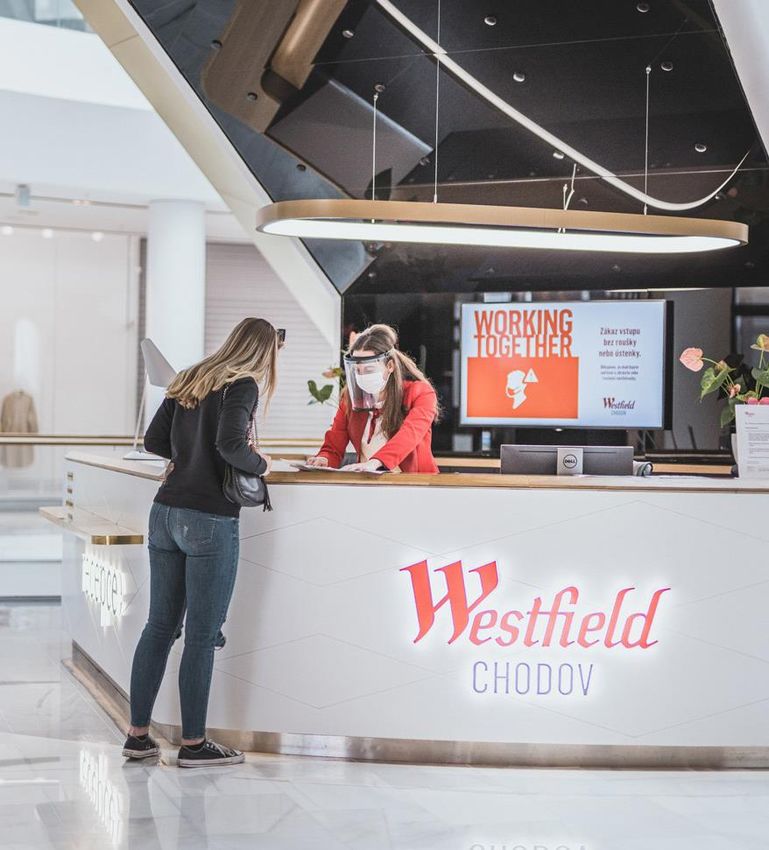
Partnering with tenants to deliver innovative new experiences

    URW and their Westfield Century
City destination was the perfect
platform for the global launch of our
premium outdoor fitness experience
Equinox+ In The Wild as well as a
SoulCycle outdoor studio in 2020 – both
concepts being an unprecedented success
which remain highly coveted by our
members and riders. We are proud to
have moved forward with speed, agility,
and adaptability with our partners at
URW to better serve our community.

           Harvey Spevak
           Executive Chairman & Managing Partner   Westfield Century City

           Equinox

                                                                            2020 FULL-YEAR RESULTS   8
2020 FULL-YEAR RESULTS - URW
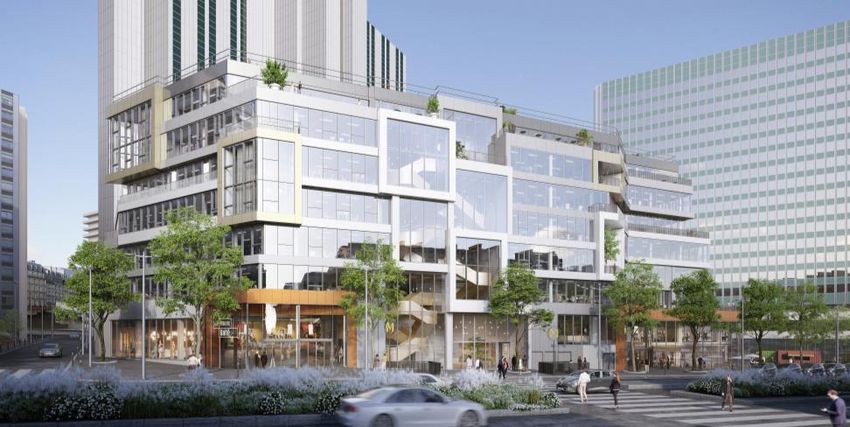
Reinforcing trusted partnerships with leading brands

                                                                                                     1,528 new
                                                                                                    leases signed
                                                                                                     (-36% vs. 2019)
                  10 Deals                     14 Deals          8 Deals          5 Deals

                                                                                                         H1-2020 -44%
                                                                                                         H2-2020 -29%
                   8 Deals                     12 Deals          4 Deals          7 Deals                  (vs. 2019)

                                      Retailers investing in premium locations ahead of market rebound

NB: long-term relettings and renewals only                                                                2020 FULL-YEAR RESULTS   9
2020 FULL-YEAR RESULTS - URW
Emerging retail players choosing URW locations as mix evolves
                                                       Main 2020 signings & partnerships

 INNOVATIVE AUTO

 DIGITALLY-NATIVE
 VERTICAL BRANDS

     LEISURE

 Emerging players seeking Flagship locations to build brand awareness and drive customer acquisition

                                                                                           2020 FULL-YEAR RESULTS   10
Retail and mixed-use phased new development with solid pre-letting
                                                                     Retail                                                Mixed-use

      Letting(1)                                       Letting(1)                        Pre-letting(1)   Pre-letting(1)
      83%                                              93%(2)                            90%(3)           84% & 100%(4)

      GLA                                              GLA                               GLA              GLA                    GLA
      +46,700 sqm                                      +32,900 sqm                       +87,100 sqm      33,700 sqm             64,500 sqm
      Delivered                                        Delivered                         Delivery         Delivery               Delivery
      Mar 2020                                         Nov 2020                          H1-2021          H2-2021                H2-2021(5)
      URW ownership                                    URW ownership                     URW ownership    URW ownership          URW ownership
      50%                                              100%                              100%             100%                   100%
                                                                                         100% TIC         100% TIC               100% TIC
                                                                                         €620 Mn          €200 Mn                €240 Mn

(1)   Letting / pre-letting: GLA signed, all agreed to be signed and financials agreed
(2)   Extension only, 85% incl. restructuring standing asset
(3)   As at January 20
(4)   84% of the Retail and 100% of the Office & Others
(5)   Pullman Hotel to be delivered in H1-2021                                                                                                2020 FULL-YEAR RESULTS   11
Partnership approach to support tenants

         Flexible payment terms as an initial response                                                   Rent discounts granted as at
                                                                                                         December 31 at 100%: €401 Mn
         Negotiations based on fair “sharing burden” principle
                                                                                                         Average relief granted:
         More support for smaller and most impacted tenants                                              1.6 months in Europe
                                                                                                         and 2.1 months in the US
         Support to access government aid where available
                                                                                                         Solid rent collected for the full year:
                                                                                                         80%(1)

                                        Building long-term mutually beneficial partnerships with tenants

(1)   Rent collection rate calculated compared to 100% of rents invoiced, reflecting no adjustment for
      deferred or discounted rent in denominator. See CFO section for more details.                                                   2020 FULL-YEAR RESULTS   12
Targeted ESG strategy with focus on community
                                                                                                                                        2020 ESG awards

                                                                                                                                       94/100

          More than 3.5 MW                                            During COVID-19 pandemic,         Framework on diversity
          of new solar installations                                  245 initiatives group-wide:       & inclusion launched
          in the US in 2020                                           • Installation of 20 testing      • Roll-out of ‘Unexamined
          Group climate targets                                         sites in 16 centres               Bias’ training
          recognised by the                                           • Donation of 98,000              • 92/100 in French Gender
          Science Based Targets                                         protective equipment              equality Index
          initiative (aligned with                                      pieces to 33 key                • New target: achieve 50%
                                                                        organisations
          1.5°C trajectory)                                                                               diverse profiles in Senior
                                                                      226,000 meals saved with            Manager positions by 2025
                                                                      Too Good To Go(1)                 2,500+ volunteering
                                                                                                        hours from employees

(1)   Too Good To Go is an application which allows people to purchase unsold food at a discount from
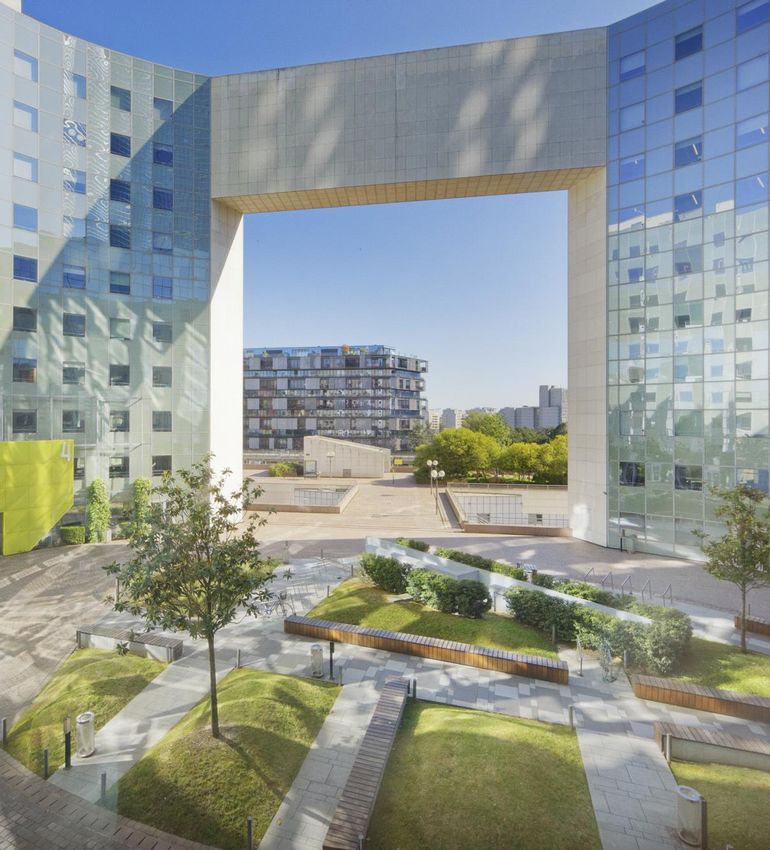
      top eateries at end of service, to prevent it from being thrown away                                                                      2020 FULL-YEAR RESULTS   13
Trinity showcases URW’s Better Places ambition

                                                                  Sustainability certifications

                     GLA             Built with low
                     49,500 sqm
                                     carbon concrete
                                     (-30% emissions)
                     Delivered
                     Nov 2020                                              EXCEPTIONAL
                                     Operable windows
                                     offering natural
                     URW ownership   ventilation
                     100%
                                     Terraces and loggias on
                                     every floor, comprising of
                     Letting
                     In progress     more than 1,500 sqm in                 EXCELLENT
                                     total

                                                                             2020 FULL-YEAR RESULTS   14
Clear operational and financial focus

                      Operational                                            Financial

 CONCENTRATION      DIFFERENTIATION     INNOVATION                        DELEVERAGING

  Focus on            Continue to       Accelerate             Complete €4 Bn European disposal
  Flagship            invest in         adoption of data       programme
  destinations in     Westfield brand   and digital            (2021/2022)
  best catchment      to attract best   capabilities
  areas               brands and                               Implement programme to significantly
                      deliver best      Expand                 reduce financial exposure to the US
  Intensive asset     experiences       “Connected             (2021/2022)
  and operating                         Retail” offer to
  management to       Target emerging   drive footfall and     Strict control of CAPEX, cost base and
  accelerate post     uses to evolve    tenant reach           focused development pipeline
  COVID-19            retail mix                             Process underpinned by continued access to
  recovery                                                   credit markets and ample liquidity

                                                                                             2020 FULL-YEAR RESULTS   15
Re-emerging as the most attractive retail focused listed real estate
company
         Most attractive fundamentals                         Outstanding growth potential

 OPERATIONAL
    Unrivalled Flagship destinations in best catchment   Commercial tension driving reversionary potential
    areas

    Strong retailer base combining leading established   Continued expansion of Connected Retail offer
    and emerging brands - with low vacancy               to capitalize on converging physical and online offer

    Superior customer experience driving traffic         Untapped data and media revenues generation
    and differentiation

                                                         Data and technology enabled operational
 FINANCIAL                                               improvement and efficiencies
    Restored balance sheet
                                                         Innovative value-added mixed-use developments
    Solid financial performance                          to further expand possible uses and tenants
    Targeted investment to drive growth

                                                                                                  2020 FULL-YEAR RESULTS   16
Right team in place to deliver on vision

                                                                Comprehensive Management Board

      Jean-Marie TRITANT                     Fabrice MOUCHEL             Astrid PANOSYAN                    Olivier BOSSARD               Michel DESSOLAIN
       Chief Executive Officer               Chief Financial Officer     Chief Resources Officer            Chief Investment Officer   Acting Chief Customer Officer(1)

                 Expanded team to align with immediate and                                         Newly created CCO role to drive innovation and
                 medium term strategic focus                                                       capitalize on digital and data capabilities for
                                                                                                   future growth

(1)    Permanent guest to Management Board                                                                                                     2020 FULL-YEAR RESULTS   17
FY-20
FINANCIAL REVIEW
    FABRICE MOUCHEL
          CFO
FY-2020 Results
      € Mn                                                                           FY-2020            FY-2019   Change    Lfl Change

      Shopping Centres                                                                 1,699             2,293     -25.9%    -24.0%

      Offices & Others                                                                       85           103      -16.9%    +0.1%

      Convention & Exhibition                                                                  6           95      -93.6%    -93.6%

      Net Rental Income                                                                1,790             2,491     -28.1%   -26.4%

      Recurring Net Result (Group share)                                               1,057             1,760     -40.0%

      Recurring EPS                                                                      7.63            12.72     -40.0%

      Adjusted Recurring EPS(1)                                                        7.28              12.37    -41.1%

(1)   The Adjusted Recurring Earnings are calculated based on the Recurring net result for the period
      attributable to the holders of the Stapled Shares minus the coupon on the Hybrid Securities
      Figures may not add up due to rounding                                                                                 2020 FULL-YEAR RESULTS   19
Impact of pandemic on FY-2020 AREPS

                                  -€1.78

                                                        -€1.05
                                                                              -€0.68
                                                                                                    -€0.53
                                                                                                                  -€0.27                                             +€0.39
                                                                                                                             -€0.26
                                                                                                                                         -€0.49
                                                                                                                                                      -€0.42
            €12.37

                                                                            COVID-19: -€4.57
                                                                                                                                                                     €6.89             €7.28

                                                                                                                                                               (2)            (3)
            AREPS              P&L impact              Doubtful              Variable          Convention &      Financial   Services   Disposals   Letting fees     Others            AREPS
           FY-2019              COVID-19               debtors               income             Exhibition (1)   expenses                                                             FY-2020
                               rent relief                                   streams
(1)   Group share
(2)   From 2020 internal letting fees are no longer capitalised but expensed in the P&L
(3)   Including minority interest in retail, taxes, contribution of affiliates, FX impact, administrative
      expenses (excl. letting fees) and others                                                                                                                                2020 FULL-YEAR RESULTS   20
Like-for-like retail NRI evolution impacted by rent relief and
doubtful debtors

                                     Net closures,
                                       renewals,        COVID-19 rent
                     Indexation   relettings & others      relief       Doubtful debtors   Total Lfl

Continental Europe     1.3%             -5.3%             -11.6%             -3.5%          -19.1%

United Kingdom         0.0%            -24.9%             -16.2%             -8.3%          -49.3%

United States          0.0%             -5.9%              -9.7%            -12.4%          -28.0%

Total URW Group        0.8%            -7.0%             -11.4%             -6.4%           -24.0%

                                                                                           2020 FULL-YEAR RESULTS   21
COVID-19 rent relief: cash and accounting impact

                     Rent relief(1) granted to URW retailers as at December 31:
                          • Cash impact: €313 Mn vs. €54 Mn as at September 30
                          • P&L impact: €246 Mn vs. €32 Mn as at September 30

                     Most agreements executed in Q4 - in line with expectations

                     Impact of second wave for 2020 included

                     Difference between cash and P&L impact due to straight lining in accordance with IFRS where
                     concessions were received, e.g. waiver of co-tenancy provisions and extension of firm lease period

(1)   On a proportionate basis                                                                                        2020 FULL-YEAR RESULTS   22
FY-2020 rent collection at 80%(1) with rate increasing when centres
  opened
                         Continental
               Collected   Europe                               UK                   US                                          FY collection rates

      Q1 96%                            97%                   98%                  93%                               10%

                                                                                                                                         7%
                                                                                                                                                            3%
      Q2 61%                            67%                   66%                  48%

      Q3 85%                            95%                   78%                  70%
                                                                                                      100%

      Q4 76%                            81%                   74%                  68%                                                   83%                                      80%

      FY 80%                            85%                  79%                  70%
    of
  due:(2)
                  88%                   94%                  84%                  79%
(1)   Rent collection rate calculated compared to 100% of rents invoiced, reflecting no              Invoiced   Relief granted       Provisioned (3)    Remaining              Collected
      adjustment for deferred or discounted rent in denominator
                                                                                                                                                       overdue and
(2) Excluding deferrals and rent relief granted or under process                                                                                                  (4)
(3) On a proportionate bases: €203 Mn of receivables provisioned (including Offices & C&E)
                                                                                                                                                       not due yet
(4) Deferred until after January 31
NB: retail only, including rents, SBR, service charges and CAM, assets at 100%. Data as at January
31. Figures may not add up due to rounding                                                                                                                              2020 FULL-YEAR RESULTS   23
Bankruptcies reflect impact of COVID-19

                                                                                                                       Sector split of bankruptcies:
                                    Cont. Europe                       UK                   US           URW

      # of stores                             322                        62                 268          652
                                                                                                                                    13%

      % of total units                       4.2%                      7.9%                 6.5%         5.2%                4%

      In place                                188                        42                 172          402            7%

                                                                                                                                                     53%
      Replaced                                  52                         0                 12           64            7%

      In place
                                             75%                       68%                  68%          71%
      / replaced
                                                                                                                                  16%
      Vacant                                    82                       20                  84          186

                                                                                                                Fashion Apparel                 Food & Beverage
                                                                                                                Bags & Footwear & Accessories   Health & Beauty
              Annualised potential MGR exposure : 4.3%                                             (1)
                                                                                                                Jewellery                       Other

(1)    Exposure as at % of the total MGR (leasing revenue for United States and Austria).                                                         2020 FULL-YEAR RESULTS   24
Vacancies stabilising between Q3 and Q4

                                                                                         13.1%

                                                                                11.2%

                                                   9.7%
                                        9.4%
                                                                       9.1%
                                                                                                                    8.3%
                               7.7%                                                                     7.7%

                                                                                                 5.4%
             4.7%       4.9%

   2.5%

          Continental                   UK                                       US                     Group
            Europe
                                 FY-2019 Vacancy          Q3-2020 Vacancy     FY-2020 Vacancy

                                                                                                          2020 FULL-YEAR RESULTS   25
Leasing activity picked up in H2
                                                                              Number of deals(1): 1,528 (-36% vs 2019)

                        2020 leasing activity impacted by
                                                                                                                           484
                             COVID-19 tenant negotiations                                                                (-22%)
                                                                       428
                                                                     (-23%)
                                                                                                          383
                                                                                                        (-36%)
                                                                                                                          206

                                  Cont.                               231
                                                                                         233             201
                                 Europe     UK        US     URW                       (-63%)

      MGR uplift
                                 +1.7%     +0.4%    -20.3%   -5.1%
      (in %)                                                                            130
                                                                                                                          278
                                                                      197                                182
      MGR signed
                                  €134       €18      €66    €219                       103
      (in € Mn)

                                                                       Q1                Q2               Q3              Q4

                                                                                         Relettings   Renewals

(1)   Standing assets only                                                                                        2020 FULL-YEAR RESULTS   26
Offices & Others: results reflect disposals

Net Rental Income
(€ Mn)              FY-2020   FY-2019   Growth   Lfl Growth

France                56        72      -22.3%     +0.7%

Nordics               10        10       +2.0%     +1.0%

Others                 8         7       +8.3%     +6.7%

US                    11        13      -16.1%     -8.0%

Total                 85      103       -16.9%   +0.1%
                                                              Les Villages de l’Arche

                                                                                        2020 FULL-YEAR RESULTS   27
Convention & Exhibition: a grim year

                                                                                                                  Restart activity              Q4-2021 / Q1-2022
                                                                                                       Change
      € Mn                                              FY-2020                        FY-2019        2020/2019

                                                                                                                  Back to “normal”              2023
      Net Rental
                                                              6                             95         -93.6%
      Income

                                                                                                                  Paris Olympics                From H2-2023
      Property Services
                                                              6                             62         -90.2%
      & Other Income

                                                                                                                     Strong interest from organisers for 2021-22

      Recurring Net
      Operating Income
                                                            12                           157          -92.3%
                                                                                                                  144                       37
                                                                                                                  bookings 2021(1)          bookings 2022(1)

(1)   Signed as at February 10. 2021 bookings are subject to a special COVID-19 cancellation policy                                               2020 FULL-YEAR RESULTS   28
Lfl revaluation: -13.1% since 2018, of which -11.3% in 2020
                                                                                       Lfl revaluation since FY-2018(1)                         FY-2020: -11.3%
                                                                                                                                            o/w H1-2020: -5.1%(2)
      5%                                                              Revaluation 2019               Revaluation 2020   Total Revaluation

      -5%

  -15%

  -25%

  -35%
                        Continental Europe                                        United Kingdom                         United States              URW
                          (68% of GMV)                                             (6% of GMV)                           (25% of GMV)

      Discount rate(3)            +0.3%                                                 +1.3%                               +0.2%                  +0.3%

      Exit cap rate(3)            +0.2%                                                 +1.2%                                0.0%                  +0.2%

      Δ NRI Exit Year(3)           -3.4%                                                 -7.9%                             -10.2%                   -6.1%

(1)   Based on the Lfl revaluation reported
(2)   The change compared to the -5.2% communicated in H1-2020 is due to a change in the like-for-
      like perimeter
(3) Vs. 2019 valuations
NB: retail only. Figures may not add up due to rounding                                                                                                  2020 FULL-YEAR RESULTS   29
EPRA NRV evolution
                                                                EPRA Net Reinstatement Value(1)
                                                                       (in € per share)
        €228.80

                                                                                                                               +€4.55

                                      -€35.70
                                                                                                      +€7.63
                                                   -€10.90                                                                              €166.80
                                                                       -€8.25
                                                                                       -€5.40                         -€9.38

      December 2019                   Lfl Asset     Goodwill         Non Lfl Asset     Dividend   Recurring Results   Other         December 2020
                                     Revaluation   Impairment        Revaluation &
                                                                   Intangible Assets

(1)   Hybrid securities are excluded from NAV                                                                                     2020 FULL-YEAR RESULTS   30
Ample LTV covenant headroom

                                                                                                       IFRS Loan-to-value(1)

                                                                                                                                                                                      60%

                  42%                                                                                                                                                                           44.7%
                                                  41%
                                                                                                                                        38%                                                     44.0%(2)
                                                                                                                  37%                                                      37%
                                                                                                                                                      35%
                                                                       33%

                                                                                                           32%                                                33%

                                                                             25%

               2000      2001       2002      2003      2004      2005       2006      2007      2008      2009    2010   2011   2012   2013   2014   2015   2016   2017    2018   2019    2020

                                    Typical covenant level
                                                                                                            Proportionate LTV(1): 46.3% or 45.6% pro-forma(2) (vs. 40.5% as at FY-2019)
                                    Target range

(1)   Excluding the hybrid
(2)   Pro-forma for the receipt of the proceeds from the disposal of the Shift and Les Villages 3, 4 and
      6 offices buildings                                                                                                                                                                 2020 FULL-YEAR RESULTS   31
Credit ratios reflect COVID-19 impact on EBITDA

                    Interest cover ratio                                                         Net debt to EBITDA

                                                                                                                                                14.6
                                              6.7
                                                      6.1
                                      5.9                   5.7
                                                                                                                         10.5
                                4.6                                                                                                      9.9
                                                                                                    8.5
           4.1
   3.8                                                             3.5                                             8.5
                         3.5                                                               7.7

                                                                                5.8
                                                                  2.0

 2008 2009 2010 2011 2012 2013 2014 2015 2016 2017 2018 2019 2020        2008 2009 2010 2011 2012 2013 2014 2015 2016 2017 2018 2019 2020

                      Typical covenant level

                                                                                                                                2020 FULL-YEAR RESULTS   32
Comprehensive and clear deleveraging strategy

                      Implement programme         Controlled CAPEX
   Complete €4 Bn                                                       Suspend dividend
                      to significantly reduce     deployment with
  European disposal                                                     payment for fiscal
                       financial exposure to    focused development
     programme                                                         years 2020, 2021 and
                                US              pipeline and reduced
    (2021/2022)                                                               2022
                           (2021/2022)               cost base

        Continued access to credit markets and ample liquidity underpins strategy

                                                                                 2020 FULL-YEAR RESULTS   33
Dividend

  Uncertain operating         Once deleveraged and         Due to negative statutory
  environment and strategic   repositioned, URW will       results, no SIIC dividend
  focus on deleveraging:      resume a dividend policy     distribution obligation is
  suspension of dividend      based on a significant pay   anticipated for those years:
  payment for fiscal years    out, sustainability and       In compliance with REIT regime
  2020, 2021 and 2022         growth                        SIIC obligation delayed until
                                                            statutory distributable income
                                                            is available

                                                                                 2020 FULL-YEAR RESULTS   34
€2.3 Bn in disposals signed in 2020

      10 Assets:                  NIY: 4.6% Premium(1): +0.3%                5 European retail assets         2 European offices    3 US retail assets

      Aéroville                          So Ouest               Confluence                      Rennes Alma                    Toison d’Or

      Westfield Meriden                  Westfield Siesta Key   Westfield Sunrise               SHiFT                          Les Villages 3, 4 & 6

(1)    Compared to FY-2019 valuations                                                                                                        2020 FULL-YEAR RESULTS   35
Development pipeline reduced with built-in flexibility
              €8.3 Bn

                                              -€1.3 Bn

                                                                                       €4.4 Bn

                                                                 -€2.6 Bn
                                                                                        €1.5 Bn
                                                                                                                          €2.5 Bn

                                                                                                         -€1.9 Bn          €1.4 Bn
                                                                                        €2.9 Bn

                                                                                                                           €1.2 Bn

                FY-2019                       Deliveries     Removed
                                                           Removed     projects,
                                                                    projects, net of   FY-2020         Invested to date   Remaining
                                                             net of new projects
                                                              new projects and
                                                            and reporting
                                                              reporting   changes
                                                                        changes

                                                                     Committed(1)      Controlled(1)

(1) Please refer to the MD&A for definition
Figures may not add up due to rounding                                                                                    2020 FULL-YEAR RESULTS   36
Positive impact on IFRS LTV under varied US disposal conditions
                                                                                                                  Discount to December 31, 2020, valuations for US disposal:

                                                                                                          -0%        -10%           -20%           -30%            -40%              -50%
           44.7%
                                   43.2%
                                                           38.8%
                                                                                                                                                                                      37.0%
                                                                                                                                                                   34.0%
                                                                                                                                                   30.9%
                                                                                                                                    27.8%
                                                                                                                     24.8%
                                                                                                          21.7%

          FY-2020              Pro-forma:              Pro-forma:                                                 Indicative pro-forma LTV with disposal of 100% of US portfolio(2)
                               €2Bn CAPEX              €2Bn CAPEX
                               €2Bn illustrative €2Bn illustrative
                               earnings(1)       earnings(1)
                                                       €4Bn EU disposals

(1)   Illustrative total retained earnings for 2021 and 2022, based on FY-2020 results, not intended to
      be and should not be taken to be guidance
(2)   Based on the 2020 asset values including transfer taxes, but excluding potential transaction
      costs. Gross asset valuation discount applied on an IFRS basis                                                                                                           2020 FULL-YEAR RESULTS   37
Good credit market access with opportunistic fund raising in 2020

Euro Senior Bonds
         April         June          November

                                                        Avg coupon:
       €600 Mn       €750 Mn          €1 Bn                1.66%
       5-years        12-years        Long 6-years
       2.125%         2.0%            0.625%

       €800 Mn                        €1 Bn
                                                        Avg maturity:
       10-years                       11-years           9.0 years
       2.625%                         1.375%

                                                            2020 FULL-YEAR RESULTS   38
Ample liquidity to cover next 24-months

                                                                                         Sources and uses(1) (in € Bn)
                                          1

          Illustrative
             retained                   2.0
             earnings(2)

                                                                           Debt                   4.8
                                                                       maturities
                                                                                                                                                           €4.7 Bn
         Credit lines(3)                3.2

                                                                                                                                       Planned further
                                                                                                                                                               3.2
                                                                                                                                           EU disposals
Secured disposals(4)                    0.8
                                                                            CAPEX                 2.0

      Cash position                     2.3
                                                                                                                         1.5                                   1.5

                                     Sources                                                     Uses             Net sources - uses                      Total liquidity

(1)   Excluding any new financing credit lines extension or non signed disposals
(2)   Illustrative retained earnings, based on FY-2020 results, not intended to be and should not be
      taken to be guidance
(3)   Includes only credit lines with a maturity extending beyond two years. Subject to covenants
(4)   Incl. the proceeds of Shift, received on January 21, 2021                                                                                              2020 FULL-YEAR RESULTS   39
CONCLUSION
 JEAN-MARIE TRITANT
        CEO
Realistic expectations for 2021 with strong focus on execution

                                                                                                                 GDP Forecast Change YoY
                                                                                                       (Goldman Sachs Global Investment Research)(1)
        First                       Conditions will remain challenging with 52% of portfolio
      quarters                      currently closed today                                     30%

                                    Restrictions in most markets expected to continue into     20%
          2021                      at least Q2
                                                                                               10%

                                                                                                0%

                                    Recovery to commence in Q3 with markets to experience      -10%
                                    different trajectories based on infection rate and
      Year end                      vaccination roll out                                       -20%

          2021                      Capitalise on consumption driven economic recovery, led    -30%
                                                                                                       Q4     Q1     Q2        Q3      Q4     Q1         Q2      Q3      Q4
                                    by US and other stimulus programmes, that will favour             2019   2020   2020      2020    2020   2021       2021    2021    2021
                                    URW portfolio                                                             United States          United Kingdom            EU 27

      No guidance for 2021 until clearer visibility on timing of economic recovery and operating conditions

(1)   Data as at February 3, 2021                                                                                                                     2020 FULL-YEAR RESULTS   41
Emerging as the most attractive retail focused listed real estate
company

      Restore attractive           Capitalize on economic      Deliver sustainable growth
        fundamentals                      recovery                 as total return play

 Operational focus on Flagship   Best placed to benefit from     Financial performance
       destinations and          consumption driven rebound    enhanced by targeted new
 comprehensive deleveraging        and pent-up demand for      development and industry
 to strengthen balance sheet         “real” experiences           leading use of data

                                                                               2020 FULL-YEAR RESULTS   42
APPENDIX
2021 restrictions

      Czech Republic                    Austria                     Denmark                       France

  National lockdown            F&B and entertainment        National lockdown            Non-essential shops in large
  Non-essential shops closed   closed                       Non-essential shops closed   shopping centers (>20,000
                                                                                         sqm) closed

                                                                                                                               48%
          Germany                 The Netherlands                    Poland                       Sweden                    Shopping
  National lockdown            National lockdown            F&B and entertainment        Event attendance limited          centres are
  Non-essential shops closed   Non-essential shops closed   closed                       Strong recommendation to           currently
                                                                                         not visit stores
                                                                                                                             open by
                                                                                                                              value

          Slovakia                       Spain                    UK (London)                        US

  National lockdown            Non-essential shops closed   National lockdown            Restrictions vary per county
  Non-essential shops closed   in Catalonia                 Non-essential shops closed   Most centres have 20 – 50%
                               Nationwide curfew                                         capacity limitations
                               Various other local
                               restrictions

                                                                                                                        2020 FULL-YEAR RESULTS   44
URW supported its local communities

               88 food distributions were organized   11 assets engaged to support non-
               by the Group’s assets for first        profit and authorities fighting
               responders, homeless people,           domestic violence, opening
               disadvantaged families or isolated     dedicated spaces or raising
               elderly people                         awareness.
               Over 32,100 people supported           Over 60 women supported

               27 blood donations sites were hosted   23 centres engaged to maintain
               in the Group’s premises                education and studies throughout
                                                      the year by donating supplies,
               Over 3,800 individual blood
                                                      equipment, scholarship or supporting
               donations were collected
                                                      virtual learning sessions.
                                                      Over 2,400 children and students
                                                      supported

               70% of the Group’s Flagship assets     20 testing sites opened on the
               engaged to support local               Group’s premises
               entrepreneurship
                                                      Over 35,000 people tested
               Over 100 entrepreneurs supported
               through space donation, service
               provision, marketing promotion or
               financial support

                                                                        2020 FULL-YEAR RESULTS   45
Upcoming debt refinancing

                                                                                                                                           15.8

                       2.5                                                                                                       3.0
                                                            1.9                                     1.4               1.7

                     0-1 Y                                1-2 Y                                2-3 Y                 3-4 Y      4-5 Y     >5Y
                                                                                               Gross Financial Debt (in € Bn)

             The average residual maturity of undrawn credit lines stands at 1.9 years

Nb: URW’s debt profile as at December 31, 2020. On an IFRS basis. Excluding from chart: €1,250 Mn
Hybrid NC 2023 and €750 Mn Hybrid NC 2026 treated as equity under IFRS and undrawn facilities                                           2020 FULL-YEAR RESULTS   46
Low cost of debt and record average maturity
                           Average Cost of Debt                                                             Average Maturity
                                                                                                                (years)
       3.9%                                                                                                                                         8.4
                                                                                                                                           8.2
                 3.6%
                        3.4%                                                                                                        7.5
                                                           EUR   (1)
                                                                        USD & GBP
                                                                                                                              7.2
                                                           1.1%          3.6%                                           7.0
                               2.9%
                                                                                                                  6.5
                                      2.6%
                                                                                                            5.9
                                             2.2%                                                     5.4
                                                                                                4.9
                                                                                          4.5
                                                                                    4.3
                                                    1.6%         1.6%
                                                                             1.7%

                                                       1.4%

       2010 2011 2012 2013 2014 2015 2016 2017 2018 2019 2020                       2010 2011 2012 2013 2014 2015 2016 2017 2018 2019 2020

(1)   Including SEK                                                                                                                  2020 FULL-YEAR RESULTS   47
Bond spreads have come down as a result of central bank actions

   in bps
      400

      350

      300

      250

      200

      150

      100

       50

        0
     11/03/2020   11/04/2020     11/05/2020      11/06/2020      11/07/2020   11/08/2020    11/09/2020     11/10/2020     11/11/2020    11/12/2020       11/01/2021

                               ULFP CDS EUR SR 5Y D14 Corp - Last Price        ULFP 1 ⅜ 03/09/2026 REGS Corp - Bloomberg Mid Z Spread

                                                                                                                                                     2020 FULL-YEAR RESULTS   48
URW.COM

          49
You can also read