1H22 Results 16 February 2022 - AFR
←
→
Page content transcription
If your browser does not render page correctly, please read the page content below

1H22 Results 16 February 2022

Our purpose                                     Greg Moshal
                                                Chief Executive Officer, Co-Founder

is to keep
small business                                   Beau Bertoli
                                                 Chief Revenue Officer, Co-Founder

moving
                                                 Ross Aucutt
Changing the way small businesses                Chief Financial Officer
experience finance through digital innovation
– helping SMEs prosper

                                                                                      2
Record half year performance
across all key metrics

Originations¹                                                                                                        Revenue²

       ▲                     $315.1m                                                                                            ▲                        $78.5m
   75%                       from $180.1m (1H21)
                                                                                                                            41%                           from $55.8m (1H21)

EBITDA                                                                                                               Closing Gross Loans

       ▲                     $9.6m                                                                                              ▲                        $514.6m
  134%                       from $4.1m (1H21)
                                                                                                                            51%                           from $341.7m (1H21)

  1.   All references to Originations in this document are from all sources, including Small Business Loan, Line of Credit (including undrawn amounts), Back to Business Loan, Back to Business Line (including undrawn amounts) in Australia and New Zealand. Small
       retrospective changes in origination figures may occur as result of back dated cancellations or modifications to support customer outcomes.                                                                                                                     3
  2.   Revenue before transaction costs.
Significant progress in key strategic deliverables
                           AU/NZ                                            ✓ >$2.4bn1 of lending provided to small businesses in AU and NZ since inception, adding $9.6bn to GDP2
                           Leadership                                       ✓ Recognised as Australia & New Zealand's #1 online small business lender3

                                                                            ✓       Record originations of $315m
                           Customer                                         ✓       New Zealand originations up 110% on 1H21
                           Acquisition                                      ✓       13,200+ active customers
                                                                            ✓       Static loss rates within Board mandated tolerance (4-6%)

                                                                            ✓ Leveraging customer data and industry insights in our proprietary Credit Decision Engine,
                           Data /                                             driving scale and efficiency
                           Technology                                       ✓ Investment in technology to deliver new products, improving user experience and enhancing customer
                                                                              lifetime value resulting in record originations in the half

                                                                            ✓ Inaugural $200 million Term Asset Backed Securitisation issued and priced in September. The first of this
                           Funding platform                                   asset class in Australia, providing significant cost of funding benefits and cash efficiency
                           for growth                                       ✓ $580.7 million in available third-party facilities ($105.1 million in available undrawn facilities) and $110.5
                                                                              million of cash ($62.4 million is unrestricted)

                           Investing                                        ✓ Increased investment in building and developing new products, including our All-in-One Business Account, as
                           for growth                                         well as continued investment in existing products and platforms for optimisation

1.   All references to Originations in this document are from all sources, including Small Business Loan, Line of Credit (including undrawn amounts), Back to Business Loan, Back to Business Line (including undrawn amounts) and ProspaPay in Australia and New Zealand, unless otherwise
     indicated. Small retrospective changes in origination figures may occur as result of back dated cancellations or modifications to support customer outcomes.
2.   RFi Group research, The economic impact of Prospa lending to small business, commissioned by Prospa, January 2019.
3.   In the Non-bank Financial Services category, Prospa is the #1 ranked online small business lender in Australia and New Zealand on independent review site TrustPilot with a TrustScore of 4.9 and over 6,200 reviews in Australia and a TrustScore of 4.9 and over 800 reviews in New Zealand as   4
     at 31 December 2021.
Section 1   Prospa update            6

         Section 2   1H22 Financials          10

Agenda   Section 3   Strategy and outlook     16

         Section 4   Capital management       22

         Section 5   Additional information   26

                                                   5
SECTION 1

Prospa
update

            1
            6
Record performance with all time high half yearly originations
$315m of originations achieved, underpinned by strong growth in small business loans across
Australia and New Zealand and maintained the Line of Credit performance

     Total originations ($m)1
                                                             +75%                                       • Originations of $315m, at an all time high,
                                                                  303
                                                                                         315              up 75% on pcp (1H21: $180m)
                                                                                                        • Small Business Loans originations up 59% on
                                                                                                          pcp (1H21: $152m)
                   180                                            233                    242
                                                                                                        • Another half of strong support for Prospa’s
                                                                                                          Line of Credit, with originations up 161% on
                   152                                                                                    pcp (1H21: $28m)
                                                                  70                      73            • New Zealand originations increased 110%
                    28                                                                          +161%     on pcp (1H21: $24m)
                 1H21                                        2H21                        1H22
                Small Business Loans                                    Line of Credit

1.   Quarterly totals may not add up precisely due to rounding.
                                                                                                                                                         7
Record performance across all key financial metrics

     Closing Gross Loans ($m)                             Revenue ($m)1
                                            +51%                                       +41%
                                                   515                                                          79
                                            427                                          62
                       342                                          56

                      1H21                  2H21   1H22           1H21                 2H21                 1H22

     Operating cash flow ($m)                             Employee and operating costs as a % of revenue2 (%)
                                            +95%
                                                    25                                 -15%
                                             22
                                                                   57%                  60%
                                                                                                                48%
                        13

                      1H21                  2H21   1H22           1H21                 2H21                 1H22

1.   Revenue is before transaction costs.
2.   OPEX excludes JobKeeper payments.
                                                                                                                      8
Significant loan book growth, underpinned
by a well diversified portfolio
     Closing Gross Loans by lending period ($m)                                                                              Portfolio by geography
                                                                                                                                             1% 1% 1%
                                                 +51%                                                                                  7%
                                                                                                                                                        26%
                                                                                     515                                          9%
                                                                                                                                                                         NSW         NZ   TAS
                                                  427
                342                                                                                                                                                      VIC         WA   ACT
                                                                                                      Small Business Loans
                                                                                     410                                                                                 QLD         SA   NT
                                                                                                      Line of Credit
                                                  359                                                                         16%
                306

     36                               68                                             105                                                                 20%

               1H21                              2H21                                1H22                                              19%

     Portfolio by number of number years trading2                                                                            Portfolio by industry1
                                9%                                                                                                     15%
                                                       16%                                                                                              23%
                   8%
                                                                                                                               6%                               Building And Trade        Wholesaling
                                                                                            0.5 - 3      11 - 15
                                                                                                                                                                Retail                    Manufacturing
                                                                                            4-7          16 - 20
                                                                                                                             7%                                 Professional Services     Other
           16%                                                                              8 - 10       21+
                                                                                                                                                                Hospitality

                                                                                                                                                          18%
                                                               35%                                                             13%
                    16%
                                                                                                                                                 18%
1.   As per Financial Statements, note 11.
2.   Based on the weighted average principal receivables balance as at 31/12/2021.
                                                                                                                                                                                                          9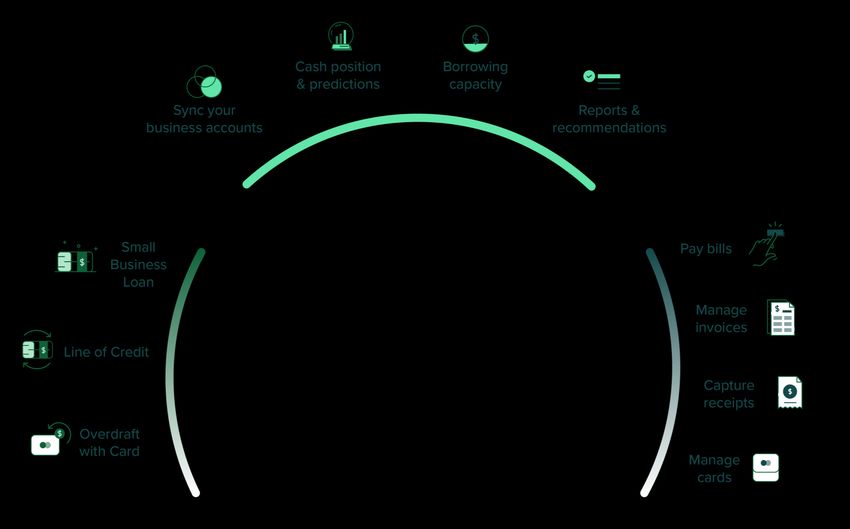
SECTION 2

1H22 Financials

             2    10
Summary 1H22 financials1
1 75% increase in half yearly originations, with origination
134% increase in EBITDA from revenue growth and scale efficiency volume growing to quarterly and half yearly records. Strong
momentum with 2Q22 originations of $186.6m
Var. Var. % up 85.3% on pcp
$m 1H22 1H21 1H20
on pcp on pcp
2 Revenue before transaction costs up 40.7% on pcp
1 Originations 315.1 180.1 305.8 135 75.0 and the highest half-year revenue result in PGL‘s operating
history
2 3 Increase in transaction costs trending in line with growth in
Total revenue 78.5 55.8 75.6 22.7 40.7 originations and revenue
3 Transaction costs 5.2 3.6 4.2 1.7 46.4
Cost of funds has increased at a slower rate than the growth in
4
4 Funding Costs 11.2 8.1 9.4 3.0 37.1 revenue as a result of restructuring funding facilities and the
launch of the term ABS. Further improvement expected to
Gross Profit2 62.1 44.0 62.1 18.0 41.0 come through in future periods
5 Loan Impairment 14.7 10.9 14.1 3.8 35.2 5 Please refer to slide 14 for further detail on impairment costs
6 Employee Expenses 21.1 16.5 22.2 4.7 28.3
6 1H21 included $2.7m of Jobkeeper benefit. Excluding
Operating Expenses 16.6 12.5 20.1 4.1 32.6 Jobkeeper, employee expenses grew by 10.3% mainly from
investment in technology
7 Total Expenses 52.4 39.9 56.5 12.6 31.5
7 Operating leverage is starting to emerge with total operating
EBITDA 9.6 4.1 5.5 5.5 134.0 expenses increasing by 31.5% verse revenue growth of 40.7%.
By bringing the business back to pre-pandemic levels the
foundations are laid for further revenue growth in future
8 Unrestricted cash 62.4 47.0 43.8 15.4 32.8 periods
Operating cash flow 25.4 13.0 14.0 12.4 95.4 8 Unrestricted cash increased 32.8% driven by a doubling
of operating cash flow with funding restructure benefits, offset
1. Totals may not add up precisely due to rounding. by book growth
2. All references to Gross Profit in this document is calculated as Total Revenue less Funding Costs less Transaction Costs.
11Margins continue to improve as the portfolio
reaches scalable size
Portfolio yield (%) Employee and operating expenses as % of revenue2
P&D
33.4 34.3 59.9
59.9% GTM
32.5
56.8%
56.8
G&A
48.0%
7.3 7.2
1H21 2H21 1H22
5.5
Funding cost rate, annualised1 (%)
17.8 18.3
5.4 5.6 5.5 13.1
13.1 12.0 12.2
1H21 2H21 1H22 1H21 2H21 1H22
1. Funding cost rate is equal to funding cost divided by average funding debt, annualised.
2. P&D refers to costs associated with Product and Development, GTM refers to costs associated with Sales & Marketing and G&A refers to costs associated with General & Admin. FY21 cost normalised for Jobkeeper subsidy benefit. 12Successful risk mitigation with credit provision reducing to 6.5%
Stable static loss rate1 Provision for expected credit losses
10.4%
4.9%
4.4%
3.8% 5.7%
3.5% 3.2% 7.9%
6.5%
1.8% 6.4%
4.7% 5.4%
1.5% 1.1%
0.1%
1H21 2H21 1H22
1H19 2H19 1H20 2H20 1H21 2H21 1H22
Standard Modelled Provision Economic Overlay
Coincidental delinquency2 (90+ days past due) COVID-19
deferral
8% impact
6%
4%
2%
0%
Jun-17 Dec-17 Jun-18 Dec-18 Jun-19 Dec-19 Jun-20 Dec-20 Jun-21 Dec-21
1. Static loss rate net of recoveries as at 31 December 2021 for the Australian small business loan product. Banded columns reflect cohorts which are still seasoning. FY21 and FY22 cohorts too early to demonstrate material loss data including taking into account the impact of COVID-19 deferrals.
2. Refers to delinquency data across Prospa’s Australian and New Zealand Small Business Loans (i.e. excludes Line of Credit) and references point-in-time information at 6-month intervals. Historical values may change due to refinements in Days Past Due (DPD) calculation methodology. 13Reduction in bad debt and impairment provision offset by book
growth
1H21 Total Impairment 1H22 Total Impairment
Expense ($m) Expense ($m)
46% ($6.8m) of overall impairment
16.9
expense in the half is driven by growth in
(2.4) 15.1 14.7 gross loans
(3.6) As at 31 December 2021, the net bad
10.9 (7.2) 6.8 debt expense represents 6.6% of average
(13.7)
gross loans compared to 9.8% in 1H21
w
The reduction in bad debt expense
relative to gross loans and the release
9.8% 6.6% of provision demonstrates the ongoing
of AGL1 of AGL1 effectiveness of the credit decision
engine and Prospa's risk management
capability
Net bad debt expense2 ECL provision (book growth)
ECL provision (% change) Total impairment expense
1. AGL is Average Gross Loans. Percentage represents the Net Bad Debt Expense as % of AGL, annualised.
2. Bad Debt Expense offset by Loss Recoveries received in the period and movements due to exchange rate variances
14Strong balance sheet and enhanced funding platform positions for
growth
1H22 Drawn and undrawn third-party Cash and Cash Equivalents
facilities1 In September, Prospa issued its inaugural $200m
A$580.7m $110.9m $110.5m Term Asset-Backed Securitisation, the first of its
27
$105.1m kind in Australia, with a funding cost rate of
A$475.6m 135 2.34% p.a. and a 12 month revolving period
$48.1m
$63.9m Closed two funding facilities that were legacy
139 and less efficient and replaced them with a new
facility in NZ
+33% $580.7m in total third party facilities
190
$62.4m as at 31 December 2021 (1H21: $420.3m)
$47.0m
31 As at 31 December 2021, Prospa holds $110.5m
59 in cash (unrestricted cash: $62.4m; restricted
Drawn Undrawn Available third- 1H21 1H22 cash: $48.1m) a 33% increase in unrestricted
party facilities
cash
Propela Trust (AU Warehouse) Kea Trust 2021-1 (NZ) Restricted Cash Unrestricted Cash
PROSPArity Trust (Warehouse Facility) Kea Trust 2021-2 (NZ) Prospa has no corporate debt
Pioneer Trust (Warehouse Facility)
PROSPArous 2021-1 (Rated ABS Term)
1. Available third-party facilities at end of corresponding period. New Zealand trust facility converted to AUD at end of corresponding period.
15SECTION 3
Strategy
and outlook
3
16Scale existing products
Drivers for
growth Expand through new solutions
Reach new segments
17Scaling our existing products to service
a broader range of small businesses
Small Business Loans
NEW
Small Business Prospa Plus
Loans Business Loans
Line of Credit
2H22
Australia New Zealand
18Introduce new products:
Prospa’s All-in-One Business Account
Illustrative only
Next
Now
Credit products
Transaction account Invoicing
Visa business debit card Bill pay
Live trial Expense Management
Marketing and channel
Digital customer onboarding engagement activity
19Personalised products to deliver growth
and expansion within the SME market
Illustrative only
20Cohesive product strategy driving
greater reach and revenue
More opportunities target new segments, cross-sell, drive down
costs to service, diversify revenue and invest in further growth. Value of credit required by
Australian SMEs in next 12
months1
Financial
Credit
Management
Software
Payments
21SECTION 4
Capital
management
4
22Origination and revenue growth converting
to positive operating cash flows
Cash and Cash Equivalents ($m) Total originations ($m)
Share
$110.9 $110.5 Price ($)
Record quarterly
48.1 originations of
63.9
100 $186.6 million 5.0
in 2Q22
62.4 33%
47.0 80 4.0
1H21 1H22
60 3.0
Restricted Cash Unrestricted Cash
Operating cash flow ($m)
40 2.0
25.4
95%
20 1.0
13.0
0 0.0
1H22 Origination Closing Price
1H21
Source: IRESS as of close 31 December 2021
23Capital management: share buy-back to commence in 2H22
Buy-back rationale
Group financial position ($m) 1H22 FY21 Var %
The Board has approved a share buy-back Cash and cash equivalents 110.5 80.4 37%
programme of up to 10% of the Group’s issued Other asset 521.9 424.1 23%
share capital to commence in 2H22. The buy-
back is expected to remain in place for a period Total assets 632.4 504.5 25%
of up to 12 months.
Current liabilities 15.2 13.4 13%
The buyback aims to enhance shareholder
Non-current liabilities 483.2 366.6 32%
returns and capital efficiency, whilst retaining
balance sheet flexibility to pursue future Total liabilities 498.4 380.0 31%
growth and investment opportunities.
It has been sized to reflect the strong and Net Assets 134.0 124.5 8%
growing business performance and high
balance of unrestricted cash.
24Q&A
Q&A
25SECTION 5
Additional
Information
5
26Passionate founders with highly valuable expertise
Greg Moshal Beau Bertoli
Chief Executive Officer Chief Revenue Officer
& Executive Director & Executive Director
• Co-Founder of Prospa, Executive Director of the Company since • Co-Founder of Prospa, Executive Director of the Company since
April 2018, and Executive Director of Prospa Advance Pty Ltd April 2018, and Executive Director of Prospa Advance Pty Ltd
since 2011 since 2013
• Awarded Fintech Leader of the Year in 2017 and NSW Pearcey • Founded technology start-up and managed a consumer product
Tech Entrepreneur of the Year franchise
• Prior to co-founding Prospa, Greg was involved in the • Prior to co-founding Prospa, Beau held senior positions,
establishment and scaling of a consumer service chain and including National Sales Manager at listed financial services
international consumer product franchise company Humm Group
27Supported by experienced leadership team
Shai Haim Ross Aucutt Ben Lamb Elise Ward Andrew Malak
Chief Technology Chief Financial Officer Chief Commercial Chief People Chief Product Officer
Officer Officer Officer
• Shai has over • Ross has over • Ben has over 15 years’ • Elise has more than • Andrew has more than
20 years’ experience 20 years’ experience in experience in financial 15 years’ experience in 20 years’ of Product and
developing digital senior finance roles, and services, spanning delivering progressive Digital experience, and
solutions to improve was previously CFO at multiple roles across ASX people and culture has delivered large scale
customer experience, Humm Group Limited listed organisations. strategies across start- customer-centric and
while leading and (ASX:HUM). ups, multinational and design-led
scaling engineering • Ben is responsible for the ASX listed organisations. transformations within
• Ross has a strong
teams across five customer journey, the Australian Banking &
background in
different continents. balancing exceptional • Elise is responsible for Financial Services sector.
non-bank disruptive
customer experiences the design and delivery
finance models and the
• Prior to Prospa, Shai with the right commercial of our people strategy.
financial markets.
was CTO at Campaign outcomes. In addition,
Monitor. Ben is responsible for our
Digital acquisition & our
New Zealand business.
28Board with technology and financial services expertise
Gail Pemberton Fiona Trafford-Walker Avi Eyal Mary Ploughman
Independent Independent Non-Executive Independent
Non-Executive Chairman Non-Executive Director Director Non-Executive Director
• Avi has approximately • Mary has 30 years of
• Gail has more than • Fiona has more than 25 years’ experience in
35 years’ experience 25 years’ experience advising financial services, capital
founding, scaling and markets, securitisation,
in banking and wealth institutional running global technology
management and is a asset owners and investors mergers and acquisitions,
and finance companies governance and risk
specialist in technology and on investment and
operations governance-related issues • Co-founder and Managing management experience
Partner of Entrée Capital, • Mary is the current
• Gail has held former roles as • Fiona was the former which has AUM of over
COO at BNP Paribas, Group investment director at Chairman of Plenti Group
US$1.4bn. Avi has co- Limited
CIO and Financial service COO Frontier Advisors founded eight startups over
at Macquarie bank the past twenty years
• Avi is on the Board of
Monday.com (Nasdaq)
29Half Year Profit and Loss
6 months to 31 December 2021 ($m) 1H22 1H21
Interest income 72.0 52.7
Other income 6.5 3.0
Total income 78.5 55.7
Transaction costs 5.2 3.6
Funding costs 11.2 8.1
Gross profit 62.1 44.0
Loan impairment expense 14.7 10.9
Employee expenses 21.1 16.5
Operating expenses 16.6 12.5
Total expenses 52.4 39.9
EBITDA 9.6 4.1
Depreciation 1.3 1.4
Amortisation 2.0 1.5
Interest on lease liabilities 0.2 0.2
Share based payments 1.2 3.2
PBT 4.9 2.2
Tax expense (0.5) (1.0)
NPAT 5.4 (3.2)
1. Totals may not add up precisely due to rounding. 30Statutory Balance Sheet
Statutory Balance Sheet ($m) Dec-21 Jun-21
Cash and cash equivalents 110.5 80.4
Loan receivables 481.2 393.4
Bank deposits 1.1 1.1
Other financial assets 1.9 0.0
Prepayments and other assets 3.1 2.5
Property, plant and equipment 0.4 0.7
Right-of-use asset 9.0 5.0
Intangible assets 12.3 7.2
Deferred tax assets 14.2 14.3
Total assets 633.6 504.5
Trade and other payables 8.9 7.8
Lease liabilities 10.6 6.7
Borrowings 473.6 359.9
Income Tax 0.1 0.0
Employee benefits 6.3 5.6
Total liabilities 499.6 380.0
Net assets 134.0 124.5
Issued Capital 612.2 610.9
Reserves (419.7) (422.5)
Accumulated losses (58.5) (63.9)
Total equity 134.0 124.5
31Statutory Cash Flows
6 months to 31 Dec 2021 ($m) 1H22 1H21
Financial income received 73.2 48.4
Other income received 6.1 3.3
Interest and other finance costs paid (12.0) (8.7)
Payments to suppliers and employees (42.0) (33.3)
Income taxes paid - 0.4
JobKeeper payments received - 2.9
Operating cash flow 25.4 13.0
Net increase in loans to customers (102.6) 19.4
Capital expenditure (PP&E) - -
Capital expenditure (intangibles) (7.1) (1.9)
Other investing - -
Investing cash flow (109.7) 17.5
Proceeds from borrowings 250.0 69.4
Repayment of borrowings (135.7) (98.5)
Repayment of finance leases (1.1) (1.0)
Payments for share repurchase - 0.0
Proceeds from exercise of options 1.3 0.0
Proceeds from sale of loan shares - -
Financing cash flow 114.6 (30.0)
Net cash flow 30.1 0.5
1. Totals may not add up precisely due to rounding. 321H22 Key Metrics
6 months to 31 Dec 2021 ($m) 1H22 1H21
Loan book
Originations 315.1 180.1
Gross Originations1 423.3 230.1
Gross loans (period end) 514.6 341.7
Average gross loans 454.5 342.8
Realised Portfolio Yield 34.3% 32.5%
Premium Risk Grades 45.0% 44.9%
NIMAL as a % of Revenue (%) 61.3% 59.4%
Funding
Funding cost rate 5.5% 5.4%
Average funding debt 404.0 299.4
Productivity metrics
CAPEX as a % of revenue 9.1% 3.4%
Employee and operating expenses as a % of revenue2 48.0% 56.8%
Customer metrics
Active Customers3 13,200 11,300
Net Promoter Score4 80+ 77+
Composition of loan impairment
Impairment Expense: Net bad debt expense 15.1 16.9
Impairment Expense: Provision movement (0.3) (5.9)
Provision rate 6.5% 10.4%
Net Bad Debt Expense as a % of Average Gross Loans 6.6% 9.8%
1. Originations including carryover from refinances.
2. OPEX excludes JobKeeper payments.
3. Active customers for 1H21 as at 31 December 2020; and for 1H22 as at 31 December 2021. 33
4. Net Promoter Score for 1H21 is the average for the period 1 July 2021 to 31 December 2021; and for 1H22 is the average for the period 1 July 2021 to December 2021.Important Notice and Disclaimer
The material in this presentation has been prepared by Prospa Group Limited (PGL) and is general background information about Prospa's (PGL and its
subsidiaries) activities and is current at the date of the presentation, 16 February 2022.
This presentation may contain statements that are, or may be deemed to be, forward looking statements. Such statements can generally be identified by
the use of words such as “believe”, “estimate”, “plan”, “target”, “project”, “anticipate”, “expect”, “intend”, “likely”, “may”, “will”, “could” or “should” and
similar expressions. Indications of strategy, plans, objectives, targets, goals, future events or intentions are also forward looking statements.
You should not place undue reliance on such forward-looking statements. Such forward looking statements are not guarantees of future performance
and involve known and unknown risks, uncertainties and other factors, many of which are beyond the control of PGL or any of its related entities which
may cause actual results to differ materially from those expressed or implied in such statements.
No representation or warranty, express or implied, is made as to the accuracy, reliability, adequacy or completeness of the information contained in this
presentation.
Past performance information in this presentation is given for illustrative purposes only and should not be relied upon as (and is not)
an indication of future performance.
The information in the presentation is given for informational purposes only, is in summary form and does not purport to be complete.
It is intended to be read by a professional analyst audience in conjunction with PGL’s other announcements to ASX. It is not intended to be relied upon as
advice to current shareholders, investors or potential investors and does not take into account the investment objectives, financial situation or needs of
any particular shareholder or investor. No representation is made as to the accuracy, completeness or reliability of the presentation.
The views expressed in this presentation may contain information that has been derived from publicly available sources that have not been
independently verified. No representation or warranty, express or implied, is made as to the accuracy, reliability, adequacy or completeness of the
information. Market share information is based on management estimates except where explicitly identified.
To the maximum extent permitted by law, PGL and any person involved in the preparation of this presentation disclaim all liability and responsibility
(including without limitation, any liability arising from fault or negligence) for any direct or indirect loss or damage which may arise or be suffered
through use or reliance on anything contained in, or omitted from, this presentation.
PGL is not obliged to, and does not represent that it will, update the presentation for future developments. All currency figures are in Australian dollars
unless otherwise stated. Totals may not add up precisely due to rounding.
34Thank you
You can also read