UTILITY RATE REPORT UTILITIES
←
→
Page content transcription
If your browser does not render page correctly, please read the page content below
L O T T E SV
CH A R

                    I LL
                   62-  E
-VI R

     G I NIA - 1
                  7

City of Charlottesville
Utility Rate
Report
Adopted - FY 2022
Prepared by the Department of             Utilities
Finance and the Department of Utilities
                                          City of Charlottesville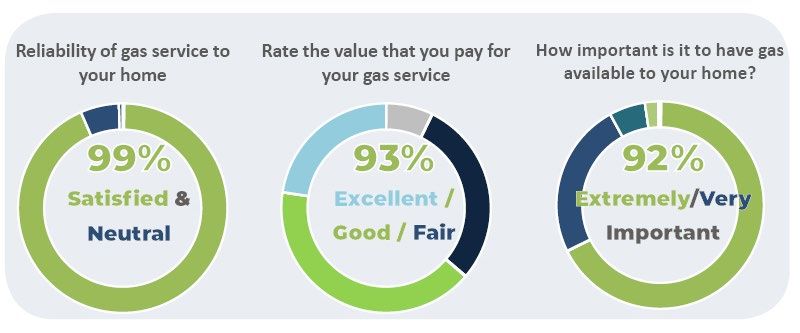
Adopted FY’22 Utility Rate Report

1. EXECUTIVE SUMMARY.................................................................................................................................... 5
   1.1 WATER AND SEWER ............................................................................................................................................ 6
      1.1.1 Adopted FY’22 Water and Sewer Rates ....................................................................................................... 6
           Exhibit 1: Adopted Water and Sewer Rates FY’22 ............................................................................................ 6
   1.2 NATURAL GAS ...................................................................................................................................................... 6
        Exhibit 2: Adopted Gas Rates for FY’22 ............................................................................................................ 7
   1.3 STORMWATER ..................................................................................................................................................... 8
         Exhibit 3: Adopted Stormwater Utility Fee Rate FY’22 ..................................................................................... 8
   1.4 IMPACT ON CUSTOMER....................................................................................................................................... 8
         Exhibit 4: Impact of Adopted FY’22 Rates and Charges on an Average Customer ........................................... 8
2. WATER ........................................................................................................................................................... 9
   2.1 OVERVIEW ........................................................................................................................................................... 9
      2.1. Customer Satisfaction Survey ........................................................................................................................ 9
   2.2 WATER QUALITY AND SAFETY ........................................................................................................................... 10
      2.2.1 Water Treatment ....................................................................................................................................... 10
   2.3 WATER QUALITY TESTING ................................................................................................................................. 11
   2.4 BACKFLOW/CROSS CONTAMINATION PROTECTION ......................................................................................... 11
   2.5 WATER CONSERVATION .................................................................................................................................... 12
        Exhibit 5: Water Conservation Activities ........................................................................................................ 13
   2.6 TOILET AND RAIN BARREL REBATE PROGRAMS ................................................................................................ 15
        Exhibit 6: Participation in Toilet Rebate Program since 2007 ........................................................................ 15
   2.7 WATER ASSISTANCE PROGRAM ........................................................................................................................ 16
   2.8 WATER INFRASTRUCTURE ASSET MANAGEMENT............................................................................................. 16
      2.8.1 Water Distribution System......................................................................................................................... 16
       2.8.2 Lambeth Field Pump Station ...................................................................................................................... 19
       2.8.3 Water Loss Management ........................................................................................................................... 20
           Exhibit 7: City Five-Year Capital Improvement Plan for Water....................................................................... 21
   2.9 RIVANNA WATER AND SEWER AUTHORITY....................................................................................................... 22
      2.9.1 Infrastructure ............................................................................................................................................. 22
           Exhibit 8: RWSA Water Infrastructure Projects to Serve City ....................................................................... ..23
       2.9.2 Actual Water Flows ....................................................................................................................................24
           Exhibit 9: RWSA Water Usage Allocation ..................................................................................................... ..24
       2.9.3 City Share of RWSA Water Costs................................................................................................................ 24
   2.10 REVENUE REQUIREMENTS .............................................................................................................................. 24
      2.10.1 Current Revenue Requirements (FY’22) .................................................................................................. 24
           Exhibit 10: Water Utility FY’22 Revenue Requirements ................................................................................. 25
           Exhibit 11: Comparison of Water Revenue Requirements FY’21 to FY’22 ..................................................... 25
       2.10.2 Projected Water Revenue Requirements (FY’22 – FY’27)........................................................................ 26
           Exhibit 12: Projected Water Revenue Requirements FY’22-FY’27 ................................................................. 26

                                                                                    1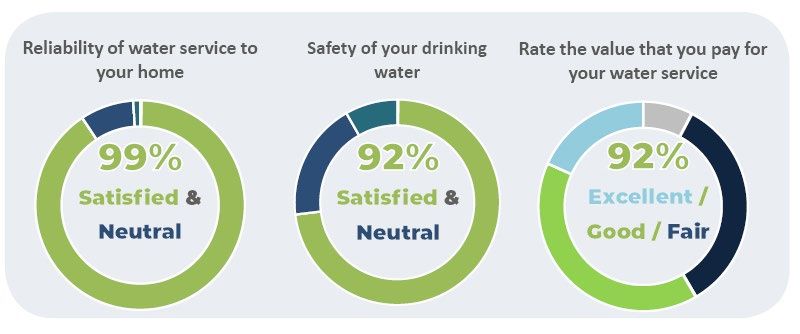
Adopted FY’22 Utility Rate Report

   2.11 CUSTOMERS AND USAGE ................................................................................................................................ 27
        Exhibit 13: Current Water Customers by Meter Size...................................................................................... 27
           Exhibit 14: Projected FY’22 Water Usage ....................................................................................................... 27
   2.12 MONTHLY SERVICE CHARGE ............................................................................................................................ 27
        Exhibit 15: Adopted Monthly Service Charge for FY’22 for Water ................................................................. 28
   2.13 ADOPTED WATER RATES ................................................................................................................................. 28
      2.13.1 Total Revenue Projections at Current Rates ............................................................................................ 28
           Exhibit 16: Water Revenue Requirements and Revenue at Current Rates .................................................... 28
       2.13.2 Total Revenue Projections at Current and Adopted Rates ...................................................................... 29
           Exhibit 17: Water Revenue Requirements, Revenue at Current Rates and Revenue at Adopted Rates........29
       2.13.3 Water Rate Design ................................................................................................................................... 29
       2.13.4 Adopted Water Rates FY’22 ..................................................................................................................... 29
           Exhibit 18: Adopted Water Rates FY’22.......................................................................................................... 29
       2.13.5 Projected Water Rates FY’22-FY’27 ......................................................................................................... 30
           Exhibit 19: Projected Water Rates FY’22-FY’27 .............................................................................................. 30
   2.14 CUSTOMER IMPACTS ....................................................................................................................................... 30
        Exhibit 20: FY’22 Customer Impacts from Adopted Water Rates and Charges .............................................. 30
3. SEWER .......................................................................................................................................................... 31
   3.1 OVERVIEW ......................................................................................................................................................... 31
      3.1.1 2021 Customer Satisfaction Survey ........................................................................................................... 31
   3.2 FATS, OILS, AND GREASE (FOG) ......................................................................................................................... 32
   3.3 WASTEWATER ASSISTANCE PROGRAM ............................................................................................................. 32
   3.4 WASTEWATER INFRASTRUCTURE ASSET MANAGEMENT ................................................................................. 32
      3.4.1 Sanitary Sewer Rehabilitation .................................................................................................................... 33
           Exhibit 21: Basins 7, 8, and 9 Flow Monitoring Results .................................................................................. 34
           Exhibit 22: City Five-Year Capital Improvement Plan for Wastewater ........................................................... 34
   3.5 RIVANNA WATER AND SEWER AUTHORITY....................................................................................................... 35
      3.5.1 Infrastructure ............................................................................................................................................. 35
           Exhibit 23: RWSA Sewer Projects for the City ................................................................................................ 36
       3.5.2 Actual Wastewater Flows .......................................................................................................................... 36
           Exhibit 24: RWSA Sewer Production Allocation.............................................................................................. 36
       3.5.3 City Share of RWSA Wastewater Costs ...................................................................................................... 37
   3.6 REVENUE REQUIREMENTS ................................................................................................................................ 37
      3.6.1 Current Revenue Requirements (FY’22) .................................................................................................... 37
           Exhibit 25: Sewer Utility FY’22 Revenue Requirements ................................................................................. 37
           Exhibit 26: Comparison of Sewer Revenue Requirements FY’21 to FY’22 ..................................................... 38
       3.6.2 Projected Revenue Requirements (FY’22-FY’27) ....................................................................................... 38
           Exhibit 27: Projected Sewer Revenue Requirements FY’22-FY’27 ................................................................. 38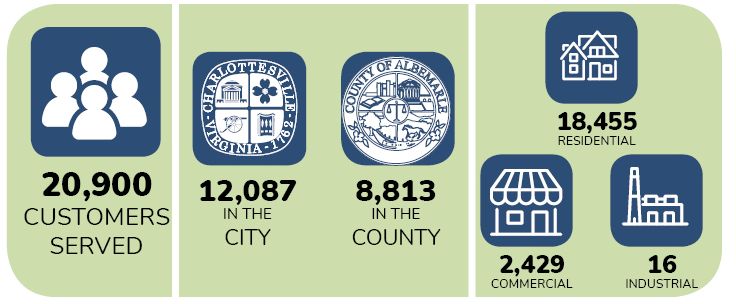
Adopted FY’22 Utility Rate Report

   3.7 CUSTOMERS AND USAGE .................................................................................................................................. 38
        Exhibit 28: Current Sewer Customers by Meter Size ...................................................................................... 39
           Exhibit 29: Projected FY’22 Sewage Production ............................................................................................. 39
   3.8 MONTHLY SERVICE CHARGE .............................................................................................................................. 39
        Exhibit 30: Adopted Monthly Service Charge for FY’22 for Sewer ................................................................. 40
   3.9 ADOPTED SEWER RATES .................................................................................................................................... 40
      3.9.1 Total Revenue Projections at Current Rates .............................................................................................. 40
           Exhibit 31: Sewer Revenue Requirements and Revenue at Current Rates .................................................... 40
       3.9.2 Total Revenue Projections at Current and Adopted Rates ........................................................................ 41
           Exhibit 32: Sewer Revenue Requirements, Revenue at Current Rates and Revenue at Adopted Rates ........41
   Sewer Rate Design ................................................................................................................................................... 41
     3.9.3 Sewer Rate Design ..................................................................................................................................... 41
       3.9.4 Adopted Sewer Rates FY’22 ....................................................................................................................... 41
           Exhibit 33: Adopted Sewer Rates FY’22 .......................................................................................................... 41
       3.9.5 Projected Sewer Rates FY’22-FY’27 ........................................................................................................... 42
           Exhibit 34: Projected Sewer Rates FY’22 – FY’27............................................................................................ 42
   3.10 CUSTOMER IMPACTS ....................................................................................................................................... 42
        Exhibit 35: Customer Impacts from Adopted FY’22 Sewer Rates and Charges .............................................. 42
4. NATURAL GAS ............................................................................................................................................... 43
   4.1 OVERVIEW ......................................................................................................................................................... 43
      4.1.1 Our Customers ........................................................................................................................................... 43
       4.1.2 2021 Customer Satisfaction Survey ........................................................................................................... 44
   4.2 SAFETY ............................................................................................................................................................... 44
   4.3 REGULATORY COMPLIANCE .............................................................................................................................. 46
   4.4 GHG REDUCTION STRATEGY .............................................................................................................................. 47
      4.4.1 Energy-Efficiency Programs ....................................................................................................................... 47
       4.4.2 Rebates ...................................................................................................................................................... 47
       4.4.3 No-Cost Home Weatherization for Income-Qualified Households ............................................................ 48
       4.4.4 Energy Efficiency Outreach Actions ........................................................................................................... 48
       4.4.5 Carbon Offset Program .............................................................................................................................. 49
   4.5 GAS ASSISTANCE PROGRAM.............................................................................................................................. 49
   4.6 GAS INFRASTRUCTURE ASSET MANAGEMENT .................................................................................................. 49
   4.7 FY’22 REVENUE REQUIREMENTS ....................................................................................................................... 50
      4.7.1 Current Revenue Requirements (FY’22) .................................................................................................... 50
           Exhibit 36: Gas Utility FY’22 Revenue Requirements ..................................................................................... 50
           Exhibit 37: Comparison of Gas Revenue Requirements FY’21 to FY’22 ......................................................... 51
   4.8 MONTHLY SERVICE CHARGE .............................................................................................................................. 51
   4.9 ADOPTED GAS RATES ........................................................................................................................................ 52
        Exhibit 38: Gas Rate Calculation FY’22 ........................................................................................................... 52

                                                                                      3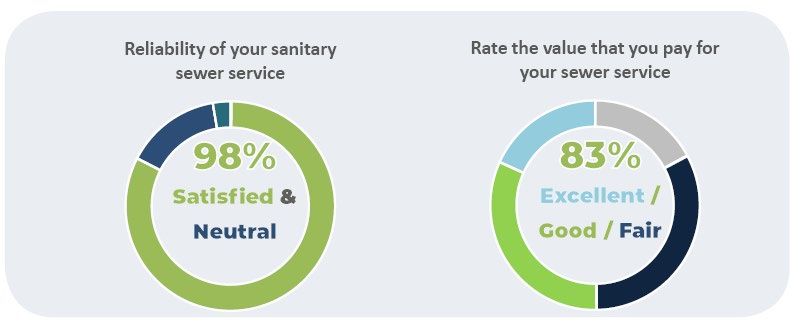
Adopted FY’22 Utility Rate Report

           Exhibit 39: Adopted FY’22 Gas Rates .............................................................................................................. 53
   4.10 IMPACTS ON CUSTOMERS ............................................................................................................................... 53
         Exhibit 40: Customer Impacts from Adopted FY’22 Gas Rates and Charges .................................................. 53
5. STORMWATER .............................................................................................................................................. 54
   5.1 OVERVIEW ......................................................................................................................................................... 54
   5.2 REGULATORY COMPLIANCE .............................................................................................................................. 54
   5.3 CREDIT PROGRAM AND CHARLOTTESVILLE CONSERVATION ASSISTANCE PROGRAM...................................... 54
   5.4 FINANCIAL RELIEF PROGRAM ............................................................................................................................ 54
   5.5 STORMWATER INFRASTRUCTURE ASSET MANAGEMENT ................................................................................. 55
         Exhibit 41: Five-Year Capital Improvement Plan for Stormwater................................................................... 56
   5.6 REVENUE REQUIREMENTS ................................................................................................................................ 57
        Exhibit 42: Comparison of Stormwater Budgets FY’20 to FY’22 ..................................................................... 57
   5.7 ADOPTED STORMWATER UTILITY FEE FOR FY’22 .............................................................................................. 57
        Exhibit 43: Adopted Stormwater Utility Fee Rate FY’22 ................................................................................. 57
6. GLOSSARY ..................................................................................................................................................... 58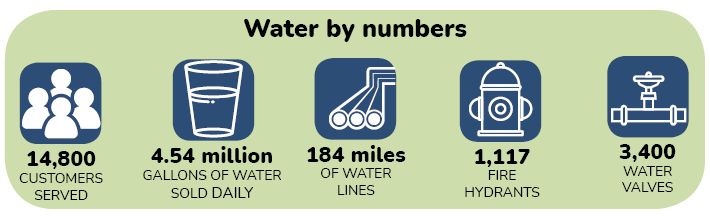
Adopted FY’22 Utility Rate Report
1. EXECUTIVE SUMMARY
The purpose statement for the City of Charlottesville Department of Utilities (Utilities) is:
To provide the Charlottesville community with safe and reliable natural gas, drinking water, and
wastewater services at a reasonable cost in an environmentally responsible manner.
Utilities operates and maintains the water, wastewater, and natural gas systems. In addition, Utilities
also manages the Capital Improvement Program for the stormwater conveyance system. The goal of
Utilities is to provide authorized service in a safe, reliable, responsive, and cost-effective manner.
Utilities supports the following goals of the City’s Strategic Plan:
3.2 Provide reliable and high-quality infrastructure
3.4 Be responsible stewards of natural resources
5.1 Integrate effective business practices and strong fiscal policies
The Gas, Water, Wastewater, and Stormwater budgets are funded by utility rates and charges and
include funding for administration, operations, and maintenance of the four systems as well as funding
for infrastructure improvements, technology advances, and debt service payments.
The billing and collection functions of the City’s utilities are completed by the Finance Department’s
Utility Billing Office with the exception of stormwater utility billing which is performed by the
Treasurer’s Office. The utility budgets are separate from the General Fund and are not supported by
taxes. These budgets and the respective rates and charges are considered and adopted by the City
Council in June of each year.
In January 2021, the City received CARES funds totaling $182,801.59 from the Commonwealth to assist
municipal utility customers. Through the efforts of the Utility Billing Office and Utilities, a total of
$181,232.58 has been distributed to 467 accounts, at an average of $388.08 per customer. The
remaining balance of $1,569.01 (less than 1% of the total award) was used for direct, administrative
costs to the City associated with implementing the program; well below the 5% threshold allowed by the
Commonwealth. The funds were allocated to residential accounts (86%) and commercial accounts
(14%).
The Department of Utilities has implemented an aggressive Capital Improvement Program (CIP) to
address aging infrastructure. Prior to 2008, very little replacement or rehabilitation had been
completed to address the issues relating to the utility systems, with the exception of the natural gas
utility. As the City continued to grow in population and development continued to increase, it was
recognized that not only did the utility infrastructure need increased capacity, but the systems also
needed to be improved to ensure that public health would not be compromised and to alleviate
property damage.
Although the four (4) utility systems have vastly different components and functionalities, they are all
treated similarly in the respect that the Department of Utilities acts aggressively through the CIP to
continue to improve the operability of the utilities. Without this aggressive approach, the systems could
5
Adopted FY’22 Utility Rate Report

easily and quickly fall into disrepair, similar to the situation experienced prior to 2008, which is not in
the best interest of the City of Charlottesville.

This section of the FY’22 Adopted Utility Rate Report provides a summary of the staff recommendations
for each utility. Additional detailed information for each utility is provided in subsequent chapters.

1.1 WATER AND SEWER

1.1.1 Adopted FY’22 Water and Sewer Rates
Based on the projected revenue requirements to operate and maintain each utility, the adopted water
and sewer rates for FY’22 (beginning July 1, 2021) are as follows:

                               Exhibit 1: Adopted Water and Sewer Rates FY’22

                                                        Adopted       $           %
                                             Current
                                                         FY'22      Change      Change
           WATER (per 1,000 CF)
                   Summer                      $65.31      $70.08      $4.77      7.30%
                    Winter                     $50.24      $53.91      $3.67      7.30%

           SEWER (per 1,000 CF)                $80.14      $81.34      $1.20      1.50%

1.2 NATURAL GAS
The revenue requirements to operate and maintain the natural gas system are projected to slightly
increase by an average of 1.0% for firm customers in FY’22. The single largest expenditure for
Charlottesville Gas is the purchase of natural gas from British Petroleum (BP), the City’s wholesale
supplier. The projected price of gas for FY’22 is about the same as the current year. The gas rates for
FY’22 are as follows:
Adopted FY’22 Utility Rate Report

                                    Exhibit 2: Adopted Gas Rates for FY’22

                                                  FY'20       Adopted
                                                                                $ Change % Change
                                             (Adopted 7/1/19)   FY'22
FIRM

           Customer Charge (Minimum)          $            10.00   $    10.00     $0.00      0.0%
           First 3,000 Cu Ft, Per MCF                     9.0706       8.9908    ($0.08)    -0.9%
           Next 3,000 Cu Ft, Per MCF                      8.5264       8.5198    ($0.01)    -0.1%
           Next 144,000 Cu Ft, Per MCF                    7.6193       8.0489     $0.43      5.6%
           Over 150,000 Cu Ft, Per MCF                    7.4379       7.5779     $0.14      1.9%

INTERRUPTIBLE

           Customer Charge (Minimum)          $            60.00   $    60.00     $0.00      0.0%
           First 600 MCF, Per MCF                         7.3874       7.2178    ($0.17)    -2.3%
           Over 600 MCF, Per MCF                          6.5720       6.6937     $0.12      1.9%

             Annual Minimum (MCF)                          1,200        1,200     $0.00     0.0%

AIR CONDITIONING

           All Gas Used, Per dth              $           7.3471   $   7.7489     $0.40     5.5%

GAS LIGHT

           Charge per Month                   $            17.51   $    17.51     $0.00     0.0%

TRANSPORTATION
           Small Volume Customer
           Monthly Service Charge             $           150.00   $   150.00     $0.00      0.0%
           Rate per dth                       $           3.2293   $   2.6462    ($0.58)   -18.1%

                                                      7
Adopted FY’22 Utility Rate Report

1.3 STORMWATER
The Stormwater Utility fee was adopted in March 2013 at a rate of $1.20/500 square feet of impervious
surface per month. The fee has remained flat for the period FY’14-FY’21. No increase is proposed in
FY’22. The Stormwater Utility fee is re-evaluated annually, in conjunction with the budget development
process.
                             Exhibit 3: Adopted Stormwater Utility Fee Rate FY’22

                                         Adopted             $                        %
                                Current
                                             FY'22        Change                    Change
                STORMWATER (per 500 sq. ft. impervious area)
                           $1.20            $1.20          $0.00                    0.00%

1.4 IMPACT ON CUSTOMER
The table below illustrates the impact on a City residential customer using 400 cubic feet (cf) of water
and wastewater, owning a property with approximately 2,440 square feet of impervious surface, and
using 4,600 cf of gas per month. This information is based on utility rates and charges adopted for July
1, 2021.

                Exhibit 4: Impact of Adopted FY’22 Rates and Charges on an Average Customer

                                   Current (based
                                                       Adopted
                                  on rates adopted                         $ Change       % Change
                                                   (Effective 7/1/21)
                                       7/1/19)
          Water1                             $27.61              $29.76          $2.15          7.79%
                1
          Sewer                              $37.06              $38.04          $0.98          2.64%
          Natural Gas1                       $50.85              $50.60         -$0.25         -0.49%
          Stormwater2                         $5.86               $5.86          $0.00          0.00%
          Total                             $121.38             $124.26          $2.88          2.37%

          (1) Rates include monthly service charge.
          (2) The budget impact shown reflects a residential monthly average fee and provides
          consistency with other utilities. Stormwater fees are rounded to the next whole billing unit
          and are billed to property owners biannually.
Adopted FY’22 Utility Rate Report
2. WATER
2.1 OVERVIEW
The City distributes potable water within its municipal boundaries and the University of Virginia. The
City has approximately 14,800 water customers using 1.6 billion gallons of water annually or 4.5 million
gallons daily. The City’s water distribution system has 184 miles of pipes (enough to stretch from
Charlottesville to Virginia Beach) ranging in size from 2” to 18” in diameter. The system also includes
1,117 fire hydrants and 3,400 water valves.
The City’s water distribution system operates off of three (3) different pressure zones- the South
Rivanna Pressure Zone, also known as the Urban Zone, the Lambeth Pressure Zone, and the Alderman
Pressure Zone. These three zones have varying pressures based upon topography, incoming pressure
available, and volume of flows needed in the areas. The hydraulic grade lines (HGL) of the three (3)
zones vary- South Rivanna operates at 652’, Lambeth operates at 750.5’, and Alderman operates at 751’.
2.1.1 Customer Satisfaction Survey
In January 2021, the Department of Utilities conducted an online customer satisfaction survey to gain
feedback about our services. We received over 450 responses reflecting high levels of satisfaction with
the reliability, value, and safety of the services we provide. Among respondents, 99% are satisfied and
neutral about the reliability of water service, with 92% of respondents rating the value of their water
service as excellent. Additionally, 92% of respondents are satisfied and neutral regarding the safety of
their drinking water.
9Adopted FY’22 Utility Rate Report 2.2 WATER QUALITY AND SAFETY Protecting public health is a core function for the Department of Utilities. Since the early 1900’s the City has diligently planned, developed, and operated a complex system that provides affordable, clean, safe, and great-tasting water. The City works closely with the Albemarle County Service Authority (ACSA), the Rivanna Water and Sewer Authority (RWSA), the Virginia Department of Health, and the Virginia Department of Environmental Quality to ensure superior water quality. 2.2.1 Water Treatment The Rivanna Water and Sewer Authority (RWSA) collects, stores, and treats the water. The City then buys the treated water and distributes the water through the distribution system. Although drinking water supplies in the United States are among the safest in the world, RWSA employs various technologies and methods of water treatment to prevent contamination and to remove disease-causing agents. Common steps used in water treatment that can be found within the RWSA’s process include: Coagulation and Flocculation Coagulation and flocculation are often the first steps in water treatment. Chemicals with a positive charge are added to the water. The positive charge of these chemicals neutralizes the negative charge of dirt and other dissolved particles in the water. When this occurs, the particles bind with the chemicals and form larger particles, called floc. Sedimentation During the sedimentation process, floc settles to the bottom of the water supply, due to its weight. This settling process is called sedimentation. Filtration Once the floc has settled to the bottom of the water supply, the clear water on top will pass through filters of varying compositions (sand, gravel, and charcoal) and pore sizes, in order to remove dissolved particles, such as dust, parasites, bacteria, viruses, and chemicals. As smaller, suspended particles are removed, cloudiness diminishes, and clear water emerges. Granular Activated Carbon (GAC) Treatment that removes man-made and naturally occurring contaminants that can impact taste and
Adopted FY’22 Utility Rate Report
odor in the finished water. This treatment also removes organic chemicals or disinfection byproducts
that are regulated by the Environmental Protection Agency.
Disinfection
As protection against any bacteria, viruses, and other microbes that might remain, disinfectant is added
before the water is released into the distribution system and into your home or business.
RWSA carefully monitors the amount of disinfectant added to maintain quality water at the farthest
reaches of the system.
2.3 WATER QUALITY TESTING
The City takes water quality testing very seriously. Much has been discussed about lead in the United
States, and since the 1970’s, Charlottesville has taken a proactive stance by testing at risk homes, using
corrosion inhibitors added to the water to coat the pipes, and having only lead-free pipes installed to
carry drinking water. In 2018, the RWSA collected and tested hundreds of hourly, daily, weekly,
monthly, quarterly, and annual samples to ensure the quality of our water. Sample sources included the
rivers and reservoir from which the water treatment plants draw water, the water treatment plants
themselves, and numerous locations in the City’s distribution system. Contaminants that the City
routinely tests for include:
Turbidity
Total Coliform and E. Coli Bacteria
Combined Radium and Alpha and Beta Particles
Barium
Fluoride
Lead
Copper
Nitrate
Trihalomethanes and Haloacetic Acids
Perfluoroalkoxy alkane
Chlorine
For more information about the City’s water quality, please visit www.charlottesville.gov/waterquality.
2.4 BACKFLOW/CROSS CONTAMINATION PROTECTION
Cross-contamination presents a serious hazard to our water supply. The situation in which water flows
in a direction that is opposite from the intended flow is called backflow and can potentially put the
drinking water supply in danger by allowing the undesirable reversal of flow, such that non-potable
water moves into the potable water system. The location at which this backflow occurs, where a
customer’s water line and the main supply line are joined, is called a point of cross-connection. As part
of the City’s strategy, certain businesses, such as medical facilities, laboratories, food processing plants,
chemical plants, high-rise buildings, or other facilities where a potential for backflow or cross-
connection hazard may exist, are required to install and maintain cross-connection or backflow
11Adopted FY’22 Utility Rate Report prevention devices. The City’s Department of Utilities currently maintains inspection records for over 900 backflow devices to provide the highest quality water to the City residents. 2.5 WATER CONSERVATION The City of Charlottesville is focused on the management of the water distribution systems to reduce water loss, and partners with City customers to conserve water. Highlights of the Water Conservation Program (WCP) include the distribution of over 11,800 free indoor water conservation kits since 2008, the development and dissemination of guidance on how to find and fix leaks, water smart information, and indoor water conservation information. Additionally, a low-flow toilet rebate program has supported the replacement of over 6,390 high consumption toilets since 2003, and a rain barrel rebate program that has issued 795 rebates since 2009. The WCP continues to conduct an extensive public outreach campaign. This includes educational activities at summer camps, educating the public during Fix a Leak Week, and distributing water- saving information and promotional items at dozens of community events every year, such as Kid*Vention and the Westhaven Community Day. The City’s water conservation message has also been conveyed via the internet (online ads, mobile apps, and social media), mailings, newsletters, print, radio, and television. The WCP partners with community organizations including the Local Energy Alliance Program (LEAP), UVA Sustainability, Rivanna Conservation Alliance, Charlottesville City Schools, ACSA, and RWSA. In addition, the program has continued to be an active participant in the American Water Works Association (AWWA), the Alliance for Water Efficiency (AWE), and the Environmental Protection Agency’s (EPA) WaterSense program. In 2019 and 2020, the City of Charlottesville was recognized for water conservation efforts supporting the WaterSense program, receiving the 2019 and 2020 Sustained Excellence Awards; this is the highest honor given out by the WaterSense program and makes the sixth year in a row the program has received a WaterSense award. In both 2019 and 2020, the City increased its focus on internal performance and efficiency through the City’s Energy and Water Management Program. The WCP supports the water side of these efforts by managing the water usage of facilities managed by the City, educating staff and users of the facilities on how to be more efficient and reduce water usage, and supporting water efficient improvements. Another large focus over the past two years has been on Charlottesville City Schools and how to make their buildings more efficient and encourage the staff and students to implement good saving behaviors. These efforts are in line with Charlottesville’s work towards meeting the climate goals adopted in 2019 of reducing greenhouse gas emissions by 45% by 2030, and becoming carbon neutral by 2050. Learn more about the City’s energy and water performance and program initiatives in the FY2020 report. COVID-19 significantly impacted the City’s in-person water conservation program’s outreach and engagement in FY’20. The program saw a dip in interest in some of the programs and initiatives; however, the program continued to find unique ways to keep the community engaged while in-person events are put on hold.
Adopted FY’22 Utility Rate Report

The exhibit below outlines the City’s current water conservation efforts.

                                           Exhibit 5: Water Conservation Activities

      Program Initiatives                                                        Description

                                 The WCP offered free water conservation kits to all City residents. Kits include a WaterSense labeled
                                 showerhead, WaterSense labeled faucet aerators, and toilet leak detection dye tablets. These
                                 conservation kits were available for pick up at City Hall and at various public outreach events. In FY’19,
                                 518 water conservation kits were given out to the community, and in FY’20, 300 conservation kits were
                                 given out to the community (see note below).

                                  •     During the summer of 2019, the program worked with the Community Attention’s TeensGive
                                        program (Blue Team) to give out 150 water conservation kits by going door-to-door in
                                        neighborhoods with high water usage. This outreach was put on hold in FY’20 due to COVID-19.
     Free Incentives: Water
                                   •    The City partnered with a local nonprofit, LEAP, to distribute fixtures that are included in the
    Conservation Kits, Toilet
                                        conservation kits during their Home Energy Check-Ups.
 Flappers, and Other Resources
                                   •    Water saving fixtures were given out at various community events during the year. In FY’19, an
                                        additional 238 aerators and 69 showerheads were given out to the community at these events.
                                   •    In FY’20, the program started to offer universal toilet flappers and a practical plumbing handbook
                                        to City residents. Toilet flappers were available at City Hall for pick up and the plumbing handbook
                                        was available upon request. These materials will be made available at community events in the
                                        future.
                                   •    These free resources are marketed using billing inserts, social media, and paid advertising.
                                 Note: In FY’20 due COVID-19, City Hall was closed, and customers were not able to pick up conservation
                                 kits and other free resources at City Hall. There was only one event in 2020 where these resources were
                                 made available as all other events were cancelled.
                                 The WCP connects with summer camps, schools, and small groups to teach the importance of conserving
                                 water. Informational pamphlets, resources, and water saving fixtures are provided at all events with tips
                                 on how to save water both inside and outside the home.

                                  •     A new educational activity was developed in 2018 that has kids match WaterWise and WaterUse
                                        issues displayed on cards and discuss why these WaterWise practices are important. This activity
 Water Conservation Education
                                        was used in FY’19 and FY’20 educational events.
                                  •     Educational information provided on the Water Conservation website explains ways to save water
                                        and money for all types of water needs and usage. In FY’19, the water conservation page received
                                        over 7,400 page views and in FY’20, it received over 6,890 page views.
                                 Note: In April 2020, the City changed over to a new website and all Water Conservation webpages were
                                 completely revamped and updated.

                                 An Energy and Water Management Program (EWMP) was recently formalized to provide consistent
                                 tracking of internal municipal utility usage, research and review of facilities’ performance, and
                                 implementation of various programs and initiatives aimed at energy and water management.

                                  •    In FY’20, the City adopted an internal Energy and Water Management Policy.
     Energy and Water
                                  •    In FY’20, the EWMP started to work directly with Charlottesville City Schools to educate staff and
  Management Program and
                                       students on saving energy and water at school (and at home). The program published quarterly
      School Outreach                  educational materials with customized themes, tips, and messages.
                                  •    Fall 2019 – spring 2020, the EWMP issued educational posters that were posted around each
                                       school with that quarter’s outreach message and tips.
                                  •    Summer 2020 – present, the EWMP developed quarterly student activity sheets that could be used
                                       as students pivoted to online learning. Each activity sheet has students learn about the message
                                       and tips provided through a series of activities that can be applied at home and at school.
                                 The WCP participated in numerous community events. Materials are tailored to the audience, and
                                 conservation information and rebate materials are available at these events.
      Water Conservation
                                  •     For FY’19, outreach occurred at 13 events including Kid*Vention, UVA events, Tom Tom Festival,
     Community Outreach                 Grand Illumination, various neighborhood and community focused events, and at City Hall tabling.
                                  •     For FY’20, outreach occurred at 6 events, including Kid*Vention, Grand Illumination, and
                                        Westhaven Community Day. However, all events after February 2020 were cancelled due to
                                        COVID-19.

                                                                   13
Adopted FY’22 Utility Rate Report
• The WCP mentored a high school intern during the summer of 2019 as part of the Community
Attention Youth Internship Program (CAYIP), where the intern provided essential support with
water conservation outreach. No intern was mentored in the summer of 2020 due to COVID-19.
• Starting in FY’20, the WCP engaged UVA students through the University’s Internship Placement
Program, who worked on the City’s EWMP. During COVID-19, these internships continued
remotely.
To celebrate the national Fix a Leak efforts of the EPA WaterSense program, the WCP holds an annual fun
run, the Fix a Leak Family 5K. Billing inserts, paid ads, radio ads, and social media focused on the
importance of finding and fixing leaks in your home were also used to support the campaign.
• Although Fix a Leak Week is typically held during March, in FY’19 the Fix a Leak Family 5K was held
Fix a Leak Campaign in May at Darden Towe Park, as part of a larger event, the Rivanna Riverfest. The larger event,
which had other activities including a large tabling event, river race, and evening music on the
river, was a huge success attracting a large group of participants and larger audience by having the
5K part of the event.
• In FY’20, the Fix a Leak Family 5K was again planned to be part of Rivanna Riverfest in May;
however, due to COVID-19, the event was cancelled. Other planned in-person events in March
during Fix a Leak Week were also cancelled.
The WCP holds an annual art contest, co-sponsored with ACSA and RWSA, as part of the Imagine a Day
without Water campaign.
• In FY’20, the 5th annual Imagine a Day without Water Art Contest asked youth to illustrate how
they “Only Use What You Need.” The contest had over 300 poster entries and the fan favorite
Imagine a Day without Water entry was selected from over 1895 total online votes. The campaign included an event at the Shops
Campaign at Stonefield and an awards ceremony for all award winners and participants.
• In FY’21, the 6th annual Imagine a Day without Water Art Contest was held (even during COVID-19)
asking youth to consider, “What Water Means to Me”. The contest was modified to allow for
easier submissions of art and relaxed rules. The contest had 120 art submissions and had 870
online votes to help select the fan favorite winner. Due to COVID-19, there were no in-person
events, but winners were honored during a Cville360 TV segment and through an official City press
release.
The WCP put out education and outreach in forms of print ads, radio ads, and social media to inform the
community on appropriate lawn watering and water conscious (drought tolerant) landscapes. The
program promoted WaterSense’s “Sprinkler Spruce Up”, “When in Drought”, “Smart Irrigation”, and
other WaterSense outdoor campaigns and resources during the summer months.
Water-Wise Landscaping
• In the summer of 2019, the program used a local TV’s weather page (computer, tablet, app, phone)
during the summer months to bring attention to being water smart outside.
• In the summer of 2020, the program published several utility billing inserts to connect the
community to outdoor water saving tips as well as promoted helpful resources and information on
social media.
• The WCP provided businesses with specific information and resources on how they can save water.
A free “Commercial Kitchen Water Use Efficiency and Best Practices Guides” has very relevant and
Water Efficient Businesses current information on how commercial kitchens can save water and money. This literature is
provided to City businesses upon request.
• The program continues joint efforts with the City and Albemarle County Service Authority for the
Carwash Certification Program. This program has been on hold during COVID-19.
The WCP runs yearly ad campaigns using social media, print, television, radio, and online ads to promote
Year-Round Ad Campaign:
the EPA WaterSense sponsored water conservation campaign: “Check, Twist, Replace”. This messaging
“Check, Twist, Replace” and
encourages the community to find and fix leaks in their home and check out the City’s water conservation
Saving Water Indoors
rebates and incentives.
The Charlottesville Water Conservation Facebook Page utilizes social media to connect and reach the
community using community based social marketing methods by posting regularly each Wednesday for
#WaterTipWednesday (#WTW). This initiative conveys important information, resources, events, and
highlights about the program.
Social Media and
• In FY’19, the Facebook page had 117 posts, received 46 new page likes, reached over 38,000
#WaterTipWednesday
people, and saw over 1,500 engagements.
• In FY’20, the Facebook page had 118 posts, received 44 new page likes, reached over 15,900
people, and saw over 870 engagements.
The program also posts similar messages on the Twitter account, Charlottesville-A Green City Facebook
Page, and Charlottesville-A Green City Instagram Page.Adopted FY’22 Utility Rate Report
2.6 TOILET AND RAIN BARREL REBATE PROGRAMS
In support of water conservation efforts, the City adopted a Toilet Replacement Rebate Program in 2003
and a Rain Barrel Rebate Program in 2009. Currently the Toilet Rebate Program provides a rebate of up
to $100 to any City water customer who purchases and installs an EPA WaterSense toilet to replace
older high flow models. WaterSense labeled toilets use significantly less water and function as well as
standard toilets, resulting in water (and dollar) savings every year. Residential customers may replace
up to three (3) toilets at a given residence built before 1994. Commercial property owners may replace
up to two (2) toilets and receive up to $80 per replacement. Owners of multi-unit apartment complexes
can replace two (2) toilets per unit. A special program targeted at toilet retrofits for large multifamily
properties was started in 2011. Since then, over 17 apartment buildings have received rebates to
replace their high consumption toilets. In FY’19, 21 toilets were replaced with low flow, WaterSense
labeled toilets in an apartment on the historic Downtown Mall. Low flow WaterSense labeled toilet
rebates issued in FY’19 totaled 247 and 177 in FY’20. The total number of toilet rebates issued to date is
6,391, saving the City a cumulative 60 million gallons of water. Rebates are marketed using billing
inserts, social media, and paid advertising. The following chart shows the participation in the toilet
rebate program for the past 14 years.
Exhibit 6: Participation in Toilet Rebate Program since 2007
# of # of Average
Fiscal Year Customers Rebates $ Rebated Rebate/Customer
2020 136 177 $17,696 $130
2019 178 247 $24,092 $135
2018 165 263 $25,023 $152
2017 185 246 $24,153 $131
2016 186 223 $22,218 $119
2015 189 460 $40,555 $215
2014 219 305 $29,544 $135
2013 358 573 $54,113 $151
2012 258 544 $54,186 $210
2011 363 599 $61,865 $170
2010 386 367 $36,401 $94
2009 219 310 $31,086 $142
2008 180 302 $30,372 $169
2007 194 232 $23,845 $123
The Rain Barrel Rebate Program is aimed at encouraging City homeowners to use harvested rainwater
for outside uses like washing a car, watering plants, and irrigating landscapes. The program provides up
to two (2) $30 rebates for rain barrels purchased per service address. The City has provided 795 rebates
since the program started in FY’09 including 35 rebates in FY’19 and 26 rebates in FY’20. The City
promotes rain barrel workshops and opportunities offered by community partners, such as the Thomas
Jefferson Soil and Water Conservation District (TJSWCD). Rebates are marketed using billing inserts,
social media, and paid advertising.
15Adopted FY’22 Utility Rate Report
2.7 WATER ASSISTANCE PROGRAM
The Water Assistance Program (WAP) was started in FY’12 by City Council to assist City water customers
experiencing hardship in making timely or full payments of their water utility bill. The WAP is intended
only for residential customers, whether owners or renters of property. It is not intended for landlords or
commercial property accounts and is administered in a fashion similar to the established Gas Assistance
Program (GAP). The maximum allotment per household per year is $150 or three (3) times the
customer’s average monthly bill, whichever is less.
In FY’19, 76 customers benefited from the WAP receiving a total of $6,222.84. In FY’20, 53 customers
received a total of $5,247.50. The water budget for the next fiscal year includes $10,000 for WAP. The
WAP also has carry-over funds available from previous fiscal years. Comparable assistance has begun in
the wastewater fund through the Wastewater Assistance Program (WWAP).
2.8 WATER INFRASTRUCTURE ASSET MANAGEMENT
The City’s water distribution system contains 184 miles of water main line ranging in size from 2-inch to
18-inch in diameter. About 16.5 miles of that pipe is three (3) inches or less in diameter. The majority
of the 16.5 miles of main are galvanized steel, several decades old, and serve multiple customers. Not
only can the water lines be severely corroded but they can often result in low pressure and significantly
reduce the quality of service to customers. The system also includes 1,117 fire hydrants and 3,400
water valves.
2.8.1 Water Distribution System
In 2010, the Department of Utilities determined that the water distribution system needed major
attention and remediation for deficiencies. These deficiencies included: water main breaks, low water
pressure, poor water quality, insufficient fire flow, and fire hydrant placement not within standards.
After a comprehensive analysis of the system was completed, the development of 45 projects (known as
the Priority List) was created. These projects would replace or rehabilitate existing water mains and
install new water mains to create loops within the system to eliminate the deficiencies.
In order to determine project prioritization, criteria were used and a ranking number system developed
and applied to all projects. The criteria were categorized into the following groups:
1. Physical Consideration criteria assesses the integrity of the pipes which comprise the water
system.
2. System Consideration criteria addresses water quality, pressure, and fire limitations within the
water system.
3. Environmental/Historic Consideration criteria addresses natural conditions which may be
impacted by a construction project.
4. Public Impact criteria assesses the potential disruption to City residents.
5. Planning criteria assesses the potential to incorporate construction projects into areas to be
developed within the City.
6. Area Construction criteria evaluates the potential to incorporate proposed construction projects
into areas to be developed within the City.
7. Cost/Benefit Ratio assesses the cost required to achieve the overall benefit for the
improvement.Adopted FY’22 Utility Rate Report
Each of the criteria was evaluated as to its importance versus the other criteria. A weighting value
was given to each criteria. The weighting values ranged from 10 being the most important to 1
which was least important. The following is a summary of the weighting values and associated
criteria:
Weighted Value Criteria
10 Water Quality Issues, Low Fire Flow
8 Water Main Breaks
7 Water Age
6 Paving, Sewer Main Replacement,
Cost/Benefit Ratio
5 Low Pressure
4 Traffic, Location
2 Wetlands, Natural Landmarks,
Development Area
1 Service Line Repairs
In order to achieve success, the Department created a contract with over 200 individual bid items
representing water system components to address the initial list of projects. Examples of these bid
items include various sizes of pipe, fittings, valves, meters, service lines, fire hydrants, and site
restoration.
In 2011, the Annual Water System Contract was awarded and construction began. Contractors were
required to provide two (2) crews which would work simultaneously on the projects. Contractors were
provided the list of projects, but no specific designs as to the extent of the projects. The annual contract
was awarded with the potential for two (2) single-year renewals. Since this initial contract, there have
been four (4) contracts awarded over 10 years with achievements and lessons learned every year and
from every project.
This Priority List has had several iterations over the past 11 years and the Department has seen 90
completed projects totaling over 92,213 linear feet (LF) (17.47 miles) of water mains replaced. This
equates to 9.5% of the entire water system being replaced under this contract. In order to complete
these projects, the Department has spent $20,218,366 to date with an average of $2,021,837 being
spent in a contract year. It is the intent of the Department to average approximately two (2) miles of
main replacement per year which equates to an average of approximately $200 per linear foot of pipe
installed.
In the current contract year, at $200/ LF, at the expected footage of pipe installed, which is two (2)
miles, the construction budget for this project would be $2,112,000. However, past contracts have
varied between $1,543,576 and $2,817,456 per contract year. This value can change depending on the
size and location of projects, weather, and unknowns that are encountered during construction.
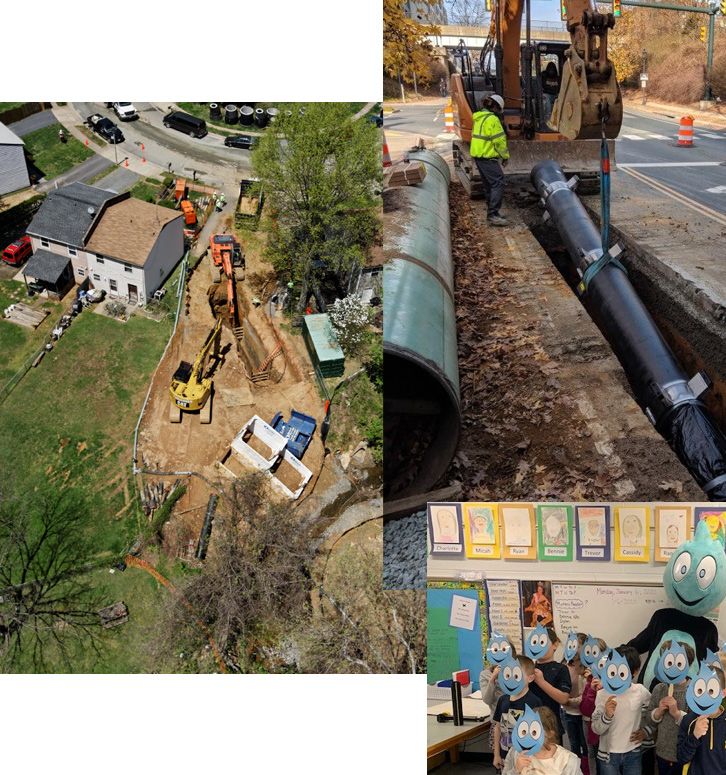
17Adopted FY’22 Utility Rate Report As part of looking at the water system as a whole, there are some projects that need to be bid separately from the Annual Water System Contract. The earliest project that was bid separately was a 12” water main extension in Jefferson Park Avenue. The area from Maywood Lane to Monroe Lane was served by a single 6-inch main and was severely under capacity for the area it served. The contract included 1,500 feet of 12, 8, and 6-inch ductile iron water main installation. The project was completed at a contract price of $427,147. The second standalone project that has been completed was the Emmet Street/ Ivy Road Water Main Replacement. Two (2) 6-inch lines ran in parallel in Emmet Street and Ivy Rd from the intersection of McCormick Road to the City/ County line on Ivy Rd. A contractor procured by Utilities used a combination of two (2) methods to replace the two (2) existing lines – pipe bursting and open trenching. Where feasible, one (1) of the existing 6-inch lines was burst in place and upsized to an 8-inch ductile iron pipe. The pipe bursting technology reduced the impact on traffic around the area during construction. The contractor was also able to take advantage of the UVA winter break and closed a portion of Emmet Street while classes were not in session. This allowed the contractor to leave the work area staged with equipment and material to take full advantage of working hours. Where pipe bursting was not an option, a new 8-inch ductile iron pipe was installed by the open trenching method. Upon completion of the project, one (1) 8-inch line replaced the parallel 6-inch lines from McCormick Rd to St. Anne’s Belfield. The final project construction cost was $2,329,943. Another completed standalone project was the 18” West Main Street Water Main Replacement. The project began construction in October 2019 and was completed in April 2021. The project description was to replace an existing 18-inch water main that is a major feed to the City. The new line was installed in West Main Street from 9th Street SW, turned south on Roosevelt Brown Blvd, and connected to the existing line at Grove Street. The final project construction cost for the project was $1,149,797.28. An additional completed standalone project was the Rugby Road Water Meter Replacement/ Gentry Lane Water Main Installation, Phases 1 and 2. The first phase of the project consisted of installing 1,300- feet of 8-inch water main in Gentry Lane from the intersection of Diary Road and Gentry Lane to the intersection of Greenleaf Drive and Gentry Lane. Before the replacement project, 19 water services along Gentry Lane were served by a dead-end 6-inch line in the road, while 11 water services were served by a dead-end 2-inch line in the backyards of the properties on the north side of Gentry Lane. The new 8-inch line now serves all the properties allowing the existing 6-inch and 2-inch lines to be abandoned, reducing maintenance and removing City infrastructure from private properties. The new line increased capacity while improving fire flow for the area, including the Walker Upper Elementary School/ Charlottesville City Schools Administration Office complex. The total construction costs for phase 1 were $533,174. The second phase, which consisted of 1,300-feet of 8-inch water main from Greenleaf Lane to the northeast intersection of Diary Road and Gentry Lane, was completed in the summer of 2018. The total construction costs for phase 2 were $226,188.
You can also read