The Spatiotemporal Characteristics and Interactions between Urban Expansion and Tidal Flat Dynamics: A Case Study of Three Highly Urbanized ...
←
→
Page content transcription
If your browser does not render page correctly, please read the page content below
Article
The Spatiotemporal Characteristics and Interactions between
Urban Expansion and Tidal Flat Dynamics: A Case Study of
Three Highly Urbanized Coastal Counties in the Southeastern
United States
Chao Xu               and Weibo Liu *

                                          Department of Geosciences, Florida Atlantic University, Boca Raton, FL 33431, USA; cxu2018@fau.edu
                                          * Correspondence: liuw@fau.edu; Tel.: +1-561-297-4965

                                          Abstract: Tidal flats are widely recognized as sentinels of coastal environment change, and are also
                                          the guardians for beachfront communities. As a result of urban expansion, tidal flats have increasingly
                                          received environmental pressures and the surrounding ecosystem has been functionally downgraded.
                                          However, the existing studies could not provide an effective method to identify and quantify the
                                          interactions between urban areas and tidal flats, which is essential work particularly for the coastal
                                          preservations in the United States. Aiming at this environmental crisis, we proposed an approach
                                          which quantifies the change patterns from a spatiotemporal perspective. To justify the rationality
                                          and feasibility of this approach, this study selected three highly urbanized coastal counties in the
                                          southeastern United States as the study area. We analyzed the annual dynamics during 1985~2015,
                                and the generated spatiotemporal regularities were used to identify and quantify the correlations

                                          between urban expansion and tidal flat dynamics. This study not only justified that the coastal
Citation: Xu, C.; Liu, W. The
                                          urban expansion could considerably damage the environment of tidal flats, but also verified an
Spatiotemporal Characteristics and
                                          effective approach to investigate the correlations between urban expansion and tidal flat loss on a
Interactions between Urban
                                          large spatiotemporal scale.
Expansion and Tidal Flat Dynamics:
A Case Study of Three Highly
Urbanized Coastal Counties in the
                                          Keywords: tidal flats; urban expansion; spatiotemporal correlation; coastal environment; land
Southeastern United States. Earth         cover transition
2022, 3, 557–576. https://doi.org/
10.3390/earth3020033

Academic Editors: Charles Jones and       1. Introduction
Ashraf Dewan
                                                The sediment-rich environments along the coast, which are dominated by tidal ranges
Received: 21 February 2022                and other hydrodynamic forces, are also known as tidal flats [1,2]. As the buffer zone
Accepted: 13 April 2022                   between land and sea, tidal flats can largely attenuate the destructive forces from the
Published: 16 April 2022                  ocean, which greatly protects the beachfront communities from hurricanes, tsunamis, and
Publisher’s Note: MDPI stays neutral
                                          flooding [3,4]. Being the natural transitions between ocean and terrestrial ecosystems, tidal
with regard to jurisdictional claims in   flats are also featured by temperature, salinity, acidity, and other physical or chemical
published maps and institutional affil-   conditions [5], and consequently become the homeland of a variety of species, including
iations.                                  but not limited to shorebirds [6], fungus [7], plankton [8], and coastal fish [9]. Regarding
                                          the issue of climate change, tidal flats also play an important role in the prevention of
                                          global warming, because they have strong potential in carbon capture and storage [3].
                                          For coastal residents, tidal flats also have tremendous economic importance because they
Copyright: © 2022 by the authors.         provide favorable environments for fisheries [10] and aquaculture [11]. However, the
Licensee MDPI, Basel, Switzerland.        environments of tidal flats are facing unprecedented challenges due to the intensification
This article is an open access article    of human activities. On a global scale, tidal flats had lost 16.02% from 1984 to 2016 [12],
distributed under the terms and           which is about 20,000 km2 . In the conterminous United States (US), the constant shrinkage
conditions of the Creative Commons
                                          of tidal flats has irreversibly changed the coastal environment [13].
Attribution (CC BY) license (https://
                                                The conflict between human beings and the coastal environment urgently calls for
creativecommons.org/licenses/by/
                                          public awareness, as well as effective collaborations between lawmakers, scientists, and
4.0/).

Earth 2022, 3, 557–576. https://doi.org/10.3390/earth3020033                                                   https://www.mdpi.com/journal/earth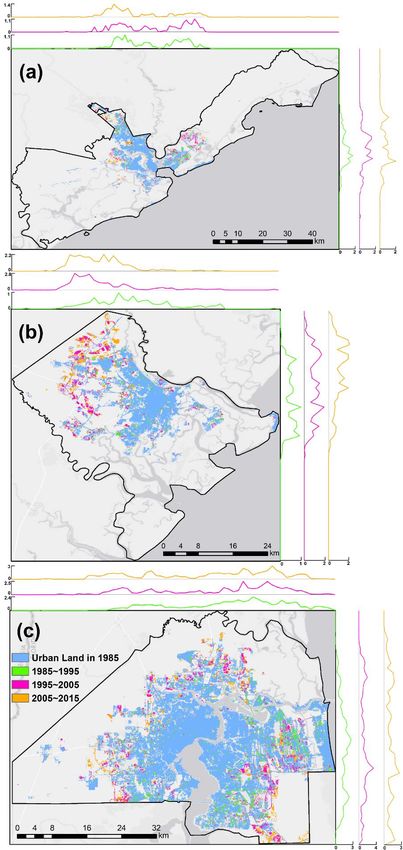
Earth 2022, 3                                                                                                 558

                local authorities. In particular, urban expansion is regarded as one of the major anthro-
                pogenic threats to the environment of tidal flats. According to a recent study [14], a total
                of 14 km2 tidal flats in the Zhoushan Archipelago, China were urbanized during 1986
                to 2017, which contributed 4% of the urban growth during that period. Another study
                of Zhuhai, China [15] observed a more serious environmental crisis around the big city:
                tidal flats decreased by 67.2% during 1991~2018, which is about 19.3 km2 , due to the rapid
                expansion of urban areas. While the two studies have comprehensively examined a variety
                of land sources for urban expansion, they both lack the focus on the spatiotemporal change
                patterns exclusively between new urban areas and tidal flats. Indeed, it is worthwhile to
                further investigate this issue: as the counterforce of the damaged environment, natural
                hazards pose risks to the coastal communities, and the highly populated urban areas are
                especially more vulnerable [16].
                      Meanwhile, some scientists notified the environmental degradation of tidal flats due
                to human activities, and accordingly contributed innovative studies to visualize this crisis
                by utilizing geospatial methods. For example, Li et al. (2020) [17] used Google Earth Engine
                (GEE), a high-performance geospatial cloud computing platform [18], to implement an
                assessment of tidal flat loss in the Yangtze River Delta, China from 1974 to 2018. In addition
                to land reclamation, the study found that the reduced sediment supply could also cause
                large-scale losses of tidal flats. The supply of sediments in this area is heavily driven by
                the hydrodynamic regime [19], which could be greatly modified by navigation projects
                and other artificial constructions [17]. On the other hand, the study of the Yellow River
                Delta, China [20] confirmed that industrial equipment and facilities, such as oil bumps, are
                tremendously destructive to tidal flats in the surrounding areas. The above studies verified
                that human activities could indirectly affect the environments of tidal flats; however, the
                direct interactions between urban areas and tidal flats could barely be observed, since the
                large clusters of tidal flats are far from the major cities in these two regions. Therefore, it is
                necessary to select a better place to conduct the study, where both the direct and indirect
                interactions between urban areas and tidal flats can be clearly observed and analyzed.
                      In addition, a couple of studies should be highlighted, since they both provide sub-
                stantial and insightful discussions regarding the land cover conversions from tidal flats to
                urban areas. The case study in Zhoushan Island, China [21] monitored the urbanization
                process and mechanism during 1995~2011, through which they found significant urban
                encroachment on tidal flats (10.6 km2 ). Accordingly, the study utilized numerous factors
                to evaluate the ecological consequences, including net primary productivity, carbon se-
                questration and oxygen production, nutrient cycling, crop production, and habitat quality.
                On the other hand, the case study of Singapore [22] found that tidal flats had reduced
                from 33 km2 (in 1922) to 8 km2 (in 1993), and further dropped to 5 km2 (in 2011). With
                respect to the reclamation plan as well as the spatial distribution of existing tidal flats,
                the authors projected the degradation of coastal ecosystems in three forms: (1) shrinking
                area, (2) increasing fragmentation, and (3) encroachment by urban expansion. Apparently,
                the core concepts of these two studies are ecological projections and sustainable planning,
                while the spatiotemporal analyses for the interactions between tidal flats and urban area
                are relatively weak.
                      More importantly, the existing studies are limited to the individual cities, which could
                not draw a picture to visualize and analyze the land cover conversions at the nationwide
                level. In addition, these studies mostly focused on Asian cities, which may not be applied
                to the rest of world due to the differences in socioeconomic and natural backgrounds. It is
                worthwhile to implement follow-up studies for the US, since it has the eighth longest coast-
                line in the world [23]. Furthermore, nearly a quarter (24.92%) of the nation’s population
                lives in the 100 most densely populated counties of the conterminous coastal US [24], which
                only contributes 2% of the nation’s total area. The high population density aggravates the
                conflicts between humans and the environment, which poses a critical challenge to the
                sustainable developments in coastal areas.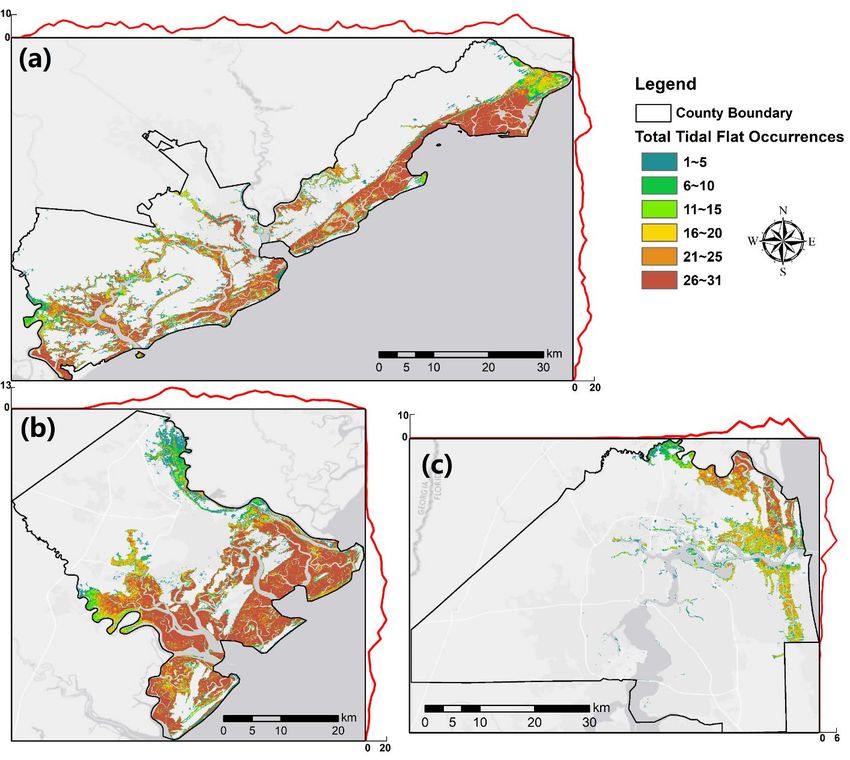
Earth 2022, 3, FOR PEER REVIEW 3
density aggravates the conflicts between humans and the environment, which poses a
Earth 2022, 3 559
critical challenge to the sustainable developments in coastal areas.
Regarding these knowledge gaps, the objectives of this study are to propose and ver-
ify an effective approach, which could identify and quantify: (1) the spatiotemporal
changeRegarding
patterns these knowledge
of urban gaps,
areas and theflats;
tidal objectives
and (2)ofthe
thiscorrelations
study are tobetween
proposethem.
and verify
The
an effective approach, which could identify and quantify: (1) the spatiotemporal
details of implementations are demonstrated in Section 2, and the generated results change
are
patterns ofin
illustrated urban areas
Section 3. and tidalwe
Finally, flats; and (2)
explore theinformation
the correlationsbehind
betweenthethem. The details
identified of
results,
implementations are demonstrated in Section 2, and the generated results
discuss the environmental consequences and possible solutions, and determine the details are illustrated
in Section 3. Finally, we explore the information behind the identified results, discuss the
of future works in Section 4.
environmental consequences and possible solutions, and determine the details of future
works
2. in Section
Materials 4.
and Methods
2.1. Study Area
2. Materials and Methods
2.1. Study
In thisAreastudy, three highly urbanized coastal counties were selected to test the pro-
posedInframework, which
this study, three will urbanized
highly lay a solidcoastal
foundation for were
counties the spatiotemporal assessments
selected to test the proposed
throughout the whole country. As illustrated in Figure 1, the three
framework, which will lay a solid foundation for the spatiotemporal assessments through- selected counties are
in the southeastern US, including Charleston County in South Carolina
out the whole country. As illustrated in Figure 1, the three selected counties are in the (Charleston, SC),
Chatham
southeastern County in Georgia
US, including (Chatham,
Charleston GA), in
County and Duval
South County
Carolina in FloridaSC),
(Charleston, (Duval, FL).
Chatham
According to the official
County in Georgia census
(Chatham, GA),results in 2020
and Duval [24], in
County there were
Florida 350,209
(Duval, FL).residents
According in
Charleston,
to the official SC, 265,128
census residents
results in 2020in [24],
Chatham, GA, and
there were 350,209864,263 residents
residents in Duval, FL,
in Charleston, SC,
which
265,128makes them
residents in the third, fifth,
Chatham, and864,263
GA, and seventhresidents
most populated
in Duval,counties
FL, which of makes
their home
them
states. All fifth,
the third, threeand counties
seventharemost
seated in the major
populated citiesofoftheir
counties this home
regionstates.
(Charleston,
All three Savan-
coun-
nah, andseated
ties are Jacksonville), so the
in the major intensified
cities human(Charleston,
of this region activities would unavoidably
Savannah, affect the
and Jacksonville),
so the intensified
coastal environments. human
Underactivities would unavoidably
such circumstances, affect the
urban wastes [25] coastal environments.
and groundwater ex-
Under such
traction [19] circumstances,
have been confirmedurban wastes [25] andpowers
as destructive groundwater
which mayextraction [19] have
undermine the been
eco-
confirmed
logical as destructive
functionalities powers
of the which may
surrounding undermine
areas. the ecological
Particularly, functionalities
the new urban of the
areas bring in
surrounding areas.
unprecedented Particularly,pressures
environmental the new urban
to theareas
localbring in unprecedented
environment, which needsenvironmental
to be pro-
pressures
foundly to the local
explored andenvironment,
discussed. which needs to be profoundly explored and discussed.
Figure
Figure 1.1.The study
The areaarea
study consists of three
consists coastal
of three counties
coastal in the southeastern
counties US, which
in the southeastern US, arewhich
Charles-
are
ton, SC, Chatham,
Charleston, GA, and Duval,
SC, Chatham, GA, andFL.Duval,
(The World LightWorld
FL. (The Gray Light
Basemap
Grayis used as theisbackground,
Basemap used as the
which is provided
background, whichbyis Esri, HERE,
provided byGarmin, © OpenStreetMap
Esri, HERE, contributors,contributors,
Garmin, © OpenStreetMap and the GIS and
Userthe
Com-
GIS
munity.)
User Community.)
In addition, the three selected counties are located along the coast with unique envi-
ronmental settings: a tidal flat system of more than 3168 km2 from South Carolina to the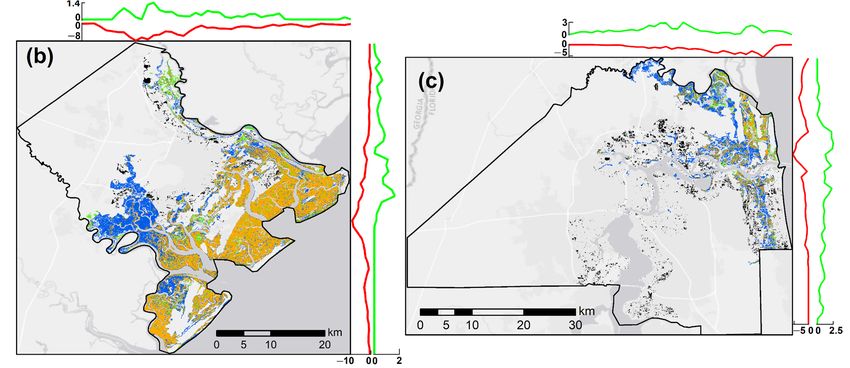
Earth 2022, 3                                                                                               560

                northeastern corner of Florida [26], which is characterized by numerous sounds, estuaries,
                as well as the twice-daily ebb and flow of the tides [27]. According to Peel et al. (2007) [28],
                the entire study area is classified as a humid subtropical climate zone. With the abundant
                precipitation, the interaction between groundwater and tidal flats can be very active, which
                directly impacts the local ecosystem and the daily lives of coastal residents [29]. The unique
                environments make the three counties ideal places to identify and quantify the spatiotem-
                poral change patterns of urban area and tidal flats, as well as the interactive dynamics
                between them.

                2.2. Data
                     One primary dataset used in this study is a 30 m annual map collection of urban extents
                in the conterminous US from 1985 to 2015 [30]. Around 460,000 Landsat images were used
                in that study, which were preprocessed and segmented into four groups according to
                the year of acquisition (1985~1992, 1992~2001, 2001~2011, and 2011~2015). The National
                Land Cover Database (NLCD) [31,32] archives the land cover maps in different periods
                throughout the US, which provides worthwhile references for urban mapping before 2011.
                Additionally, the potential urban clusters after 2011 were delineated according to a set of
                nighttime light images given by the Visible Infrared Imaging Radiometer Suite [33]. For
                each one of the four groups, a temporal segmentation approach [34] was applied to the time
                series dataset of Landsat images, which delineates the pixels with respect to the year of
                urbanization. Acknowledging the limitations of NLCD availability, a hierarchical strategy
                was developed to implement a change vector analysis, which delineates the urbanized areas
                at the cluster level throughout the entire study period. Finally, the proposed framework was
                realized through GEE, and the mapping products obtained a satisfactory overall accuracy
                (around 90%, with the 1-year tolerance strategy) [35].
                     The second primary dataset is a 30 m annual map collection of tidal flat areas in the
                conterminous US from 1984 to 2020 derived from the authors’ previous study [13], and
                the map frames from 1985 to 2015 are used in this study. A random forest classification
                model was proposed based on the spectral change patterns of satellite images, which was
                quantified by 30 predictor variables. In addition, the sample points under five classes
                (permanent water, tidal flats, barren grounds, vegetated lands, and artificial surfaces) were
                collected as the ground truth data, which were used for training the classification model
                and validating the resultant maps. Finally, the proposed model was realized through
                GEE, which produced the annual maps of tidal flats with an acceptable overall accuracy
                (84.4%). To improve the reliability, it is necessary to postprocess the tidal flat mapping
                product in two aspects. First, the unlikely tidal flats in waterbodies should be masked
                by the Global Surface Water dataset [36]. This dataset was derived from the Landsat 5, 7,
                and 8 images acquired between 1984 and 2020, and provides a global map of the water
                occurrence with the spatial resolution of 30 m. Every pixel on this map has an integer
                value (water frequency) between 0 and 100, and the tidal flat pixels falling within 98 or
                higher-scored areas should be masked since they are considered as permanent water [13].
                Furthermore, the annual map collection of urban extents [30] was used to mask the unlikely
                landward tidal flats in the corresponding years.
                     Aside from the two primary datasets, this study used a shoreline shapefile provided by
                the National Oceanic and Atmospheric Administration [37] to create a two-sided distance
                buffer of 2 km along the coast (coastal buffer for short). With this buffer, it was easier to
                identify, quantify, and analyze the interactive dynamics between urban areas and tidal flats.

                2.3. Methods
                     A workflow was proposed to implement the research tasks in this study (Figure 2).
                As mentioned, the unlikely tidal flat pixels are masked by two datasets, which are Global
                Surface Water and Urban Extents. The preprocessed dataset of tidal flat distribution, as well
                as the dataset of urban extents, were used for spatiotemporal assessments. In particular, the
                coastal buffer was used to capture the spatiotemporal change patterns near the seashore.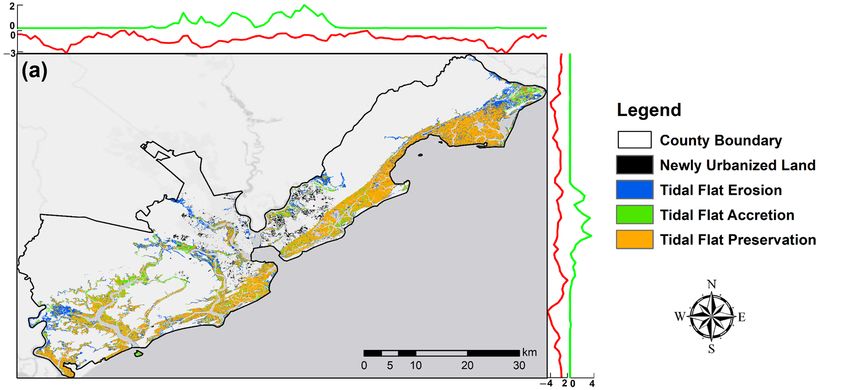
2.3. Methods
A workflow was proposed to implement the research tasks in this study (Figure 2).
As mentioned, the unlikely tidal flat pixels are masked by two datasets, which are Global
Earth 2022, 3 Surface Water and Urban Extents. The preprocessed dataset of tidal flat distribution,561 as
well as the dataset of urban extents, were used for spatiotemporal assessments. In partic-
ular, the coastal buffer was used to capture the spatiotemporal change patterns near the
seashore.
As As we generated
we generated the spatiotemporal
the spatiotemporal patterns ofpatterns of urban expansion
urban expansion and
and tidal flat tidal flat
dynamics,
dynamics,
we we could
could further further
explore explore the between
the interactions interactions between
them. them.ofThe
The details details of imple-
implementation are
mentation
as follows. are as follows.
Figure2.
Figure 2. The
The overall
overall framework
framework for
for analyzing
analyzing the
the spatiotemporal
spatiotemporal dynamics
dynamicsof
of tidal
tidal flats
flatsand
and urban
urban
extents, as well as the interactions between them, from 1985 to 2015.
extents, as well as the interactions between them, from 1985 to 2015.
2.3.1.
2.3.1. Tidal
Tidal Flat
FlatDynamics
Dynamics
The
The spatiotemporal assessments
spatiotemporal assessments for
for tidal
tidal flat
flat dynamics
dynamics were
were conducted
conducted fromfrom three
three
aspects, including annual distribution, spatial occurrence, and overlapping comparison.
aspects, including annual distribution, spatial occurrence, and overlapping comparison. To
better observe
To better the spatial
observe distribution
the spatial patterns
distribution on the
patterns onmap, the pixel
the map, valuesvalues
the pixel were converted
were con-
to area (in km 2 ) and summarized by longitudes and latitudes, which were visualized as
verted to area (in km ) and summarized by longitudes and latitudes, which were visual-
2
line
izedcharts
as linealong
chartsmap edges
along (map-edge
map summary for
edges (map-edge short). for
summary Theshort).
detailsThe
are as follows.
details are as
follows.
1. Annual distribution: As a preliminary consideration of dynamic analysis, it is nec-
1. essary
Annualtodistribution:
summarize As theatemporal change
preliminary patterns ofoftidal
consideration flat areas.
dynamic The data
analysis, were
it is neces-
organized by year and county, then illustrated as line chart. Based on this
sary to summarize the temporal change patterns of tidal flat areas. The data were chart, we
observed
organizedthe byevolutionary trendsthen
year and county, andillustrated
the years of
assignificantly largeron
line chart. Based or this
smaller
chart,areas
we
than the subsequent
observed years.trends
the evolutionary Accordingly,
and thethe further
years explorations
of significantly were
larger orconducted
smaller areasby
referencing the related studies, which explains the geographical backgrounds behind
the identified temporal change patterns in each county.
2. Spatial occurrence: Another preliminary consideration is to map the distribution of
tidal flats in the three counties. Every county has 31 annual maps (binary images) of
tidal flats from 1985 to 2015, where the raster value of 1 represents tidal flats and the
raster value of 0 represents non-tidal flats. The Raster Calculator provided by ArcGIS
was used to sum up all these binary images, which derives the occurrence map of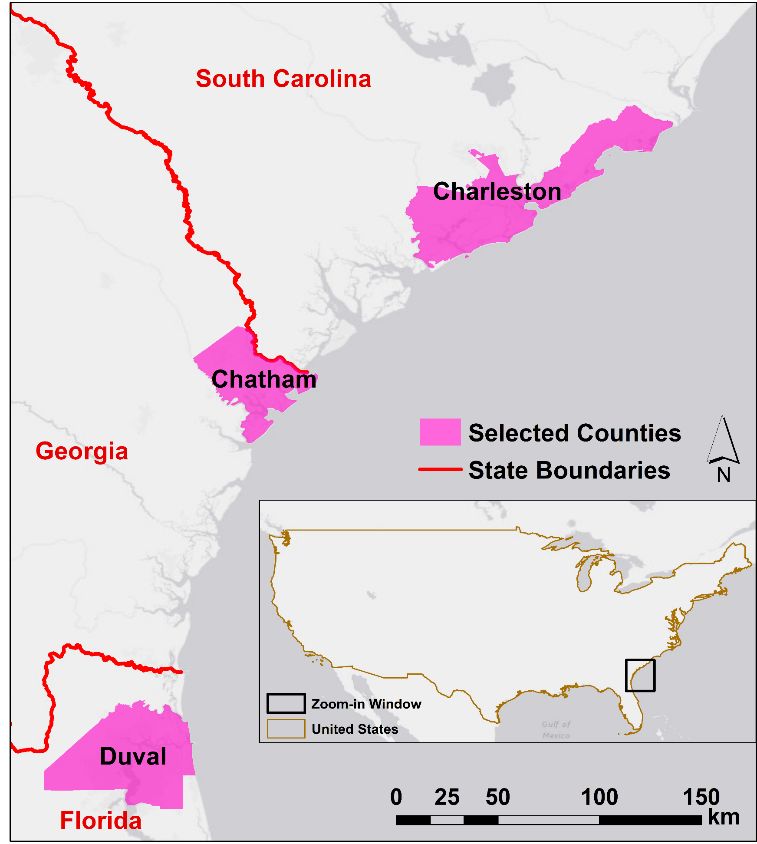
Earth 2022, 3                                                                                              562

                     tidal flats. On the generated map, the pixel values vary from 0 (without occurrence) to
                     31 (always occurrence), which visualizes the spatial patterns of tidal flat distribution
                     during the three decades [13,38,39]. Additionally, the pixel values were divided by
                     31 and visualized as map-edge summaries, which gives the annual average area of
                     tidal flats with respect to longitudes and latitudes. Accordingly, we found the peaks
                     from these map-edge summaries, which highlights the locations and quantifies the
                     intensities of tidal flat clusters.
                3.   Overlapping and comparison: An in-depth inspection of spatiotemporal dynamics
                     was given by overlapping and comparing the maps of tidal flats in the subsequent
                     years [13,39]. A total of 30 comparison results were generated from the annual maps
                     from 1985 to 2015, where tidal flat pixels in the previous year appearing as non-tidal
                     flat pixels in the latter year were regarded as erosions, and accretions in the reverse
                     cases. In addition, the pixels appearing as tidal flats in two consecutive years were
                     considered as preservations. The results of this comparison were summarized as
                     bar charts, in which the annual areas of the three events (erosion, accretion, and
                     preservation) were separately visualized and analyzed. Additionally, this comparison
                     was conducted between the annual maps of every ten years (1985 vs. 1995, 1995
                     vs. 2005, and 2005 vs. 2015), and the spatial distribution of the areas of the three
                     events were visualized on maps. Likewise, the spatial patterns given by the generated
                     maps were displayed as map-edge summaries, in which the accretions contribute to
                     positive values, and the erosions contribute to negative values, and the preservations
                     correspond to zeroes.

                2.3.2. Urbanization Processes
                     Meanwhile, the procedure of urban expansion from 1985 to 2015 also needed to be
                inspected, which was conducted from both temporal and spatial perspectives. Particularly,
                we are interested in the urban expansions near the seashore, which calls for an extra
                assessment. The details are as follows.
                1.   Annual distribution: Likewise, the temporal analysis of urban expansion was based
                     on a line chart, which summarizes the urban area by year and county. Accordingly,
                     we identified the periods of rapid developments in every single county and compare
                     the urban expansion rates between different counties.
                2.   Overlapping and comparison: To visualize the spatial distribution of urban expansion,
                     an overlapping comparison was conducted between the annual maps of urban extents
                     in every ten years (1985 vs. 1995, 1995 vs. 2005, and 2005 vs. 2015). The result was
                     labelled in different colors with respect to the ten-year windows, which allows to
                     find the new urban areas of different periods. Additionally, the new urban areas of
                     different ten-year windows were quantified by the map-edge summaries, in which
                     the peaks identify the intensive urbanizations during the corresponding periods.
                3.   Seaward expansions: Aiming at the nearshore zone, an extra assessment was con-
                     ducted which summarizes the temporal patterns of the urbanization process in the
                     three counties. For every county, the coastal buffer was applied to the 31 annual maps
                     of urban extents, which derives the newly urbanized lands in every year within the
                     three decades. These new urban areas are regarded as seaward expansions, which
                     were summarized as a line chart with respect to year and county. It highlights the rate
                     of urbanization on or adjacent to the coast, which further provides a reference for the
                     assessments of interactions between urban areas and tidal flats.

                2.3.3. Interactions between Tidal Flats and Urban Areas
                      The urbanization in the nearshore zone poses a critical challenge to the environment of
                tidal flats, which not only occupies the ecological space (direct impact) but also jeopardizes
                the surrounding area (indirect impact). Thus, the interactions between urban areas and
                tidal flats were assessed from two aspects, including the direct urbanizations and indirect
                impacts. In addition, it is necessary to visualize the clusters of new urban areas and tidal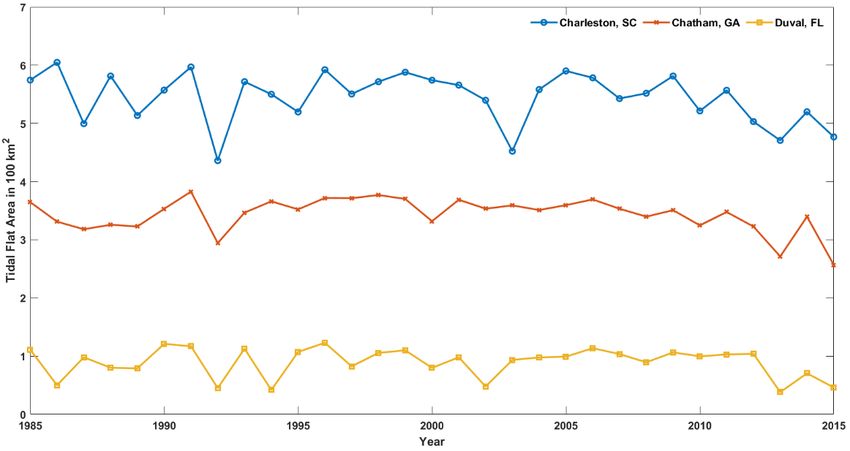
Earth 2022, 3                                                                                              563

                flat losses on the maps, which helps to understand the spatial correlations between them.
                The details are as follows.
                1.   Direct urbanizations: From the results of overlapping comparisons in Section 2.3.1,
                     we extracted the tidal flat erosions by year and county. For every year, we found the
                     overlaps between the new urban areas and tidal flat erosions, which refer to the direct
                     urbanizations on tidal flats. The results were organized by year and county, and then
                     summarized as a table.
                2.   Indirect impacts: Based on the maps of seaward expansions (Section 2.3.2), we created
                     the buffers of different distances (200 m, 500 m, and 1 km) around the new urban
                     areas. The three distance buffers were applied to the map of tidal flat erosions in the
                     corresponding year, which generated the area of erosions with respect to the distance
                     to the new urban areas. The result was organized by year and buffer zone (within 200
                     m, 200 to 500 m, and 500 m to 1 km), which was visualized as line charts and used to
                     quantify the indirect impacts on the surrounding areas.
                3.   Spatial correlations: In this part, we implemented two overlapping comparisons
                     between the maps in the initial year (1985) and latest year (2015). The first comparison
                     was for tidal flats, and the second one was for the urban extents. Again, we are only
                     interested in the nearshore zones, so the coastal buffer wase applied to the urban
                     extents and extracted the seaward expansions during the three decades. The two
                     results of overlapping comparisons were visualized on the maps, from which we
                     observed the spatial correlations between the clusters of new urban areas and tidal
                     flat losses. In addition, there was a pair of parallel map-edge summaries: one was for
                     the seaward urban expansions, and another one was for the area changes of tidal flats.

                3. Results
                3.1. Tidal Flat Dynamics
                     The temporal changes of tidal flat areas in the three counties are summarized and
                visualized in Figure 3. Apparently, Charleston, SC, has the largest tidal flats (544.87 km2
                on annual average), followed by Chatham, GA (343.46 km2 on annual average), and
                Duval, FL (89.49 km2 on annual average). The ratio of the standard deviation to the mean,
                which is also known as the coefficient of variation (CV), is used to evaluate the degree of
                fluctuation. In this regard, the tidal flat areas in Charleston, SC (CV = 0.079), and Chatham,
                GA (CV = 0.084) are much more stable than that in Duval, FL (CV = 0.281). In particular,
                Figure 3 shows that Charleston, SC, in 1992 and 2003, Chatham, GA in 1992, and Duval, FL,
                in 1992 and 1994 had unusually low areas of tidal flats. Moreover, the tidal flats in all three
                counties demonstrated significant trends of shrinkage from 2005 to 2015 (p-values < 0.05),
                as verified by Mann–Kendall test [40,41].
                     The results of overlapping comparison, which details the areas of three events by
                year and county, are provided in Figure 4. Regarding the annual average areas of erosion,
                preservation, and accretion, it follows the ratios of 21:100:20 in Charleston, SC, 17:100:16 in
                Chatham, GA, and 52:100:48 in Duval, FL. Compared with the other two counties, Duval,
                FL, demonstrates outstandingly larger area shares of erosion and accretion. On the other
                hand, the area of preservation in Duval, FL (CV = 0.345), is significantly less stable than
                those in Charleston, SC (CV = 0.096), and Chatham, GA (CV = 0.099). The results of
                overlapping comparison echo the findings from Figure 3, which confirms that Duval, FL,
                has exceptionally higher active tidal flats than the two other counties. Another interesting
                finding is that, in every individual county, the area shares of accretion and erosion are
                considerably close to each other. This means that the accretion and erosion in the early
                years would be greatly offset by the erosion and accretion in the following years, and
                therefore would not significantly impact the overall area of tidal flats for a long period of
                time.
Earth 2022,33, FOR PEER REVIEW
Earth2022, 564
8
Earth 2022, 3, FOR PEER REVIEW 9
Figure3.3. The
Figure The annual
annual distribution
distribution of
of tidal
tidal flat
flat area
area in
in the
the three
three counties.
counties.
The results of overlapping comparison, which details the areas of three events by
year and county, are provided in Figure 4. Regarding the annual average areas of erosion,
preservation, and accretion, it follows the ratios of 21:100:20 in Charleston, SC, 17:100:16
in Chatham, GA, and 52:100:48 in Duval, FL. Compared with the other two counties, Du-
val, FL, demonstrates outstandingly larger area shares of erosion and accretion. On the
other hand, the area of preservation in Duval, FL (CV = 0.345), is significantly less stable
than those in Charleston, SC (CV = 0.096), and Chatham, GA (CV = 0.099). The results of
overlapping comparison echo the findings from Figure 3, which confirms that Duval, FL,
has exceptionally higher active tidal flats than the two other counties. Another interesting
finding is that, in every individual county, the area shares of accretion and erosion are
considerably close to each other. This means that the accretion and erosion in the early
years would be greatly offset by the erosion and accretion in the following years, and
therefore would not significantly impact the overall area of tidal flats for a long period of
time.
Figure 4. The annual distribution of tidal flat erosion, accretion, and preservation areas in
Figure 4. The annual distribution of tidal flat erosion, accretion, and preservation areas in (a)
(a) Charleston, SC; (b) Chatham, GA; and (c) Duval, FL.
Charleston, SC; (b) Chatham, GA; and (c) Duval, FL.
The occurrence maps of tidal flats in the three counties, as well as the longitudinal
and latitudinal summaries of annual average area, are illustrated in Figure 5. According
to the maps, the clusters of tidal flats are not only well distributed along the coast, but also
extended to the inlands along with the sinuous rivers. The longitudinal and latitudinal
summaries suggest that tidal flats are intensively distributed in Charleston, SC, and Chat-Earth 2022, 3 565
The occurrence maps of tidal flats in the three counties, as well as the longitudinal
and latitudinal summaries of annual average area, are illustrated in Figure 5. According
to the maps, the clusters of tidal flats are not only well distributed along the coast, but
also extended to the inlands along with the sinuous rivers. The longitudinal and latitudi-
nal summaries suggest that tidal flats are intensively distributed in Charleston, SC, and
Chatham, GA (line chart peaks reach up to 20 km2 ), while the distribution in Duval, FL,
is less intensified (line chart peaks reach up to 10 km2 ). On the other hand, the mean
durations of tidal flats in Charleston, SC (20.66 years), and Chatham, GA (22.04 years) are
significantly longer than that in Duval, FL (15.32 years). Regarding the frequency, the most
common values in Charleston, SC, and Chatham, GA, are both 30 years, while it is 1 year
Earth 2022, 3, FOR PEER REVIEW in Duval, FL. The tidal flats in Duval, FL, demonstrate shorter durations and more active
10
dynamics than the two other counties, which is consistent with the findings from Figures 3
and 4.
Figure5.5. The
Figure The spatial distributionofoftotal
spatial distribution total tidal
tidal flatflat occurrences
occurrences (in year)
(in year) in (a)inCharleston,
(a) Charleston,
SC; (b)SC;
(b)Chatham,
Chatham,GA;GA;and
and(c)(c)Duval,
Duval,FL. The
FL. Theannual
annual average
average areas (in(in
areas kmkm 2 ) summarized
2) summarized by by
latitudes andand
latitudes
longitudes are visualized as line charts along map edges. (The World Light Gray Basemap
longitudes are visualized as line charts along map edges. (The World Light Gray Basemap is used as is used
as the background, which is provided by Esri, HERE, Garmin, © OpenStreetMap contributors, and
the background, which is provided by Esri, HERE, Garmin, © OpenStreetMap contributors, and the
the GIS User Community.)
GIS User Community.)
The results of overlapping comparisons between the tidal flat maps of every ten years
The results of overlapping comparisons between the tidal flat maps of every ten years
are given in Figure 6. In Charleston, SC, the areas of preservation are 440.87 km2 from 1985
are given in Figure 26. In Charleston, SC, the areas of 2preservation are 440.87 km2 from
to 1995, 439.70 km from 1995 to 2005, and 414.47 km from 2005 to 2015. The area of
1985 to 1995, 439.70 km2 from 1995 to 2005, and 414.47 km2 from 2005 to 2015. The area
preservation contributes the largest portion of this county, and therefore the maps in Fig-
of preservation contributes the largest portion of this county, and therefore the maps in
ure 6a–c are overwhelmingly covered by orange color. In the same county, the areas of
erosion are 133.63 km2 from 1985 to 1995, 79.94 km2 from 1995 to 2005, and 175.65 km2
from 2005 to 2015, while the areas of accretion are 78.77 km2 from 1985 to 1995, 150.42 km2
from 1995 to 2005, and 62.23 km2 from 2005 to 2015. Therefore, the dynamics during the
period of 1985~1995 and 2005~2015 are dominated by erosions, while the period ofEarth 2022, 3 566
Figure 6a–c are overwhelmingly covered by orange color. In the same county, the areas of
erosion are 133.63 km2 from 1985 to 1995, 79.94 km2 from 1995 to 2005, and 175.65 km2
from 2005 to 2015, while the areas of accretion are 78.77 km2 from 1985 to 1995, 150.42 km2
from 1995 to 2005, and 62.23 km2 from 2005 to 2015. Therefore, the dynamics during
the period of 1985~1995 and 2005~2015 are dominated by erosions, while the period of
1995~2005 is a recovery process dominated by accretions. The southwestern portion of
the county, which is featured by the network of the river and creeks, is a typical area that
experienced this erosion–accretion–erosion procedure. As shown in the line chart, this
Earth 2022, 3, FOR PEER REVIEW area corresponds to the major valleys in Figure 6a,c, while contributes the major peaks 11
in Figure 6b. Another active area is the northeastern portion in this county, which had
significant erosions during the period of 2005~2015 and contributes major valleys in the
2 2
line charts
charts of Figure
of Figure (−4(−km
6c 6c 4 km
2 in in
thethe longitudinal
longitudinal summary
summary and−5−km
and 5 km
2 in in thelatitudinal
the latitudinal
summary).
summary).
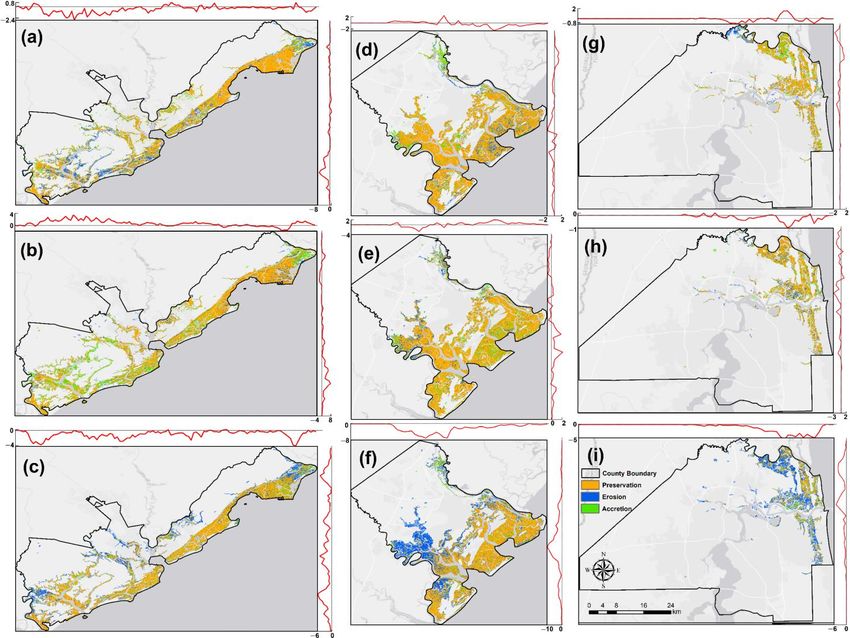
Figure 6. The spatial distribution of tidal flat area changes in Charleston, SC (leftmost column),
Figure 6. The spatial distribution of tidal flat area changes in Charleston, SC (leftmost column),
Chatham, GA (middle column), and Duval, FL (rightmost column), between 1985 and 1995 (top
Chatham, GA (middle column), and Duval, FL (rightmost column), between 1985 and 1995 (top
row); 1995 and 2005 (middle row); and 2005 and 2015 (bottom row). The area changes (in km 2)
1995 and 2
row);
summarized by2005 (middle
latitudes row); and are
and longitudes 2005visualized
and 2015as(bottom row).
line charts The
along area
map changes
edges. (The (in km )
summarized
World Lightby latitudes
Gray Basemapandislongitudes
used as theare visualizedwhich
background, as lineischarts along
provided bymap
Esri, edges.
HERE, (The World
Garmin,
© OpenStreetMap
Light Gray Basemap contributors,
is used asand
thethe GIS User Community.)
background, which is provided by Esri, HERE, Garmin, ©
OpenStreetMap contributors, and the GIS User Community.)
The tidal flats in the two other counties were in stable states during the periods of
The tidal
1985~1995 andflats in the two
1995~2005, andother counties
therefore wereflat
the tidal in areas
stableinstates during
Figure theare
6d,e,g,h periods
domi-of
1985~1995 and 1995~2005,
nantly colored and therefore the
in orange (preservation). tidal flatboth
However, areas in Figure
counties 6d,e,g,h
have are dominantly
significant clusters
of erosions during the period of 2005~2015, as illustrated by Figure 6f,i. During this period,
the erosions in Chatham, GA, are intensively distributed around the upper reaches of the
river and creeks. Likewise, the landward portion of tidal flats in Duval, FL, had experi-
enced a significant shrinkage from 2005 to 2015. The intensive erosions in the inland area
during the recent years is a warning sign of environmental crisis, which is a focus in theEarth 2022, 3 567
colored in orange (preservation). However, both counties have significant clusters of
erosions during the period of 2005~2015, as illustrated by Figure 6f,i. During this period,
the erosions in Chatham, GA, are intensively distributed around the upper reaches of the
river and creeks. Likewise, the landward portion of tidal flats in Duval, FL, had experienced
a significant shrinkage from 2005 to 2015. The intensive erosions in the inland area during
the recent years is a warning sign of environmental crisis, which is a focus in the following
discussions.
3.2. Urbanization Processes
The temporal dynamics of urban expansion in the three counties are summarized and
visualized as Figure 7. The largest urban area belongs to Duval, FL, which is tremendously
larger than the urban areas in two other counties. However, Chatham, GA, observes
the fastest expansion throughout the three decades (34.13%), followed by Charleston, SC
(26.65%), and Duval, FL (23.45%). The further observation focuses on the average annual
expansions, which identifies the fastest consecutive expansions in every individual county.
The result shows that Charleston, SC, has experienced the fastest expansion from 2002 to
2007, with the annual average rate of 1.10%. Similarly, the fastest consecutive expansions
in the two other counties occurred between 2002 and 2008, which are, on annual average,
2.12% in Chatham, GA, and 1.20% in Duval, FL.
The overlapping comparisons were conducted based on the urban maps of every ten
Earth 2022, 3, FOR PEER REVIEW years, and the results are illustrated in Figure 8. All three counties have considerably large 12
area of urbanized lands in the starting year (1985), which is surrounded by small land
patches urbanized in the following three decades. Compared with the first decade, the two
later decades demonstrate higher peaks in the line chart summaries, which is consistent
tremendously
with larger
the findings than
from the urban
Figure 7 and areas in two
confirms other
that counties.
all three However,
counties Chatham, GA,
have experienced an
observes the fastest expansion throughout the three decades (34.13%),
unprecedented rapid progress of urban expansion. Apparently, the newly urbanized followed landsby
Charleston,
in Chatham,SC GA,(26.65%), and Duval,
are intensively FL (23.45%).
distributed on theThe further
inland observation
side, and Duval,focuses on has
FL, also the
average annual
considerably expansions,
urbanized which area
the inland identifies
duringthe
thefastest
three consecutive expansions
decades. However, thereinare
every
still
individual
some new urban areas located within the nearshore zone, including the northeast sideex-
county. The result shows that Charleston, SC, has experienced the fastest of
pansion from
Charleston, SC,2002 to 2007,side
southwest with
ofthe annual GA,
Chatham, average rate side
and east of 1.10%. Similarly,
of Duval, the fastest
FL. These newly
consecutive
urbanized landexpansions in the
patches are twobut
small other
notcounties occurred
negligible, because between
they may2002 and 2008,
directly which
impact the
are, on annual average, 2.12% in Chatham,
environment and distribution of tidal flats. GA, and 1.20% in Duval, FL.
Figure
Figure 7.
7. The
The annual
annual distribution
distribution of urban area
of urban area in
in the
the three
three counties.
counties.
The overlapping comparisons were conducted based on the urban maps of every ten
years, and the results are illustrated in Figure 8. All three counties have considerably large
area of urbanized lands in the starting year (1985), which is surrounded by small land
patches urbanized in the following three decades. Compared with the first decade, theEarth 2022, 3, FOR PEER REVIEW 13
Earth 2022, 3 568
Figure 8. The
Figure 8. spatial distribution
The spatial distribution of
of urban
urban expansion
expansion in
in (a)
(a) Charleston,
Charleston, SC,
SC, (b) Chatham, GA,
(b) Chatham, GA, and
and
(c)
(c) Duval,
Duval, FL,
FL, between
between 1985
1985 and
and 1995
1995 (green); 1995 and
(green); 1995 and 2005
2005 (pink);
(pink); and
and 2005
2005 and
and 2015
2015 (orange).
(orange). The
The
area changes (in km 2) summarized by latitudes and longitudes are visualized as line charts along
2
area changes (in km ) summarized by latitudes and longitudes are visualized as line charts along
map edges. (The World Light Gray Basemap is used as the background, which is provided by Esri,
map edges. (The World Light Gray Basemap is used as the background, which is provided by Esri,
HERE, Garmin, © OpenStreetMap contributors, and the GIS User Community.)
HERE, Garmin, © OpenStreetMap contributors, and the GIS User Community.)Earth 2022,
Earth 2022, 33, FOR PEER REVIEW 14
569
To better
To better quantify
quantify the process of urbanization within the nearshore zone, the coastal
buffer was applied, and the newly urbanized area in the three counties are summarized
and illustrated
illustrated in
inFigure
Figure9.9.Regarding
Regarding thethe total
total area
area of newly
of newly urbanized
urbanized lands,
lands, Duval,
Duval, FL,
FL, contributes
contributes the the largest
largest share share throughout
throughout thethethree
threedecades
decades(43.66
(43.66 kmkm22),), followed
followed by
Charleston,
Charleston, SCSC(32.13 km2 2),),and
(32.13km andChatham,
Chatham,GA GA(15.29
(15.29km 2 ).2 While the highest peak in Duval,
km ). While the highest peak in Du-
FL, falls between 1986 and 1990, the sped-up progress
val, FL, falls between 1986 and 1990, the sped-up progress from from 1998 to 2006
1998 to indicates a morea
2006 indicates
intensive urbanization
more intensive and therefore
urbanization attractsattracts
and therefore greatergreater
attention. Meanwhile,
attention. Charleston,
Meanwhile, SC,
Charles-
and
ton, Chatham, GA, alsoGA,
SC, and Chatham, demonstrate long-lasting
also demonstrate peaks from
long-lasting 2000from
peaks to 2006,
2000which
to 2006,confirms
which
aconfirms
rapid and consecutive
a rapid development
and consecutive within thewithin
development coastalthe
area of both
coastal areacounties.
of both counties.
Figure 9.
Figure 9. The
The annual
annual distribution
distribution of
of newly urbanized lands
newly urbanized lands which
which locate
locate within
within 22 km
km of
of the
the coast in
coast in
the three counties.
the three counties.
3.3. Interactions between Tidal Flats and Urban Areas
Areas
Since aa tidal
tidalflat
flatisisananimportant
importantland land source
source forfor
urban expansion,
urban expansion, we wesummarized
summarized the
details by year
the details and and
by year county, and the
county, andresults are given
the results in Table
are given 1. Regarding
in Table 1. Regardingthe information
the infor-
given
mationbygiven
Figure by9,Figure
it turns out
9, it thatout
turns tidal flattidal
that had flat
contributed considerable
had contributed shares ofshares
considerable land
for urban expansion throughout the three decades, which are
of land for urban expansion throughout the three decades, which are 30.47% in Charles- 30.47% in Charleston, SC,
39.90% in Chatham, GA, and 22.12% in Duval, FL. Particularly,
ton, SC, 39.90% in Chatham, GA, and 22.12% in Duval, FL. Particularly, tidal flats had tidal flats had contributed
more than half
contributed more of than
the lands
half offorthenew
landsurban
for newareasurban
during 2010~2011
areas in all threeincounties,
during 2010~2011 all three
which arewhich
counties, 70.42% arein70.42%
Charleston, SC, 77.17%
in Charleston, SC, in Chatham,
77.17% GA, and
in Chatham, GA, 55.22% in Duval,
and 55.22% FL.
in Du-
According to Table to
val, FL. According 1, Table
there 1,arethere
threeareunusually high records
three unusually in Charleston,
high records SC, which
in Charleston, SC,
correspond to the periods
which correspond of 1986~1987,
to the periods 1991~1992,
of 1986~1987, and 1995~1996.
1991~1992, In particular,
and 1995~1996. 97.86% of
In particular,
the new urbans were derived from tidal flats during the first period
97.86% of the new urbans were derived from tidal flats during the first period (1986~1987), (1986~1987), which is
the greatest single-year contribution throughout the three decades.
which is the greatest single-year contribution throughout the three decades. The other The other two periods
two
also
periods also observed considerable shares of tidal flat contributions, which are during
observed considerable shares of tidal flat contributions, which are 51.41% 51.41%
1991~1992, and 51.37%
during 1991~1992, and during
51.37% 1995~1996. As mentioned,
during 1995~1996. the highest
As mentioned, the contribution by tidal
highest contribution
flats occurred in Chatham, GA, and Table 1 shows a stable rate of
by tidal flats occurred in Chatham, GA, and Table 1 shows a stable rate of tidal flat urban-tidal flat urbanization
during the three
ization during thedecades (CV = 0.422).
three decades In particular,
(CV = 0.422). there are
In particular, therefive
areperiods in which
five periods tidal
in which
flats have more than two-thirds of the contribution to new
tidal flats have more than two-thirds of the contribution to new urbans, which areurbans, which are 1985~1986
(86.93%),
1985~19861991~1992
(86.93%), (80.38%),
1991~19921994~1995
(80.38%), (90.51%),
1994~19952010~2011
(90.51%), (77.17%),
2010~2011and 2012~2013
(77.17%), and
(89.58%). By contrast, Duval, FL, has the least stable rate of tidal flat urbanization among the
2012~2013 (89.58%). By contrast, Duval, FL, has the least stable rate of tidal flat urbaniza-
three counties (CV = 0.571), with the peaks during 1985~1986, 1991~1992, and 2011~2012
tion among the three counties (CV = 0.571), with the peaks during 1985~1986, 1991~1992,
emphasizing the rapid expansion of urban area towards the shoreline.
and 2011~2012 emphasizing the rapid expansion of urban area towards the shoreline.Earth 2022, 3 570
Table 1. The annual distribution of newly urbanized tidal flats in the three counties (in km2 ).
Current Year 1 Charleston, SC Chatham, GA Duval, FL
1986 0.24 0.12 0.47
1987 0.62 0.04 0.08
1988 0.14 0.14 0.18
1989 0.25 0.14 0.17
1990 0.16 0.11 0.12
1991 0.23 0.11 0.35
1992 0.61 0.30 0.46
1993 0.03 0.18 0.03
1994 0.31 0.21 0.32
1995 0.09 0.32 0.05
1996 0.68 0.11 0.13
1997 0.18 0.12 0.31
1998 0.14 0.14 0.07
1999 0.17 0.18 0.24
2000 0.17 0.11 0.15
2001 0.25 0.14 0.17
2002 0.35 0.11 0.32
2003 0.18 0.29 0.04
2004 0.11 0.19 0.14
2005 0.19 0.15 0.38
2006 0.40 0.26 0.18
2007 0.38 0.19 0.31
2008 0.31 0.20 0.26
2009 0.21 0.16 0.17
2010 0.20 0.10 0.17
2011 0.23 0.13 0.20
2012 0.28 0.19 0.23
2013 0.35 0.19 0.45
2014 0.23 0.07 0.15
2015 0.49 0.31 0.15
1 The period of annual comparison is between the current year and its previous year.
The area of tidal flat erosion was classified by the distance to new urban areas, and
then we calculated the area ratios of tidal flat erosions to the corresponding distance buffers,
which is known as the intensity of erosion. The result was further summarized by year, and
then visualized as Figure 10. Throughout the three decades, the overall intensity of erosion
within 200 m, 200 to 500 m, and 500 m to 1 km are 2.52%, 1.95%, and 1.59%, which suggests
that farther places from the new urban areas have lower intensified erosion of tidal flats.
On the other hand, the Person’s test [42] verified the high correlations between the results
within the 200 m buffer and 200 to 500 m buffer (r = 0.932), as well as the 200 to 500 m
buffer and 500 m to 1 km buffer (r = 0.910). These strong correlations further endorsed the
regularity between distance and intensity, since it works for different urbanization patterns
in different years.
The results of overlapping comparison within the coastal buffer, which gives the area
changes of tidal flats and urban areas during the three decades, are visualized in Figure 11.
In Charleston, SC (Figure 11a), the newly urbanized lands are intensively distributed in
the middle part of the county, which corresponds to the eastern and western wings of the
City of Charleston. The intensified urban expansion results in the peak up to 2 km2 in the
longitudinal summary, as well as the peak up to 4 km2 in the latitudinal summary. The
cluster of tidal flat erosions is also identified from the same area, which corresponds to
the valley up to −2 km2 in the longitudinal summary, and the valley up to −2 km2 in the
latitudinal summary. Likewise, the new urban areas in Chatham, GA (Figure 11b), are
distributed along the north, east, and south edges of the City of Savannah. In particular,
the new urban areas on the southern side of the city contribute a peak up of 1 km2 to the
longitudinal summary, as well as a peak of 2 km2 in the latitudinal summary. Meanwhile, aEarth 2022, 3 571
huge cluster of tidal flat erosion appears at the center of the map, which greatly overlaps the
new urban areas and corresponds to the major valleys in both longitudinal (up to −8 km2 )
and latitudinal (up to −10 km2 ) summaries. Compared with the two other counties, Duval,
FL (Figure 11c), is a more typical case of land interactions between tidal flats and urban
areas. It has numerous new urban patches distributed around the river estuary and seaside,
which heavily overlap the erosions of tidal flats. As a result, the estuary area corresponds
Earth 2022, 3, FOR PEER REVIEW 16
to the major valleys in the summaries for tidal flats (up to −5 km2 ), as well as the major
peaks in the summaries for urban areas (up to 2.5 km2 ).
Figure
Figure 10.
10. The
The intensity
intensity of
of tidal
tidal flat
flat erosion
erosion around
around the seaward-expanded urbans.
the seaward-expanded urbans.
The results of overlapping comparison within the coastal buffer, which gives the area
changes of tidal flats and urban areas during the three decades, are visualized in Figure
11. In Charleston, SC (Figure 11a), the newly urbanized lands are intensively distributed
in the middle part of the county, which corresponds to the eastern and western wings of
the City of Charleston. The intensified urban expansion results in the peak up to 2 km2 in
the longitudinal summary, as well as the peak up to 4 km2 in the latitudinal summary.
The cluster of tidal flat erosions is also identified from the same area, which corresponds
to the valley up to −2 km2 in the longitudinal summary, and the valley up to −2 km2 in the
latitudinal summary. Likewise, the new urban areas in Chatham, GA (Figure 11b), are
distributed along the north, east, and south edges of the City of Savannah. In particular,
the new urban areas on the southern side of the city contribute a peak up of 1 km2 to the
longitudinal summary, as well as a peak of 2 km2 in the latitudinal summary. Meanwhile,
a huge cluster of tidal flat erosion appears at the center of the map, which greatly overlaps
the new urban areas and corresponds to the major valleys in both longitudinal (up to −8
km2) and latitudinal (up to −10 km2) summaries. Compared with the two other counties,
Duval, FL (Figure 11c), is a more typical case of land interactions between tidal flats and
urban areas. It has numerous new urban patches distributed around the river estuary and
seaside, which heavily overlap the erosions of tidal flats. As a result, the estuary area cor-
responds to the major valleys in the summaries for tidal flats (up to −5 km2), as well as the
Figure 11. Cont.
major peaks in the summaries for urban areas (up to 2.5 km2).Earth 2022, 3 572
Figure 11. The spatial distribution of urban expansion and tidal flat dynamics from 1985 to 2015
within 2 km of the coast in (a) Charleston, SC, (b) Chatham, GA, and (c) Duval, FL. The area changes
(in km2 ) of tidal flats (in red) and urban extents (in green) are summarized as line charts along map
edges. (The World Light Gray Basemap is used as the background, which is provided by Esri, HERE,
Garmin, © OpenStreetMap contributors, and the GIS User Community.)
4. Discussion and Conclusions
In this study, we separately assessed the spatiotemporal dynamics of tidal flats and
urban areas in Charleston, SC, Chatham, GA, and Duval, FL, from 1985 to 2015. Then, the
tidal flat losses, which are directly or indirectly associated with urban expansion in the three
counties, were identified and quantified from a geospatial perspective. As one of the earliest
attempts to investigate the spatiotemporal correlations between tidal flats and urban areas,
this paper verifies and highlights the conflicts between the intensified human activities
and coastal environments. More importantly, the approach used in this paper could be
revised and applied to the entire US, through which we could identify and summarize more
diversified spatiotemporal regularities and further make contributions to sustainable urban
planning and eco-friendly policymaking for coastal communities. In this section, we first
summarize the identified spatiotemporal patterns and seek the reasonable explanations
from peers’ studies (Section 4.1). Then, we consider the environmental consequences of the
rapid urbanizations of tidal flats, and explore some possible solutions suggested by other
studies (Section 4.2). Finally, we discuss the limitations of this study and determine the
directions of the future works (Section 4.3).
4.1. Explanations for the Identified Patterns
1 The environment of tidal flats is sensitive to climate changes. Since the maintenance
of tidal flats highly relies on the stable supply of fresh water, severe drought has been
confirmed as a major threat to the coastal environment [43]. It may explain some extreme
low records of tidal flat annual area. For example, Figure 3 shows a constant shrinkage
of tidal flats in Charleston, SC, from 1999 to 2003, which overlaps a period of widespread
drought throughout the coastal area of South Carolina [44]. On the contrary, too much
water is not good news either: tidal flats can be inundated by the high-tide flooding, which
is common during El Niño periods [45]. From 2009 to 2010, El Niño brought unusually high
precipitation to Charleston, SC, and there was a higher-than-average rainfall in Chatham,
GA also [46], which may explain the shrinkages of tidal flats in these two counties. For the
tidal flat cluster in Duval, FL, the south portion has significantly short duration (Figure 5c),
which was also an erosion-dominated area from 2005 to 2015 (Figure 6i). According to the
urban map (Figure 8c), this cluster locates between the City of Jacksonville and its satelliteEarth 2022, 3 573
cities along the Atlantic Coast. Therefore, tidal flats in this area are under the pressure
from urban expansion, which is from both the eastern and western sides. In particular,
the western side had been rapidly urbanized during the three decades (Figure 11c), which
gives Duval, FL, the largest new urban areas within 2 km of the coast (Figure 9).
Duval, FL, has much smaller tidal flats than the other two counties (Figure 3), while it
has the largest newly urbanized area towards the seashore (Figure 9). Compared with the
two other counties, Duval, FL, has a less stable environment of tidal flats (Figure 4), which
calls for a higher level of public awareness and concern. Meanwhile, some suburbs in the
two other counties have also been rapidly urbanized, including the eastern and western
wings of the City of Charleston (Figure 8a) and southwestern side of the City of Savannah
(Figure 8b). As verified by Figure 10, these urbanizations would also considerably affect the
surrounding tidal flats, and the closer places would receive higher environmental pressures.
Therefore, we not only observed the spatial overlaps between new urban areas and tidal
flat erosions, but also the much larger erosion clusters in the surrounding areas (Figure 11).
Moreover, we found that the constant shrinkage of tidal flats (Figure 3) is hysteretic to
the accelerated process of urbanization in the coastal area (Figure 9). As emphasized by a
relevant study [47], the hysteresis effect also exists in the restoration and management of
ecosystems, and severe damages may result in irreversible changes. Therefore, it takes time
to observe the follow-up ecological effects of urban expansion in recent years, and the tidal
flats in the three counties urgently need a sustainable plan of management in response to
the rapid expansion of urban areas.
4.2. Environmental Consequences and Possible Solutions
The absence of tidal flats makes the coastal communities more vulnerable to natural
hazards, which is the environmental consequence of unsustainable development. With
the baseline in 2010, Vousdoukas et al. (2020) [48] conducted a long-term projection for
the storm-induced coastal erosions at a global scale. As projected, most coastlines will
retreat 30 to 50 m by 2050, and more than 100 m by 2100. Particularly, the Atlantic Coast
of the southeastern US, in which the study area is located, will experience more serious
land losses than the rest of world (more than 100 m by 2050, and approximately 200 m by
2100). Meanwhile, the coastal flooding will become more serious than ever. According to a
projection for the study area [49], severe floods will be more frequent as time goes by, and
the level of historical 100-year floods will increase by 2 m at the end of the 21st century.
Essentially, a recent study [50] concludes that the reclamation of tidal flats aggravates the
risk from storms and therefore is regarded as a primary source of increased flood risks.
Located along the Atlantic Coast of the southeastern US, the study area is usually exposed to
the hurricanes, which will be more frequent and serious in the coming decades [51]. For the
sake of coastal residents, it is urgent to seek a solution with respect to both environmental
resilience and sustainable development.
It is challenging to restore tidal flats in highly urbanized areas, and we found some
insightful ideas from the successful experiences in the rest of world. A case study in
Taean County, South Korea [52], assessed the changes of tidal flats before and after the
construction of Hwangdo Bridge, which connects Anmyeon Island and Hwang Island.
In 1982, an inland dike was constructed in this area, which had blocked the seawater
circulation for three decades and consequently damaged the tidal flat ecosystem in the
surrounding area. The inland dike was replaced with a bridge in 2011, which resumed the
hydrodynamic regime and the stable and sufficient supply of sedimentation. As a result,
the tidal flats gradually expanded, and the associated ecosystem was restored. Moreover,
the case study of Singapore [53] demonstrates higher initiative of sustainable development.
As claimed by that study, the ecological engineering on artificial shorelines would be a
practical solution. The core concept is to leave sufficient space for the landward migration
of tidal flats, which prevents the effects of coastal squeeze due to sea level rise [54,55]. In
other words, the environmental pressure on tidal flats comes from two aspects, which are
urban expansion from inland and sea level rise from the ocean. While it is challenging toYou can also read