WP/20/96 - International ...
←
→
Page content transcription
If your browser does not render page correctly, please read the page content below

WP/20/96

     The Distributional Impact of Recessions: the Global
          Financial Crisis and the Pandemic Recession

                                                                  by Ippei Shibata

IMF Working Papers describe research in progress by the author(s) and are published
to elicit comments and to encourage debate. The views expressed in IMF Working Papers
are those of the author(s) and do not necessarily represent the views of the IMF, its
Executive Board, or IMF management.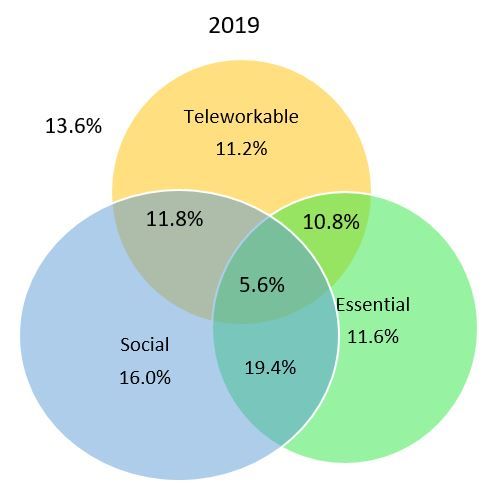
© 2020 International Monetary Fund                                                                                                                 WP/20/96

                                                              IMF Working Paper

                                                              Research Department

The Distributional Impact of Recessions: the Global Financial Crisis and the Pandemic
                                     Recession1

                                                        Prepared by Ippei Shibata

                                          Authorized for distribution by Romain Duval

                                                                        June 2020

  IMF Working Papers describe research in progress by the author(s) and are published to
  elicit comments and to encourage debate. The views expressed in IMF Working Papers are
  those of the author(s) and do not necessarily represent the views of the IMF, its Executive Board,
  or IMF management.
                                                                              Abstract
Using the U.S. Current Population Survey data, this paper compares the distributional impacts of
the Pandemic Crisis and those of the Global Financial Crisis in terms of (i) worker characteristics,
(ii) job characteristics–“social” (where individuals interact to consume goods),
“teleworkable” (where individuals have the option of working at home), and “essential” jobs
(which were not subject to government mandated shut-downs during the recent recession), and (iii)
wage distributions. We find that young and less educated workers have always been affected more
in recessions, while women and Hispanics were more severely affected during the Pandemic
Recession. Surprisingly, teleworkable, social and essential jobs have been historically less cyclical.
This historical acyclicality of teleworkable occupations is attributable to its higher share of skilled
workers. Unlike during the Global Financial Crisis, however, employment in social industries fell
more whereas employment in teleworkable and essential jobs fell less during the Pandemic Crisis.
Lastly, during both recessions, workers at low-income earnings have suffered more than top-
income earners, suggesting a significant distributional impact of the two recessions.

JEL Classification Numbers: E24, E3, J21, L25

Keywords:Labor Market Dynamics, Current Population Survey, COVID-19 Pandemic, Gross Worker Flows,
Distributional Impact

Author’s E-Mail Address: ishibata@imf.org

1 InternationalMonetary Fund, 700 19th Street NW, Washington, DC 20431 (email: ishibata@imf.org). The author thanks John Grigsby and Erik Hurst with
their invaluable suggestions for this project. The author also thanks helpful suggestions by Marina M. Tavares and seminar participants of the IMF Research
Department. The views expressed in this study are the sole responsibility of the author and should not be attributable to the International Monetary Fund, its
Executive Board, or its management.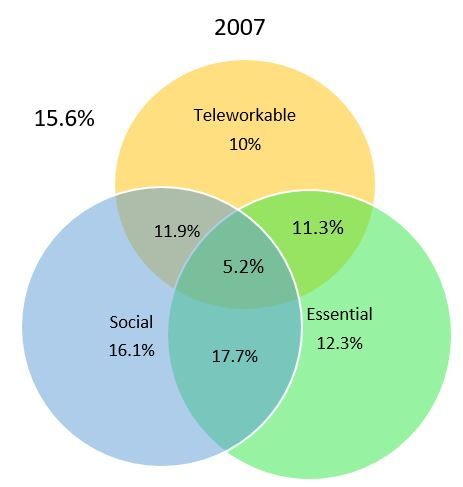
1. Introduction _________________________________________________________________________________________________________ 4

2. Data __________________________________________________________________________________________________________________ 6

3. Aggregate Employment and Hours Declines during the Pandemic Recession ____________________________________ 8
4. The Distributional Effects of the Pandemic Reces- sion vs the Global Financial Crisisby Demographic Groups
__________________________________________________________________________________________________________________________9

  4.1. Gender _____________________________________________________________________________________________________________________________ 10

  4.2. Age Group _________________________________________________________________________________________________________________________ 10
  4.3. Race ________________________________________________________________________________________________________________________________ 10

  4.4. Education ___________________________________________________________________________________________________________________________ 11
5. The Distributional Effects of the Pandemic Reces- sion vs the Global Financial Crisis by Occupation and
Industry ________________________________________________________________________________________________________________ 12
  5.1. Occupation _________________________________________________________________________________________________________________________ 12
     5.1.1. Teleworkable Occupations _____________________________________________________________________________________________________ 13

  5.2. Industry _____________________________________________________________________________________________________________________________ 14
     5.2.1. Social Industry_________________________________________________________________________________________________________________ 14
     5.2.2. Essential Industry ______________________________________________________________________________________________________________ 15

  5.3. Importance of Looking at Teleworkable, Social, and Essential Jobs __________________________________________________________________ 16

6. Empirical Analysis of Labor Market Outcomes dur- ing the Pandemic Recession vs the Global Financial Crisis20

7. Distributional Impact at Individual Level: the Pan- demic Recession vs the Global Financial Crisis _________ 22
Conclusion_____________________________________________________________________________________________________________ 25

References _____________________________________________________________________________________________________________ 27

Appendix: Robustness Check Results _________________________________________________________________________________ 29

FIGURES
1: Aggregate Employment and Average Hours Decline ____________________________________________________________________________________ 8
2: Unemployment Rate _____________________________________________________________________________________________________________________ 9
3: Extensive/Intensive Margin during 2007-2009 and 2019-April 2020 by Sex ____________________________________________________________ 10
4: Extensive/Intensive Margin during 2007-2009 and 2019-April 2020 by Age Group ____________________________________________________ 11
5: Extensive/Intensive Margin during 2007-2009 and 2019-April 2020 by Race __________________________________________________________ 11
6: Extensive/Intensive Margin during 2007-2009 and 2019-April 2020 by Education _____________________________________________________ 12
7: Change in Unemployment Rate and Hours Worked during 2007-2009 and 2019- _____________________________________________________ 13
8: Change in Unemployment Rate and Average Hours Worked during 2007-2009 and _______________________________________________________ 13
9: Change in Unemployment Rate and Average Hours Worked during 2007-2009 and _______________________________________________________ 14
10: Change in Unemployment Rate and Average Hours Worked during 2007-2009 _____________________________________________________ 15
11: Change in Unemployment Rate and Average Hours Worked during 2007-2009 _____________________________________________________ 16
12: Changes in Unemployment Rate during 2007-2009 and 2019-April 2020 by Oc- ____________________________________________________ 19
13: Employment Share by Teleworkable, Social, and Essential Jobs: 2007-09 vs 2019- ___________________________________________________ 19

TABLES
1: Share Employment in teleworkable, social, and essential jobs by broad occupation _______________________________________________________ 17
2: Share of Employment in teleworkable, social, and essential jobs by broad industry ________________________________________________________ 18
3: Share of Employment, Female and Skilled Workers in teleworkable, social, and ___________________________________________________________ 18
4: Regression Results: Change in Log Employment _______________________________________________________________________________________ 21
5: Regression Results: Monthly Job Separation for Wage Quantiles ______________________________________________________________________ 24

APPENDIX TABLES
6: Regression Results: Change in Unemployment Rate ____________________________________________________________________________________ 29
7: Regression Results: Monthly Job Separation for Wage Quantiles (Only Employment ______________________________________________________ 30
1       Introduction
    The novel coronavirus, also known as SARS-CoV-2, had significantly impacted the U.S.
labor market. The Bureau of Labor Statistics (BLS) data for April 2020 show that the U.S.
unemployment rate has increased to 14.7 percent from 3.5 percent in February 2020. During
the same period, the employment-to-population ratio has plummeted from 61.1 percent to
51.3 percent. The government’s shutdown and social-distancing policies had differential
impacts on the types of jobs that had been lost. On one hand, the government allowed
continued operations of ”essential” industries, such as health care workers, water utilities,
and grocery stores. On the other hand, the social-distancing policy prohibited operations
of ”social jobs” that require physical interactions, such as leisure and hospitality industries.
Moreover, while some workers could start working from home, others could not work without
going into their workplace, such as workers at grocery stores.
    The purpose of this paper is two fold: (i) to study the differential impacts on employment,
unemployment rate, and hours worked across different segments of the economy and (ii) to
compare the labor market impacts of the current Pandemic Recession to those of the Global
Financial Crisis.1 In particular, we focus on (i) demographic characteristics of workers–age,
gender, race, and education, (ii) three types of job characteristics–”essential” (which were
not subject to government mandated shutdowns during the current Pandemic recession),
”social” (where consumption of goods require human interactions) and ”teleworkable” (where
individuals have the option of working at home)–, and (iii) wage distributions of workers.
    Using U.S. Current Population Survey data, we show that teleworkable and essential jobs
are less affected during the current Pandemic Recession while social jobs have been affected
severely. Surprisingly, however, we show that all three types of jobs have been less affected (or
less cyclical) during the 2008 Global Financial Crisis. Moreover, the resilience (acyclicality)
of teleworkable jobs to the negative aggregate shocks during the Global Financial Crisis can
be attributable to the fact that a large share of workers in teleworkable jobs is skilled or
highly-educated workers–who have been historically less affected in any recession.
    Looking at demographic characteristics of workers, this paper corroborates the findings
of other research in that Hispanic and female workers have been more severely affected than
their counterparts during the current Pandemic Recession. Less educated and young workers
have always been affected more severely than their more educated and older counterparts in
both recessions (the Global Financial Crisis and the current Pandemic recession). Interest-
ingly, the data still does not show an evidence of older workers, who are known to have a
    1
    One caveat of this paper is that our latest available data for the current Pandemic is April 2020, which
could be the beginning, middle, or end of the current crisis. Empirical results may change as more data
become available.

                                                     4
higher mortality risk from COVID-19, getting more severely affected in terms of job loss.
    Finally, the Global Financial Crisis and the current Pandemic recession both had a
significant negative distributional impact in terms of job prospects. Low-income earners had
a much higher chance of job loss than those at the top wage quantile. This differential impact
of the job separation rates was much more stark during the current Pandemic recession.
This result holds true even after accounting for worker characteristics as well as occupation,
industry, and state fixed effects, and corroborates the finding of Cajner et al. (2020), who
have used administrative payroll data.
    This paper complements the existing literature in several ways: (i) we compare the
current recession with the Global Financial Crisis and show that teleworkable jobs have
historically been less affected (cyclical) than other jobs, mainly due to their large share of
skilled workers; (ii) we also highlight the importance of looking at both occupation and
industry by showing large heterogeneity within occupation x industry pairs in terms of their
degree of being teleworkable, social, and essential (e.g. Dingel and Neiman (2020), Mongey
et al. (2020), and Kaplan et al. (2020)); and (iii) we also corroborate that low wage earners
suffer more in terms of job loss both during the current recession and the Global Financial
Crisis, but particularly so during the current recession.
    A sizable literature has emerged seeking to understand the macroeconomic impact of
the novel coronavirus. A subset of this literature employs economic theory to understand
the tradeoffs between minimizing adverse health effects and mitigating economic disruptions
(Alvarez et al., 2020; Eichenbaum et al., 2020; Jones et al., 2020; Kaplan et al., 2020). Others
provide high-frequency data to track the impact of the coronavirus on small businesses
(Bartik et al., 2020b), economic uncertainty (Baker et al., 2020a), consumption and debt
(Baker et al., 2020c), stock market volatility (Baker et al., 2020b), and broad economic
activity (Lewis et al., 2020). Two recent papers – Dingel and Neiman (2020) and Mongey
et al. (2020) – predict heterogeneous employment losses during the current recession based
on job characteristics, such as the ability to work at home, or whether the sector requires
social interaction, which we test in the CPS data.
    This paper most closely relates to the rapidly growing segment of empirical literature
which monitors the labor market during the beginning of the Pandemic Recession. Ca-
jner et al. (2020) use weekly paycheck data from ADP – the largest U.S. payroll processing
company – to study the behavior of different segments of the U.S. labor market through
mid-April. They find that employment declines have been concentrated at the bottom of
the wage distribution, amongst the youngest and eldest of the population, and in social in-
dustries. Similarly, Bartik et al. (2020a) and Kurmann et al. (2020) show enormous declines
in both employment and hours in the aggregate economy as well as the leisure and hospi-

                                               5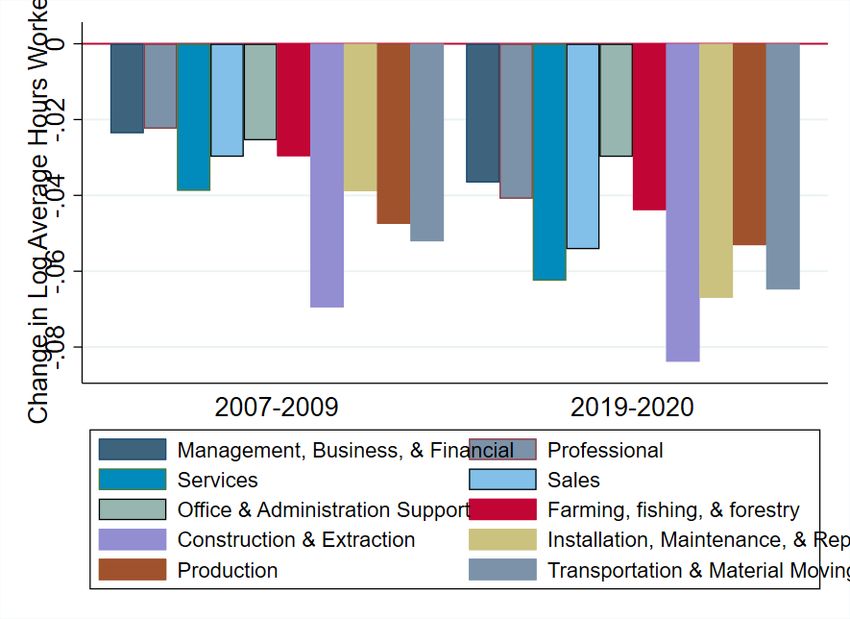
tality sector, respectively, using data from Homebase, and online scheduling and time-clock
software provider. Coibion et al. (2020) use survey data from the Nielsen Homescan panel in
the first week of April to document huge declines in employment, as well as an unprecedented
7 percentage point decline in labor force participation, between early March and early April.
Our paper complements these works by using a large, nationally-representative survey to
highlight the labor market behavior across demographic groups. Lastly, Montenovo et al.
(2020) also study disparities in labor market outcomes using the Current Population Survey
until April 2020. Specifically, they study how recent incidence of job loss differed across
different demographic groups and face-to-face work, remote, and essential work. However,
they do not compare the recent labor market outcome against the Global Financial Crisis in
terms of job characteristics unlike this paper.
    The paper proceeds as follows. Section 2 describes the Current Population Survey in
detail, as well as our approach to sample construction. Section 3 explores the patterns for
the aggregate economy, focusing on the share of both employed and unemployed workers
and hours worked. Section 4 explores heterogeneity in the labor market behavior of workers
according to their demographics and education. Section 5 studies the heterogeneity in labor
market outcomes across occupation and industry between the Global Financial Crisis and
the Pandemic crisis. Section 6 conducts regression analysis to understand the cyclicality of
teleworkable, social, and essential jobs between the Global Financial Crisis and the current
Pandemic recession. Section 7 studies the distributional impact of the Global Financial
Crisis and the Pandemic recession in terms of job separation rates based on wage quantiles.
Section 8 concludes.

2    Data
    We use the Current Population Survey (CPS), a national representative survey for the
U.S., between 2007 to April 2020. The Current Population Survey (CPS) has several advan-
tages over high-frequency datasets that have been used to track the coronavirus’ influence
on the labor market thus far. The CPS is a large, nationally-representative survey and is the
source data underlying official employment statistics released by the Bureau of Labor Statis-
tics (BLS). The CPS contains information regarding workers’ labor force status, industry,
occupation, and demographics (e.g. sex, age, race, geographical locations, and education),
permitting new insight into the effects of the coronavirus across a variety of individual types.
    The CPS conducts monthly interviews of approximately 60,000 households and 100,000
to 150,000 individuals based on physical address. Households are interviewed for four consec-
utive months, and then rotated out for the next eight months before being interviewed again

                                               6
four more months. This structure allows researchers to track workers’ labor force status for
a maximum of eight months during a 16-month period. In the fourth and eighth month in
the survey (outgoing rotation groups), workers in the sample are asked about their wage
information, which we will use to rank workers into different wage quantiles.
We use cross-sectional aspect of the CPS for majority of our analysis but also use its
longitudinal aspect to study the distributional impact of the current Pandemic recession. To
construct longitudinal CPS dataset, we follow the algorithm in Madrian and Lefgren (2000)
to match individuals over 5 months over the period of 13 months. Individuals are matched
across months based on their household identifier, personal identifier, sex, age, and race.
Age is allowed to differ by increment of one between consecutive months. Based on this
algorithm, close to 90 percent of the eligible sample can be matched for four consecutive
months.2 More than 60 percent of the eligible sample can be followed for five monthly
surveys across 13 months.
Because only a subsample of the individuals can be matched in the survey due to various
reasons including simple attrition and coding errors, longitudinal data do not necessarily
line up with the aggregate cross-sectional statistics. If the matching attrition is completely
random and independent of any demographic characteristics, we can simply scale up the
weights by the ratio of the total sample number in the original survey to the number in
the matched sample. However, attrition is often not random. To ensure that demographic
representations in the matched sample mirror those in the original survey, we rescale the
sample weights of the matched individuals by multiplying them by the inverse of matching
probability conditional on the individual’s demographic characteristics and labor force status.
Specifically, we estimate a logit model and calculate the predicted probability of matching
conditional on gender, age, race, education, and labor force status. We then multiply the
original weights by the inverse of the corresponding predicted probabilities. This partially
alleviates the problem arising from non-random attrition. Throughout we focus on a broad
definition of prime-age workers by only considering those between the ages of 21 and 70. We
additionally exclude military workers.
2
In each month, the survey contains 8 rotational groups based on the number of month in the sample.
Between two consecutive months, only a subset of the workers belonging to the rotation groups 1-3 and
4-7 in the first month can be matched to the following month’s survey. These eligible groups from the first
survey will appear as the rotation groups 2-4 and 5-8 in the second survey while the rotation groups 5 and
8 from the first survey will leave the CPS sample, either for the next 8 months (for rotation group 5) or
permanently (rotation group 8). Thus, around 75 percent of the total sample from the first month is eligible
to be matched.
7Figure 1: Aggregate Employment and Average Hours Decline
3 Aggregate Employment and Hours Declines during
the Pandemic Recession
This section summarizes the aggregate employment decline in the United States during
the first few months of the Pandemic recession. Figure 1 shows the trend in the aggregate
employment rate for individuals aged 21 to 70 between January and April 2020. We highlight
two employment rate series: the first tracks those who report being employed while the
second excludes those who report being employed but were absent from work during the
survey week. As seen from the figure, the U.S. employment to population rate for this age
groups fell by almost nine percent during this period. The decline was even steeper – at
12 percent – excluding workers who were absent from work from the employment measure.3
Figure 1 also shows the average hours worked for all individuals aged 21 to 70 who remained
employed with positive hours through April 2020 (solid line). Hours worked for those that
remained employed fell by 3.3 percent or 1.3 hrs.
How much of total decline in hours worked has occurred on the extensive margin vs the
intensive margin? Aggregate hours worked including both the extensive and intensive margin
changes has fallen by 17.3 percent between January and April 2020. Using the results above,
80 percent of the decline in aggregate hours (or -13.8 percent) is attributable to the extensive
margin (decline in employment rate) while 20 percent (or -3.4 percent) is attributable to the
intensive margin (hours worked).
Figure 2 plots trends in the unemployment rate for 21-70 year old during the same period.
Again, we compute two unemployment measures. First, we measure the unemployed as
3
Note that in this study, we use non-seasonally adjusted data and different age groups (21-70 years old)
from the Employment Situation Report by Census. Therefore, the numbers here may be slightly different
from the Census report.
8Figure 2: Unemployment Rate
those who are not employed but who are actively looking for a job. This is the standard
unemployment measure. For our second measure, we also include those who report being
employed but were absent from work as also being unemployed. The unemployment rate
for workers between 21-70 years old have increased by 9.3 percent between January and
April 2020. An alternative measure of unemployment rate, which includes those who report
being employed but were absent from work as also being unemployed, has increased by 13.5
percent from 6 percent to 19.5 percent during the same period.
4 The Distributional Effects of the Pandemic Reces-
sion vs the Global Financial Crisis by Demographic
Groups
In this section, we investigate whether the group of workers who have been more severely
affected during the current Pandemic recession had also been severely affected during the
2008 Global Financial Crisis. Specifically, we study changes in both the extensive (employ-
ment rate) and intensive (average hours worked) margin of employment between 2007 and
2009 against those between 2019 and April 2020 across (i) gender, (ii) race, (iii) age group,
and (iv) educational attainment. We show that while the magnitude of decline in employ-
ment and hours worked is much severe during this current recession than during the Global
Financial Crisis, the groups of workers suffered relatively more (younger, less educated and
non-whites workers) were similar between the two recessions. One key difference between
the two recessions is that women saw a sharper decline in employment during the current
recession than during the Global Financial Crisis.
9Figure 3: Extensive/Intensive Margin during 2007-2009 and 2019-April 2020 by Sex
4.1 Gender
Figure 3 plots the changes in log employment to population ratio and the log average
hours worked by gender between 2007-2009 and 2019-April 2020. Whereas men suffered
more in terms of employment (extensive margin) in 2007-2009, women got more heavily
affected during the current Pandemic recession. However, conditional on being employed,
the average hours worked declined less for women during both during the Global Financial
Crisis and the current Pandemic recession. However, as we show later in Section 6, a major
part of the decline in employment rate for women during this recession is attributable to the
fact that women are more likely to work in the industries and occupations that were affected
more severely during the current Pandemic recession.
4.2 Age Group
Figure 4 plots the changes in extensive and intensive margin of employment for 2007-2009
and 2019-April 2020 for age groups by every 10 years. Compared to the GFC, younger work-
ers, particularly the workers between 21-30 years old, saw a sharper decline in employment
during the current Pandemic recession than the other age groups. The magnitude of decline
in log average hours worked (intensive margin) was similar across different age group, with
the exception of the older workers between 61-70 years old.
4.3 Race
Figure 5 plots the changes in extensive and intensive margin of employment for 2007-2009
and 2019-April 2020 by race. Compared to the Global Financial Crisis, employment rates
for black and Hispanic workers declined more severely than other racial groups, particularly
10Figure 4: Extensive/Intensive Margin during 2007-2009 and 2019-April 2020 by Age Group
Figure 5: Extensive/Intensive Margin during 2007-2009 and 2019-April 2020 by Race
during the current recession. The hours worked declined least for Asian workers.
4.4 Education
Figure 6 plots the changes in extensive and intensive margin of employment for 2007-
2009 and 2019-April 2020 by educational attainment level. While the magnitudes of decline
in both employment rate and average hours worked are more severe during the current
recession, the pattern of relative decline is very similar across educational groups between
the two recessions. Less educated workers have seen a much sharper decline in both the
employment rate and the average hours worked than more educated workers.
11Figure 6: Extensive/Intensive Margin during 2007-2009 and 2019-April 2020 by Education
5 The Distributional Effects of the Pandemic Reces-
sion vs the Global Financial Crisis by Occupation
and Industry
5.1 Occupation
In this section, we first compare the changes in unemployment rate and average hours
worked by occupation. Here, we focus on the unemployment rate rather than employment
because only employed and unemployed workers, but not those out of the labor force, report
their occupation and industry.4 Figure 7 plots the changes in unemployment rate and the log
average hours worked by occupation between 2007-2009 and 2019-April 2020. Whereas ser-
vice occupations were affected less during the Global Financial Crisis, workers in that sector
suffered most during the current recession. Sales and office and administrative support also
saw relatively sharper increase in the unemployment rate during the current recession than
the previous recession. On the other hand, conditional on being employed, the patterns of
changes in the average hours worked were very similar between the past recession and the
current recession. Workers in management, business and financial occupations have been
less affected than workers in other occupations both during the current recession and the
Global Financial Crisis.
4
This prohibits one from calculating an appropriate sub-population of group that individuals belong to.
12Figure 7: Change in Unemployment Rate and Hours Worked during 2007-2009 and 2019-
April 2020 by Occupation
Figure 8: Change in Unemployment Rate and Average Hours Worked during 2007-2009 and
2019-April 2020 by Teleworkability
5.1.1 Teleworkable Occupations
Due to social distancing measure and lock-down policies, workers who are able to work
from home are postulated to be less affected during the current crisis. Following Dingel
and Neiman (2020) and Mongey et al. (2020), we classify jobs into teleworkable and non-
teleworkable occupations. Figure 8 plots the changes in unemployment rate for teleworkable
and non-teleworkable occupations. We see that workers in teleworkable occupations are less
affected during any recession, but workers in non-teleworkable occupations have been much
more severely affected during the current recession. Figure 8 looks very similar when we plot
changes in the log employment-to-aggregate population changes. However, conditional on
being employed, workers in teleworkable occupation have also seen a decline in the average
hours worked.
13Figure 9: Change in Unemployment Rate and Average Hours Worked during 2007-2009 and
2019-April 2020 by Industry
5.2 Industry
Figure 9 plots changes in unemployment rate and the average hours worked during the
Global Financial Crisis and the current Pandemic recession. Almost all the industries except
for agriculture, construction, and financial sectors have seen a sharper rise in the unemploy-
ment rate during the current recession than the previous recession. In particular, workers in
leisure and hospitality have seen a sharp increase in the unemployment rate. These workers
have also seen a sharp decline in the average hours worked.
5.2.1 Social Industry
Following Kaplan et al. (2020), we categorize industries into social and non-social (con-
sumption). Industries are considered as social if their output requires interpersonal interac-
tion to consume. If you need to work in a factory or a warehouse close to other people in
order to produce the output, that does not count as social, but if you need to meet someone
to consume the output then it does. Therefore, manufacturing makes a consumption good
whereas restaurants make a social good. Some industries could be harder to categorize,
for instance, retail and finance. We categorize finance industry as non-social even though
you may need to meet with a branch manager to open an account, because the majority
of financial services are performed without interpersonal interaction. Retail is classified as
social because you need to go to a store and interact with a clerk to purchase goods. The
rise in online retail over the last 15 years has made that less true today, but we still classify
retail industry as social. Even within a broad industry category, some more finely defined
industries are considered social while others are not. For instance, the financial services
that are social are automotive rental and leasing, and other consumer goods are rental and
14Figure 10: Change in Unemployment Rate and Average Hours Worked during 2007-2009
and 2019-April 2020 by Social and Non-Social Industry
leasing. The professional services that are social are vets, security guards, and services to
buildings and dwellings (except cleaning during construction). The manufacturing sector
that is social is retail bakeries.
Figure 10 plots changes in unemployment rate and the average hours worked during
the Global Financial Crisis and the current Pandemic recession by social and consumption
(non-social) industries. Between 2007-09, the social industries saw a small increase in the
unemployment rate. However, during this current Pandemic, the unemployment rate of
social jobs has increased sharply, almost twice as much as that of non-social jobs. The hours
worked of workers in social sectors has also sharply declined.
5.2.2 Essential Industry
During the current Pandemic crisis, the government has allowed the business operations
of essential industries while restricting those of non-essential industries (Tomer and Kane,
2020). These include health care facilities, grocery stores, and water utilities.
Figure 11 plots changes in the unemployment rate and average hours worked for non-
essential and essential industries during the Global Financial Crisis and the current Pandemic
Crisis. Interestingly, the essential industries have suffered less in terms of unemployment
rate during the Global Financial Crisis. However, during the current crisis, the non-essential
industries have seen much sharper changes in both unemployment rate and average hours
worked.5
5
Log employment to aggregate population ratios show similar patterns.
15Figure 11: Change in Unemployment Rate and Average Hours Worked during 2007-2009
and 2019-April 2020 by Essential and Non-Essential Industry
5.3 Importance of Looking at Teleworkable, Social, and Essential
Jobs
The previous subsections showed general patterns of changes in unemployment rates and
average hours worked during the two recessions. This section emphasizes the importance of
looking at both occupation and industry by showing significant heterogeneity even within
teleworkable occupations.
Table 1 shows the share of employment in teleworkable, social and essential jobs by broad
occupation categories.6 It shows a significant degree of heterogeneity even at the broad level
of occupations. For instance, workers in managerial, financial, and professional occupations
tend to have a larger share of teleworkable employment and have a higher share of workers
with bachelor’s degree or above. Nevertheless, professional and related occupations are more
likely to be social than those in managerial, financial, and professional occupations. Con-
struction and extraction occupations and transportation and material moving occupations
are both not teleworkable. However, construction and extraction occupations are less social
and non-essential than transportation and material moving occupations.
Table 2 shows the share of employment in teleworkable, social, and essential jobs by broad
industry categories. Leisure and hospitality and educational and health services are both
social, but only educational and health services are essential. Leisure and hospitality is also
less likely to be teleworkable than education and health services. Moreover, a larger fraction
of workers in education and health service industries is with bachelor’s degree than those
working in leisure and hospitality. While agriculture, forestry, fishing and hunting industries
6
Employment share is calculated based on 2019 data to avoid the potential bias from using the data
during the Pandemic recession.
16Table 1: Share Employment in teleworkable, social, and essential jobs by broad occupation
classification
Share of Employment with:
Teleworkable Essential Social Bachelor’s
(1) (2) (3) (4)
Management, business, and financial occupations 0.83 0.44 0.29 0.60
Professional and related occupations 0.63 0.43 0.67 0.73
Service occupations 0.05 0.38 0.89 0.17
Sales and related occupations 0.21 0.37 0.63 0.34
Office and administrative support occupations 0.53 0.56 0.47 0.27
Farming, fishing, and forestry occupations 0.00 0.96 0.03 0.12
Construction and extraction occupations 0.00 0.09 0.03 0.09
Installation, maintenance, and repair occupations 0.01 0.54 0.45 0.10
Production occupations 0.00 0.59 0.14 0.11
Transportation and material moving occupations 0.00 0.69 0.59 0.12
and construction industry are both non-social, but the former is considered essential while
the latter is not.
Figure 12 plots the changes in unemployment rates by broad occupation category and
broad industry category between the Global Financial Crisis and the current recession. We
see that more teleworkable occupations tend to be less affected during this recession than
the previous recession. Workers in management and professional occupations have been less
affected during the current recession than the previous recession. Social and non-essential
industries, particularly, jobs in leisure and hospitality, have been much more severely affected
than jobs in other industries during the current recession than the previous recession.
Table 3 shows the share of employment in terms of female and skilled workers within
each type of jobs. First, we see that there are more skilled workers in 2019 (40 percent)
than in 2007 (33 percent). Second, the share of aggregate employment in all the three jobs
have increased between 2007 and 2019. Social jobs have increased by 2 percentage points.
Third, we see that teleworkable jobs have a higher share of skilled workers, those who have
college and more education, (63 percent in 2019) than the average (40 percent in 2019).
However, average educational level of workers in essential and social jobs are very similar to
the average. Lastly, teleworkable and social jobs have higher share of female workers but,
particularly true for social jobs, partially explaining a sharper decline in female employment
during the current Pandemic recession.
Lastly, Figure 13 shows a Venn diagram for the employment share for teleworkable,
17Table 2: Share of Employment in teleworkable, social, and essential jobs by broad industry
classification
Share of Employment with:
Teleworkable Essential Social Bachelor’s
(1) (2) (3) (4)
Agriculture, forestry, fishing, and hunting 0.08 1.00 0.00 0.21
Mining 0.28 0.84 0.00 0.26
Construction 0.20 0.00 0.00 0.16
Manufacturing 0.30 0.64 0.01 0.30
Wholesale and retail trade 0.20 0.40 0.78 0.26
Transportation and utilities 0.23 0.82 0.57 0.23
Information 0.59 0.59 0.00 0.56
Financial activities 0.70 0.70 0.03 0.54
Professional and business services 0.65 0.32 0.14 0.56
Educational and health services 0.51 0.54 1.00 0.56
Leisure and hospitality 0.14 0.00 1.00 0.24
Other services 0.31 0.27 0.73 0.29
Public administration 0.47 . . 0.52
social, and essential jobs. We see that large fractions of jobs overlap across categories. For
instance, while social jobs comprise 50.9% (52.9%) of total employment in 2007 (2019),
68.4 (=34.8%/50.9%) % (69.7%) of them are also categorized as teleworkable and essential
jobs in 2007 (2019). A 16.1% (16.0%) of total employment is purely social that is neither
teleworkable nor essential. Thus, the Venn diagram illustrates a large overlap of different
types of jobs.
Table 3: Share of Employment, Female and Skilled Workers in teleworkable, social, and
essential jobs
Share of Total Employment
Employment Women High Skill
Year 2007 2019 2007 2019 2007 2019
Aggregate .476 .480 .333 .400
Teleworkable .384 .393 .583 .559 .555 .633
Essential .465 .475 .494 .497 .324 .395
Social .509 .529 .592 .596 .342 .398
18Figure 12: Changes in Unemployment Rate during 2007-2009 and 2019-April 2020 by Oc-
cupation and Industry
Figure 13: Employment Share by Teleworkable, Social, and Essential Jobs: 2007-09 vs 2019-
20
196 Empirical Analysis of Labor Market Outcomes dur-
ing the Pandemic Recession vs the Global Financial
Crisis
Previous sections showed changes in employment, unemployment, and average hours
worked across different demographic groups and different occupation and industries, with
special focus on their teleworkability, socialbility, and essentiability. In this section, we
formally test if the current recession has seen a very different pattern from the previous
recession in terms of the decline in employment and average hours worked. Our empirical
specification is as follows:
∆(Yit −Yt ) = αtw OccT W +αs IndS +αe IndE +γXit +P andemic∗(βtw OccT W +βs IndS +βe IndE +Γp Xit )+it
(1)
where (∆Yit − ∆Yt ) is a change in log employment or unemployment rate at a occupation
× industry cell level (∆Yit ) after subtracting the aggregate change in the variable (∆Yt ) for
each recession to control for the difference in the size of shocks between the Global Financial
Crisis and the current Pandemic recession. OccT W , IndS and IndE are indicator variables if
a occupation × industry cell belongs to a teleworkable occupation, a social industry, or an
essential industry. Pandemic is an indicator variable that is equal to 1 if ∆Yit is the change
between 2019 and April 2020 and zero if it is the change between 2007 and 2009. α’s capture
the relative change in log employment or unemployment rate for teleworkable, social, and
essential jobs during the Global Financial Crisis. β’s are the variables of our interest, which
captures differential changes in log employment or unemployment rate during the Pandemic
recession. The total changes in the left hand side variables for the pandemic recession are
given by the sum of αk and βk for k ∈ {T W, S, E}. We restrict our occupation x industry
pairs to the ones with more than 10 observations, leaving us with 700 observations for our
regression analysis.
Table 4 shows the regression results of equation (1). Column (1)-(3) show the regres-
sions with teleworkable occupation dummy, social industry dummy, and essential industry
dummy and their cross-product with the pandemic dummy without any demographic con-
trols. Standard errors shown are all robust standard errors. Column (4) shows the results
including all three categories of teleworkable, essential and social jobs. We first see that
all teleworkable, social and essential industries were less affected than their counterparts
during the Global Financial Crisis, which is implied by significant and positive coefficients.
20Table 4: Regression Results: Change in Log Employment
(1) (2) (3) (4) (5) (6)
Teleworkable Occ. 0.064∗∗ 0.048∗∗∗ -0.016 -0.024
(0.029) (0.018) (0.013) (0.016)
Social Ind. 0.061∗∗∗ 0.119∗∗∗ 0.115∗∗∗ 0.088∗∗∗
(0.020) (0.019) (0.019) (0.016)
Essential Ind. 0.067∗ 0.049∗∗∗ 0.052∗∗∗ 0.041∗∗
(0.035) (0.018) (0.018) (0.016)
Teleworkable × Pandemic 0.080∗∗∗ 0.133∗∗∗ 0.102∗∗∗ 0.099∗∗∗
(0.019) (0.031) (0.034) (0.036)
Social × Pandemic -0.123∗∗ -0.218∗∗∗ -0.230∗∗∗ -0.132∗∗∗
(0.060) (0.064) (0.064) (0.039)
∗
Essential × Pandemic 0.041 0.107∗∗∗ 0.093∗∗∗ 0.123∗∗∗
(0.024) (0.038) (0.034) (0.041)
Skill 0.185∗∗∗ 0.184∗∗∗
(0.037) (0.035)
Skill × Pandemic 0.035 -0.013
(0.051) (0.065)
Men -0.005
(0.031)
Men × Pandemic 0.113
(0.086)
Education Control: N N N N Y Y
Demographic Controls: N N N N N Y
Observations 700 700 700 700 700 700
R-squared 0.085 0.055 0.058 0.272 0.319 0.379
Note: Regression results are of equation 1. Robust standard errors are in parentheses.
21During the pandemic, teleworkable and essential jobs remained to be less affected than their
counterparts. However, social jobs have been affected more severely than their counterparts,
and its total impact (sum of coefficients on essential industry and its interaction term with
pandemic dummy) is negative.
There is a tight link between teleworkable jobs and its composition of skilled workers.
Although teleworkable jobs have been less affected than their counterparts both during the
Global Financial Crisis and the current Pandemic without any control variables (Table 4:
Column (1)-(4)), the impact on teleworkable jobs was similar to their counterparts during
the Global Financial Crisis once we control for the composition of educated workers (Column
(5)). In other words, the sensitivity of teleworkable jobs to negative aggregate shocks are
in GFC can be attributable to its composition of skilled workers. Nevertheless, during the
current Pandemic recession, teleworkable jobs, even after accounting for the composition of
skilled workers, have been less affected than the counterparts.7
On the other hand, social jobs are much more severely affected during the Pandemic,
and essential jobs are even less affected during the current Pandemic than during the Global
Financial Crisis. This holds true even after controlling for the demographic compositions
(Column 6). Moreover, column (6) shows that the difference in job loss between men and
women becomes statistically insignificant (Men x Pandemic) once we control for the types of
jobs (teleworkable occupaitons, and social and essential industries) and demographic char-
acteristics (age, race, and education) at occupation x industry level. This is different from
the naive comparison of total employment decline from Figure 3, which suggests that women
have been affected more during the Pandemic than men.8
7 Distributional Impact at Individual Level: the Pan-
demic Recession vs the Global Financial Crisis
Many researchers have shown that this Pandemic recession is impacting the most vulner-
able and low income group more severely than their less vulnerable and richer counterparts
in terms of health and income (Cajner et al. (2020) and Schmitt-Grohé et al. (2020)). In
this section, we study the distributional effects in terms of employment outcome between the
7
However, the relative change in unemployment rate is similar between teleworkable and non-teleworkable
jobs during the Pandemic (Table 6 Column (6) in Appendix). This difference in results based on log
employment-to-population ratio and the unemployment rate can be attributable to the movement into out
of labor force.
8
Using individual level regression, Montenovo et al. (2020) show that women still suffered more during
this recession than men. However, the degree of gender explaining the increase in temporary layoff declines
by two-thirds once occupations and industries are controlled for.
22Pandemic Recession and the Global Financial Crisis. Specifically, we investigate how much
of the higher job separation probabilities for the lowest quantile in wage distribution can be
explained by workers’ demographic characteristics, occupations (e.g. teleworkability), and
industries (social and essential).
We exploit the panel dimension of the Current Population Survey for this section. We
focus our analysis on the month-to-month job separation probability between February and
April 2020 compared to the Global Financial Crisis period of 2008 to 2009. Using the wage
information for the outgoing rotation groups, we can observe wage information between 9
and 11 months prior to the observation month and group the individuals into four wage
quantiles.9 We then follow the month-to-month transition rates during the Global Financial
Crisis (2008 and 2009) and the Pandemic recession (February-April 2020). We define job
separation as movement from being employed in month t-1 to either being unemployed or
out of labor force in month t. We do so to take into account the results of Coibion et al.
(2020), which claim that many of those who lost jobs are not actively looking for a job and
thus may be classified as out of the labor force. However, the results are generally robust
when we restrict our sample to March-April 2020 transition only and to movement from
employment to unemployment (and excluding out of labor force) (See Table 7 in Appendix
for robustness check).
Following Cajner et al. (2020), our empirical specification is a linear probability model
with OLS with standard errors clustered at broad occupation x industry categories:
Q T
X X
JSRit = I{i’s quantile is q}×(αq +βq P andemic)+ΓXit +ΦXit ×P andemic+ θt IMt +it
q=1 t=1
(2)
where JSRit is a dummy variable which is equal to 1 if a worker has separated from a job
between t − 1 and t and 0 otherwise. In our baseline specification, we define job separation
as a movement from employment to either unemployment or out of the labor force. As a
robustness check, we alternatively define job separation as the movement from employment
to unemployment. αq measures the job separation probabilities during the pre-Pandemic
period for a worker belonging to quantile q relative to the top-wage earner, and βq measures
the job separation probabilities relative to the top-wage earners during the Pandemic for a
worker who belonged to wage quantile q prior to the recession. Xit includes demographic
characteristics of workers, and θt IMt are the time fixed effects for each month.
Our specification differs in several dimensions from Cajner et al. (2020). While Cajner
9
To increase the sample size, we treat both February-March and March-April 2020 as the Pandemic
period
23Table 5: Regression Results: Monthly Job Separation for Wage Quantiles
(1) (2) (3) (4)
Wage Quantile: 1 0.017∗∗∗ 0.013∗∗∗ 0.011∗∗∗ 0.010∗∗∗
(0.001) (0.002) (0.002) (0.002)
Wage Quantile: 2 0.007∗∗∗ 0.005∗∗∗ 0.003∗∗ 0.002
(0.001) (0.001) (0.001) (0.001)
Wage Quantile: 3 0.003∗∗ 0.002∗ 0.000 0.000
(0.001) (0.001) (0.001) (0.001)
Pandemic × Wage Quantile: 1 0.078∗∗∗ 0.076∗∗∗ 0.058∗∗∗ 0.038∗∗∗
(0.012) (0.011) (0.008) (0.007)
Pandemic × Wage Quantile: 2 0.049∗∗∗ 0.047∗∗∗ 0.033∗∗∗ 0.025∗∗∗
(0.011) (0.010) (0.008) (0.006)
Pandemic × Wage Quantile: 3 0.020∗∗∗ 0.019∗∗∗ 0.011∗∗∗ 0.009∗∗
(0.005) (0.005) (0.004) (0.004)
Demographic Controls: N Y Y Y
Education Control: N N Y Y
Occ x Ind Fixed Effects: N N N Y
State Fixed Effects: N N N Y
Observations 245,149 245,149 245,149 245,149
R-squared 0.023 0.025 0.027 0.041
Note: Table shows regression results of equation 2. ”Wage Quantile: q” and ”Wage Quantile: q” ×
Pandemic show the coefficients αq0 s and βq0 s from the regression. The coefficient shows the differential job
separation rate for workers in quantile q relative to the top (4th) quantile. Standard Errors are clustered at
occupation x industry Level.
24et al. (2020) split the sample into five different wage quanties, we separate into four different
quantiles (i.e. 0-25th percentile, 25th-50th percentile, 50th-75th percentile, and 75th-100th
percentile) to allow more observations within the cell. Unlike Cajner et al. (2020), we control
for educational attainment level of workers but do not control for business size. Moreover,
we use wage information from a year ago while they use early March wage data to categorize
the sample into different wage quantiles.
Table 5 shows the regression results of equation (2). Column (1) shows the baseline
results with no control. We see that the workers at the bottom wage quantiles have a much
higher chance of separating from a job than workers in the top wage quantile during the
Global Financial Crisis and the current Pandemic recession. Column (2) shows the results
controlling for non-education demographic information (i.e. gender, race, and age). The
demographic information explains about 20 percent of job separation rate for the workers
at the bottom wage quantile (0.013 − 0.017)/(0.017) ≈ 0.23) during the Global Financial
Crisis. Column (3) further controls for the educational attainment, which explains additional
11 percent of job separation probabilities of workers in the bottom quantile or total of 40
percent combining demographic and educational information during the Global Financial
Crisis. During the Pandemic, the workers in the bottom three quantiles suffered from a
higher chance of losing job than those in the top quantile.
Column (4) controls for broad occupation x industry and state fixed effects. Even after
controlling for broad occupation x industry and state fixed effects, workers in the bottom
wage quantile got more severely affected during the current Pandemic than the Global Fi-
nancial Crisis, suggesting a severe distributional impact of the current Pandemic. Results
are robust to alternatively defining job separation probability as those moving from employ-
ment to unemployment but excluding movement to out of the labor force (see Table 7 in
Appendix). In sum, during both recessions, workers at the bottom wage quantile had suf-
fered more than those in the top wage quantile. However, the current recession had shown
a even stronger distributional impact than the previous recession in terms of job prospects
for the workers at the bottom wage quantile.
8 Conclusion
This paper studies the differential impacts of recessions on employment, unemployment
rate, and hours worked across different segments of the economy during the current Pandemic
Recession and the Global Financial Crisis. In particular, we focus on (i) demographic char-
acteristics of workers–age, gender, race, and education, (ii) three types of job characteristics–
”essential” (which were not subject to government mandated shutdowns during the current
25Pandemic recession), ”social” (where consumption of goods require human interactions) and
”teleworkable” (where individuals have the option of working at home)–, and (iii) wage
distributions of workers.
We document that teleworkable and essential jobs are less affected during the current
Pandemic Recession while social jobs have been affected severely. Surprisingly, however, we
show that all three types of jobs have been less affected (or less cyclical) during the 2008
Global Financial Crisis. Furthermore, the resilience (acyclicality) of teleworkable jobs to
the negative aggregate shocks during the Global Financial Crisis can be attributable to the
fact that a large share of workers in teleowrkable jobs consists of skilled or highly-educated
workers–who have been historically less affected in any recession.
With regards to workers’ demographic characteristics, this paper corroborates the findings
of other research in that Hispanic and female workers have been more severely affected than
their counterparts during the current Pandemic Recession. Less educated and young workers
have always been affected more severely than their more educated and older counterparts in
both recessions (the Global Financial Crisis and the current Pandemic recession).
Finally, the Global Financial Crisis and the current Pandemic recession both had a
significant negative distributional impact in terms of job prospects. Low-income earners
had suffered more from job loss than top-income earners. This differential impact of the job
separation rates was much more stark during the current Pandemic recession.
26References
Alvarez, Fernando E, David Argente, and Francesco Lippi, “A Simple Planning
Problem for COVID-19 Lockdown,” Working Paper 26981, National Bureau of Economic
Research April 2020.
Baker, Scott R, Nicholas Bloom, Steven J Davis, and Stephen J Terry, “COVID-
Induced Economic Uncertainty,” Working Paper 26983, National Bureau of Economic
Research April 2020.
Baker, Scott R., Nicholas Bloom, Steven J. Davis, Kyle J. Kost, Marco C.
Sammon, and Tasaneeya Viratyosin, “The Unprecedented Stock Market Impact of
COVID-19,” Working Paper 26945, National Bureau of Economic Research April 2020.
Baker, Scott, Robert Farrokhnia, Seffen Meyer, Michaela Pagel, and Constantine
Yannelis, “How Does Household Spending Respond to an Epidemic? Consumption and
Debt During the 2020 COVID-19 Pandemic,” Work in Progress, 2020.
Bartik, Alexander W., Marianne Bertrand, Feng Lin, Jesse Rothstein, and Matt
Unrath, “Labor Market Impacts of COVID-19 on Businesses: Update with Homebase
Data Through April 8,” mimeo 2020.
Bartik, Alexander W, Marianne Bertrand, Zoë B Cullen, Edward L Glaeser,
Michael Luca, and Christopher T Stanton, “How Are Small Businesses Adjusting
to COVID-19? Early Evidence from a Survey,” Working Paper 26989, National Bureau
of Economic Research April 2020.
Cajner, Tomaz, Leland Crane, Ryan Decker, John Grigsby, Adrian Hamins-
Puertolas, Erik Hurst, Christopher Kurz, and Ahu Yildirmaz, “The U.S. Labor
Market During the Beginning of the Pandemic Recession,” Working Paper 27159, National
Bureau of Economic Research May 2020.
Coibion, Olivier, Yuriy Gorodnichenko, and Michael Weber, “Labor Markets During
the COVID-19 Crisis: A Preliminary View,” Working Paper 27017, National Bureau of
Economic Research April 2020.
Dingel, Jonathan I and Brent Neiman, “How Many Jobs Can be Done at Home?,”
Working Paper 26948, National Bureau of Economic Research April 2020.
Eichenbaum, Marty, Sergio Rebelo, and Mathias Trabandt, “The Macroeconomics
of Epidemics,” Work in Progress, 2020.
Jones, Callum J, Thomas Philippon, and Venky Venkateswaran, “Optimal Mitiga-
tion Policies in a Pandemic: Social Distancing and Working from Home,” Working Paper
26984, National Bureau of Economic Research April 2020.
Kaplan, Greg, Ben Moll, and Gianluca Violante, “Pandemics According to Hank,”
Work in Progress, 2020.
27You can also read