WORLDS PREMIERE The launch of a long-awaited telescope is going to throw back the curtains. Who is first in line to look?
←
→
Page content transcription
If your browser does not render page correctly, please read the page content below
VOL. 102 | NO. 8
AUGUST 2021
WORLDS
PREMIERE
The launch of a long-awaited telescope
is going to throw back the curtains.
Who is first in line to look?
Picnic Below
a Lava Light Show
Flood Forecasting
in India
Science by Sailboat

FROM THE EDITOR
Editor in Chief
Heather Goss, Eos_EIC@agu.org
Unveiling the Next Exoplanet Act AGU Staff
Vice President, Communications,
Marketing, and Media Relations Amy Storey
T
he whole field of exoplanet study is frustratingly tantaliz- Editorial
ing. We now know for sure there are alien worlds. We can Managing Editor Caryl-Sue Micalizio
see them! Kinda. We see their shadows; we can see their Senior Science Editor Timothy Oleson
fuzzy outlines. We are so close to the tipping point of having Associate Editor Alexandra Scammell
News and Features Writer Kimberly M. S. Cartier
enough knowledge to truly shake our understanding—in the best News and Features Writer Jenessa Duncombe
way, says this space geek—of Earth’s place in the universe.
Production & Design
The first light of the James Webb Space Telescope ( JWST) may
Assistant Director, Operations Faith A. Ishii
be what sends us over that exciting edge. In just a few months, Production and Analytics Specialist Anaise Aristide
the much-delayed launch will, knock on wood, proceed from Assistant Director, Design & Branding Beth Bagley
French Guiana and take around a month to travel to its destina- Senior Graphic Designer Valerie Friedman
Senior Graphic Designer J. Henry Pereira
tion at the second Lagrange point (L2). “This is certainly an excit-
ing time for exoplanet science, with current missions like Hubble Marketing
and TESS [Transiting Exoplanet Survey Satellite] providing us Communications Specialist Maria Muekalia
Assistant Director, Marketing & Advertising Liz Zipse
with new discoveries and future missions like JWST, which promises to provide incredible new
data that will answer some of our current questions and also create many new ones,” said Sarah
Hörst of Johns Hopkins University, Eos’s Science Adviser representing AGU’s Planetary Sciences Advertising
Display Advertising Steve West
section who consulted on this issue. “The field is moving very quickly right now.” steve@mediawestinc.com
That’s why our August issue is all about exoplanets—what we know and what awaits us over Recruitment Advertising recruitmentsales@wiley.com
the launch horizon. Who gets the first peek through JWST? In March, the proposals selected for
the first observing cycle were announced. Meet the slate of scientists who will be pointing the Science Advisers
telescope at other worlds, and read what they hope to learn in “Overture to Exoplanets” on Geodesy Surendra Adhikari
page 26. Geomagnetism, Paleomagnetism,
and Electromagnetism Julie Bowles
As with all new instruments, the data collected from JWST will be pieced together with obser- Natural Hazards Paula R. Buchanan
vations from ongoing missions and other facilities around the world. “Over the last decade, we’ve GeoHealth Helena Chapman
gotten gorgeous images from the ALMA interferometer in Chile and have seen loads of fine-scale Atmospheric and Space Electricity Kenneth L. Cummins
Cryosphere Ellyn Enderlin
structure, tracing pebbles in planet-forming disks,” says astronomer Ilse Cleeves in our feature Space Physics and Aeronomy Jingnan Guo
article. Hörst found this synergy with ALMA (Atacama Large Millimeter/submillimeter Array) History of Geophysics Kristine C. Harper
especially intriguing: “Although I’ve thought a lot about what we’ll learn about individual plan- Planetary Sciences Sarah M. Hörst
Volcanology, Geochemistry, and Petrology Emily R. Johnson
ets, I hadn’t really thought much about what we’ll be able to learn about planet formation pro- Mineral and Rock Physics Shun-ichiro Karato
cess by studying the disks themselves.” Societal Impacts and Policy Sciences Christine Kirchhoff
In “The Forecast for Exoplanets Is Cloudy but Bright,” on page 34, we learn the immense chal- Seismology Ved Lekic
Tectonophysics Jian Lin
lenge posed by exoplanet atmospheres, when researchers are still struggling to understand the
Near-Surface Geophysics Juan Lorenzo
complex dynamics of clouds on our own planet. And in “Exoplanets in the Shadows” on page 20, Earth and Space Science Informatics Kirk Martinez
we look at the rogues, the extremes, and a new field being coined as necroplanetology. Ocean Sciences Jerry L. Miller
Study of the Earth’s Deep Interior Rita Parai
What awaits us when the first science results start coming in from JWST and all the coordi-
Education Eric M. Riggs
nated missions next year? “I’m really excited for the unexpected,” says Hörst. “I’m excited for Global Environmental Change Hansi Singh
all the ‘well, that’s weird’ moments. Those are my favorite things in science because that’s when Hydrology Kerstin Stahl
you know that new discoveries are going to be made. I’m also really happy for all of my colleagues Paleoceanography and Paleoclimatology Kaustubh Thirumalai
Nonlinear Geophysics Adrian Tuck
who have worked so tirelessly for so many years to make JWST happen.” Biogeosciences Merritt Turetsky
We’re pretty happy, too, for the scientists long awaiting this day and for the rest of us who Hydrology Adam S. Ward
eagerly await a wide new window on our mysterious universe. Diversity and Inclusion Lisa D. White
Earth and Planetary Surface Processes Andrew C. Wilcox
©2021. AGU. All Rights Reserved. Material in this issue may be photocopied by
individual scientists for research or classroom use. Permission is also granted to use
short quotes, figures, and tables for publication in scientific books and journals. For
permission for any other uses, contact the AGU Publications Office.
Eos (ISSN 0096-3941) is published monthly except December by AGU, 2000 Florida
Ave., NW, Washington, DC 20009, USA. Periodical Class postage paid at Washington,
D.C., and at additional mailing offices. POSTMASTER: Send address changes to
Heather Goss, Editor in Chief Member Service Center, 2000 Florida Ave., NW, Washington, DC 20009, USA
Member Service Center: 8:00 a.m.–6:00 p.m. Eastern time; Tel: +1-202-462-6900;
Fax: +1-202-328-0566; Tel. orders in U.S.: 1-800-966-2481; service@agu.org.
Submit your article proposal or suggest a news story to Eos at bit.ly/Eos-proposal.
Views expressed in this publication do not necessarily reflect official positions
of AGU unless expressly stated.
Randy Fiser, Executive Director/CEO
SCIENCE NEWS BY AGU // Eos.org 1
CONTENT
26
20 34
Features
20 Exoplanets in the Shadows 26 Overture to Exoplanets
By Damond Benningfield By Kimberly M. S. Cartier
The universe is full of wonderful weirdness, and we’re Who is in the front row to get a glimpse of what the
only just starting to find it. James Webb Space Telescope will show us?
On the Cover 34 The Forecast for Exoplanets
The seven small, potentially rocky worlds of the TRAPPIST-1 Is Cloudy but Bright
system orbit an M dwarf star, shown in an artist’s rendering.
By Kate Evans
Credit: NASA/JPL-Caltech
We can see 159 light years away, but how do we get
through the final few miles?
2 Eos // AUGUST 2021
CONTENT

                                                      12                                                                                15

                                                      13                                                                                 51
Columns

From the Editor                                                             AGU News
  1 Unveiling the Next Exoplanet Act                                            41 In Appreciation of AGU’s Outstanding Reviewers
                                                                                   of 2020
News
  5 Gaps in Exoplanet Sizes Shift with Age
                                                                            Research Spotlight
  6 Chasing Magma Around Iceland’s Reykjanes Peninsula                          51 South Pole Ice Core Reveals History of Antarctic Sea Ice |
  8 Vestiges of a Volcanic Arc Hidden Within Chicxulub                             Carbonate Standards Ensure Better Paleothermometers
    Crater                                                                      52 ‘Oumuamua May Be an Icy Fragment of a Pluto-Like
  9 Indian Cities Prepare for Floods with Predictive                               Exoplanet | A 50,000-Year History of Current Flow Yields
    Technology                                                                     New Climate Clues
  11 Climate Clues from One of the Rainiest Places on Earth
 12 Studying Arctic Fjords with Crowdsourced Science                        Editors’ Highlights
    and Sailboats
                                                                                53 Dune Aurora Explained by Combined Satellite–Ground
 13 A New Tool May Make Geological Microscopy Data
                                                                                   Observations | Urban Vegetation a Key Regulator for Heat
    More Accessible
                                                                                   Island Intensity
 15 Forecasters Navigate a Highway to Success Around Lake
    Victoria
                                                                            Positions Available
Opinion                                                                         54 Current job openings in the Earth and space sciences

 17 “Earth Cousins” Are New Targets for Planetary Materials
    Research
                                                                            Crossword Puzzle
                                                                                56 Distant Wanderers

   AmericanGeophysicalUnion   @AGU_Eos     company/american-geophysical-union       AGUvideos      americangeophysicalunion    americangeophysicalunion

                                                                                                                SCIENCE NEWS BY AGU // Eos.org       3

NEWS
Gaps in Exoplanet Sizes Shift with Age
T
wenty-six years ago, astronomers dis-
covered the first planet orbiting a dis-
tant S un-like star. Today thousands
of exoplanets are known to inhabit our local
swath of the Milky Way, and that deluge of
data has inadvertently revealed a cosmic mys-
tery: Planets just a bit larger than Earth appear
to be relatively rare in the exoplanet canon.
A team has now used observations of hun-
dreds of exoplanets to show that this plane-
tary gap isn’t static but instead evolves with
planet age—younger planetary systems are
more likely to be missing slightly smaller
planets, and older systems are more apt to be
without slightly larger planets. This evolution
is consistent with the hypothesis that atmo-
spheric loss—literally, a planet’s atmosphere
blowing away over time—is responsible for
this so-called “radius valley,” the researchers
suggested.
Changes with Age
In 2017, scientists reported the first confident
detection of the radius valley (bit. l y/gap
-radius). (Four years earlier, a different team
had published a tentative detection; bit.ly/
tentative-detection.) Defined as a relative
paucity of exoplanets roughly 50%–100%
larger than Earth, the radius valley is readily determine the planets’ ages, which they A Moving Valley
apparent when looking at histograms of assessed indirectly by estimating the ages When David and his collaborators looked
planet size, said Julia Venturini, an astro- of their host stars. (Because it takes just a few at the distribution of planet sizes in each
physicist at the International Space Science million years for planets to form around a star, group, they indeed found a shift in the radius
Institute in Bern, Switzerland, not involved these objects, astronomically speaking, have valley: Planets within it tended to be about
in the new research. “There’s a depletion of very nearly the same ages.) 5% smaller, on average, in younger planetary
planets at about 1.7 Earth radii.” systems compared with older planetary sys-
Trevor David, an astrophysicist at the Flat- tems. It wasn’t wholly surprising to find this
iron Institute in New York, and his colleagues evolution, but it was unexpected that it per-
were curious to know whether the location of “There’s a depletion of planets sisted over such long timescales [billions of
the radius valley—that is, the planetary size years], said David. “What was surprising was
range it encompasses—evolves with planet
at about 1.7 Earth radii.” how long this evolution seems to be.”
age. That’s an important question, said David, These findings are consistent with planets
because finding evolution in the radius valley losing their atmospheres over time, David
could shed light on its cause or causes. It’s and his colleagues proposed. The idea is that
been proposed that some planets lose their The team calculated planet ages ranging most planets develop atmospheres early on
atmospheres over time, which causes them from about 500 million years to 12 billion but then lose them, effectively shrinking in
to change size. If the timescale over which the years, but “age is one of those parameters size from just below Neptune’s (roughly
radius valley evolves matches the timescale that’s very difficult to determine for most 4 times Earth’s radius) to just above Earth’s.
of atmospheric loss, it might be possible to stars,” David said. That’s because estimates “We’re inferring that some sub-Neptunes are
pin down that process as the explanation, of stars’ ages rely on theoretical models of being converted to s uper-Earths through
said David. how stars evolve, and those models aren’t atmospheric loss,” said David. As time goes
In a new study published in the Astronomical perfect when it comes to individual stars, he on, larger planets lose their atmospheres,
Journal, the researchers analyzed planets orig- said. For that reason, the researchers decided which explains the evolution of the radius
inally discovered using the Kepler Space Tele- to base most of their analyses on a coarse valley, the researchers suggested.
iStock.com/oorka
scope (bit.ly/exoplanet-size-distribution). division of their sample into two age groups,
They focused on a sample of roughly 1,400 one corresponding to stars younger than a Kicking Away Atmospheres
planets whose host stars had been observed few billion years and one encompassing stars Atmospheric loss can occur via several mech-
spectroscopically. Their first task was to older than about 2–3 billion years. anisms, scientists believe, but two in partic-
SCIENCE NEWS BY AGU // Eos.org 5
NEWS
ular are believed to be relatively common.
Both involve energy being transferred into a
Chasing Magma Around Iceland’s
planet’s atmosphere to the point that it can
heat to thousands of degrees kelvin. That
Reykjanes Peninsula
input of energy gives the atoms and mole-
cules within an atmosphere a literal kick, and
some of them, particularly lighter species like
hydrogen, can escape.
“You can boil the atmosphere of a planet,”
said Akash Gupta, a planetary scientist at the
University of California, Los Angeles not
involved in the research.
In the first mechanism—photoevapora-
tion—the energy is provided by X -ray and
ultraviolet photons emitted by a planet’s host
star. In the second mechanism—core cool-
ing—the source of the energy is the planet
itself. An assembling planet is formed from
successive collisions of rocky objects, and all
“Age is one of those parameters
that’s very difficult to determine
for most stars.”
of those collisions deposit energy into the
forming planet. Over time, planets reradiate
that energy, some of which makes its way into
their atmospheres.
Theoretical studies have predicted that Icelandic Meteorological Office seismologist Kristín Jónsdóttir stands on solidified black basalt that glows red
photoevaporation functions over relatively from erupting Fagradalsfjall volcano behind her. Credit: Kristín Jónsdóttir
short timescales—about 100 million
years—while core cooling persists over bil-
lions of years. But concluding that core
I
cooling is responsible for the evolution in n December 2019, Reykjanes Peninsula, Soon thereafter, the Icelandic Meteorolog-
the radius valley would be premature, said which juts into the Atlantic Ocean south- ical Office’s seismic network recorded more
David, because some researchers have sug- west of Iceland’s capital city of Reyk- than 50,000 earthquakes on the peninsula.
gested that photoevaporation can also act javík, began experiencing intense seismic Using the monitoring tools at their disposal,
over billions of years in some cases. It’s swarms. Since then, scientists at the Icelandic scientists found a corridor of magma between
hard to pinpoint which is more likely at Meteorological Office have been tracking and Keilir and Fagradalsfjall, said Barsotti. This
play, said David. “We can’t rule out either monitoring deformation of Earth’s surface as magma flowed underground for approxi-
the photoevaporation or c ore-powered magma intruded into the shallow crust. Three mately 3 weeks, with earthquakes defining
mass loss theories.” initial intrusions occurred near Mount Thor- the edges of the subterranean chamber. Then
It’s also a possibility that the radius valley björn, just outside the town of Grindavík. A both seismicity and deformation plummeted.
arises because of how planets form, not how fourth slightly inflated the peninsula’s west- At that point, some scientists hypothesized
they evolve. In the future, David and his col- ernmost tip, and a fifth leapfrogged back east, that the intrusion would freeze within the
leagues plan to study extremely young plan- beyond Grindavík, to Krýsuvík, according crust, said Kristín Jónsdóttir, a seismologist at
ets, those only about 10 million years old. to Sara Barsotti, an Italian volcanologist and the Icelandic Meteorological Office. “Then,”
These youngsters of the universe should pre- coordinator for volcanic hazards at the Ice- she said, “the eruption started.”
serve more information about their forma- landic Meteorological Office.
tion, the researchers hope. More than a year after this unrest began, Keeping Crowds Safe
on 24 February 2021, a large earthquake mea- On 19 March, lava began to erupt from the
suring magnitude 5.7 jolted the peninsula edge of the intrusion near Fagradalsfjall, and
By Katherine Kornei (@KatherineKornei), between Keilir and Fagradalsfjall volcanoes, Icelanders flocked to the mountains above
Science Writer “marking a turning point,” Barsotti said. the fissure to picnic, play football, or simply
6 Eos // AUGUST 2021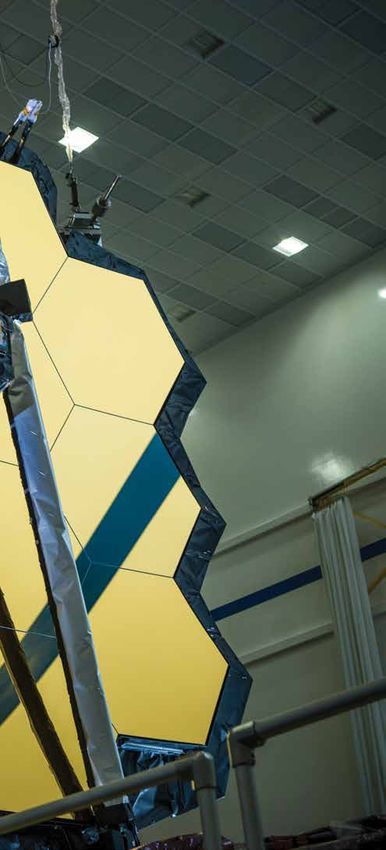
NEWS
Against a gray sky, orange lava pours and pops out of Fagradalsfjall on the second day of the eruption. In the foreground, cooling lava glows against the black basalt that’s
already solidified. Credit: Toby Elliott/Unsplash
observe nature’s lava light show. “Iceland- DAS, to monitor seismicity near Mount Thor- coauthor and a geophysicist at Helmholtz
ers…feel this is part of their life,” said Bar- björn. In April, Sebastian Heimann, a scien- Centre Potsdam, describing previous work
sotti. “They really want to enjoy what their tist at Helmholtz Centre Potsdam in Ger- using the same cable near Mount Thorbjörn
country is capable [of giving] them.” many, presented the latest results from (bit.ly/i maging-cables). In that study, Jous-
Because crowds continue to visit the erup- the ongoing study at the 2021 Annual Meet- set and his colleagues, including Blanck,
tion, the Icelandic Meteorological Office ing of the Seismological Society of America. compared the catalog of earthquakes
meets daily with Iceland’s Department of At a molecular level, DAS works because recorded by both DAS and traditional seis-
Civil Protection and Emergency Management f iber-optic cables contain impurities, mic stations.
to ensure the safety of volcano watchers, Bar- explained Hanna Blanck, one of Heimann’s “Propagating magma increases the pres-
sotti explained. A rescue team is always pres- coauthors and a doctoral student at the Uni- sure in the surrounding crust, causing many
ent, and they use handheld sensors to detect versity of Iceland. A laser pulse sent through small earthquakes,” said Blanck. More data
gases that could be dangerous. a cable will encounter these impurities, she mean detecting more small earthquakes,
“The big challenge,” Barsotti said, is “[fore- said. When that happens, the light scatters, which should yield a better picture of magma
seeing] the opening of new vents.” What and a small portion returns toward the laser movement.
began as a single vent now boasts a fissure source. By continuously measuring the However, “[DAS] is still in its research
swarm, cones, and lava fields. “People should returning signal, scientists can look for phase,” said Jónsdóttir, “so it’s not being
be [able] to go, but [we must keep] them far changes that indicate the cable has moved. routinely used by monitoring agencies.” In
away from what we consider to be hazardous.” Earthquakes have distinct signatures that the future, she said, it will likely comple-
The Icelandic Meteorological Office keeps help differentiate them from, for example, ment more established methods in seismol-
vigil over this volcano with a variety of tech- the rumble of a passing car. ogy.
niques. For example, InSAR (interferometric DAS provides several advantages to tradi- Nevertheless, seismologists and volcanol-
synthetic aperture radar), a satellite-based tional seismic networks, including higher ogists often investigate secrets of Earth that
method, allows scientists to measure differ- spatial resolution, said Blanck. Traditional cannot be seen, Jónsdóttir said, so holding a
ences in topography at centimeter scale. GPS seismic networks are spaced kilometers apart, freshly formed piece of basalt as lava spews
stations help track how the ground itself whereas the spatial resolution Heimann used in the background—after hypothesizing the
moves. Passive satellite imagery can trace the along the 21-kilometer-long cable was a scant existence of an intrusion in that very loca-
progress of toxic clouds, like sulfur dioxide. 4 meters. tion—provides incredible validation.
“We caught more small earthquakes
Seismic Monitoring of the Future compared to the conventional methods
Geoscientists from across Europe have been [likely because] we have many more records By Alka Tripathy-Lang (@DrAlkaTrip), Science
exploring distributed acoustic sensing, or along the fiber,” said Philippe Jousset, a Writer
SCIENCE NEWS BY AGU // Eos.org 7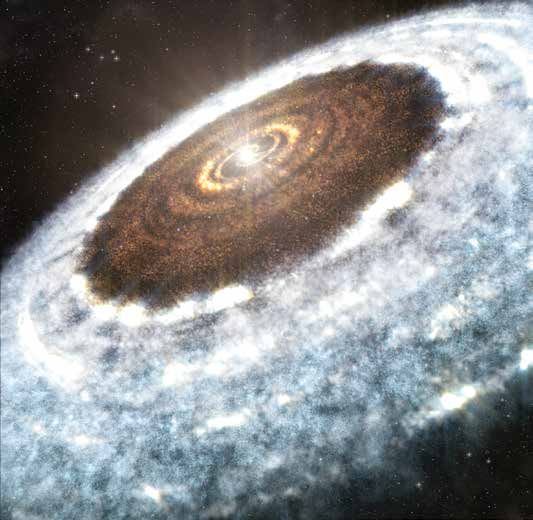
NEWS
Vestiges of a Volcanic Arc Hidden
Within Chicxulub Crater
A
bout 66 million years ago, an asteroid core includes 600
hurtled through Earth’s atmosphere meters of the peak
at approximately 20 kilometers per ring, said Gulick,
second—nearly 100 times the speed of who serves as co–
sound—and slammed into water and lime- chief scientist of
stone off Mexico’s Yucatán Peninsula, cata- Expedition 364.
lyzing the demise of the dinosaurs. The In a recent study
solid rock hit by the asteroid momentarily published in the
behaved like a liquid, said University of Texas Geological Society
at Austin geophysicist Sean Gulick. Almost of America Bulletin,
instantaneously, a massive transient crater Catherine Ross, a
extended to the mantle, and rocks from doctoral student
10 kilometers deep rushed to the sides of the at the University
hole. They slid back toward the crater’s cen- of Texas at Austin;
ter and shot 20 kilometers into the air before Gulick; and their
collapsing outward again. As the rock flowed coauthors deter-
outward, it regained its strength and formed mined the age
a peak ring, resulting in mountains encir- of the peak ring
cling the center of the 200-kilometer-wide granites—334 mil-
Chicxulub crater. lion years old—
and unraveled an
unexpected history
of arc magmatism
The story of these rocks “turned and superconti-
nent reconstruc-
out to be completely separate t i o n (b i t .l y / a r c
from the story of the impact -m a g m a ) . T h e
crater.” story of these
rocks, said Gulick,
“turned out to be
completely sepa-
rate from the story
In 2016, at a cost of $10 million, scientists of the impact cra- (a) The amalgamation of Pangea. Laurentia, in brown, lies to the north. Gondwana,
participating in International Ocean Discov- ter.” The tale is shown in gray, lies to the south. Numerous terranes, shown in purple, were caught
ery Program Expedition 364, in collaboration told by tiny crys- between the ancient continents of Laurentia and Gondwana. The Yucatán lies in
with the International Continental Scientific tals of zircon— the midst of these terranes, and a pink star indicates the Chicxulub impact site.
Drilling Program, extracted an 835-meter- small clocks within CA = Colombian Andes; Coa = Coahuila; M = Merida terrane; Mx = Mixteca; Oax =
long drill core from the Chicxulub crater. The rocks—that record Oaxaquia; SM = Southern Maya. (b) A simplified cross section through Laurentia,
various chapters of the Rheic Ocean, and subduction off the edge of the Yucatán crust. The Rheic
Earth’s history. Ocean must subduct below the Yucatán to create the arc magmatism responsible
for the zircons Ross analyzed. Ga = giga-annum; Ma = mega-annum. Credit: Ross
Getting Past a et al., 2021, https://doi.org/10.1130/B35831.1
Shocking Impact
As a melt solidifies,
said Ross, zirco-
nium, oxygen, and silicon atoms find each The drill core granites, however, harbor an
other to form zircon. Trace atoms of radioac- incredible amount of damage caused by the
tive uranium easily swap places with zirco- impact’s shock wave. “The energy of Chic
nium while excluding lead (the product of xulub is equivalent to 10 billion times the size
uranium decay). By measuring both uranium of a World War II era nuclear bomb,” said
and lead, geochronologists like Ross can cal- Gulick. Highly damaged zircons from the
culate when lead began to accumulate in the peak ring yield the impact age, he said, but
Zircons, like this one with laser ablation points, crystal. In zircons of granitoids, this date typ- “once you go below those highest shocked
record the storied history of the Chicxulub crater. ically records when the grain crystallized from grains, you more faithfully record the original
Credit: Catherine H. Ross the melt. age and not the impact age.”
8 Eos // AUGUST 2021NEWS
The zircons that Ross and colleagues tar-
geted lacked microstructures that indicate
Indian Cities Prepare for Floods
shock, said Maree McGregor, a planetary sci-
entist at the University of New Brunswick
with Predictive Technology
who was not involved in this study. “A lot of
people would overlook this material when
they’re trying to understand impact crater-
ing,” she said, because past studies focused
heavily on the impact age and not the history
of the target rocks.
Ross incrementally bored into 835 individ-
ual zircons with a laser, measuring age as a
function of depth to differentiate age domains.
“Being able to visualize the data and separate
[them] in that way is…critical when you’re
trying to establish different ages for different
regional tectonic events,” said McGregor.
“The energy of Chicxulub is
equivalent to 10 billion times the
size of a World War II era
nuclear bomb.”
Chennai, India, was pummeled by more than 483 millimeters (19 inches) of rain in a single day in 2015. Credit:
Ancient Ocean, Volcanic Arc Veethika, Wikimedia, CC BY-SA 4.0 (bit.ly/ccbysa4-0)
In addition to the 334-million-year-old Car-
boniferous zircons, Ross found three older
populations. Crystals with ages ranging from
U
1.3 billion to 1 billion years ago fingerprint rban floods in India have caused fatal- upstream region; river, tidal, and storm surge
the formation of the supercontinent Rodinia. ities, injuries, displacement, and modeling; and a high-resolution digital ele-
After Rodinia fragmented, 550-million-year- enormous economic losses. Cities vation map of the city, Ghosh said.
old zircons place the Yucatán crust near the across the country are now investing in high- A consortium of scientists from 13 research
mountainous margins of the West African tech tools to better model and forecast these institutes and government organizations
craton, which was part of the supercontinent natural hazards. worked on these separate aspects and
Gondwana. Zircons between 500 million and In 2015, the metropolis of Chennai faced together developed India’s first fully auto-
400 million years old document deformation devastating floods responsible for the deaths mated r eal-time flood forecasting system,
as these crustal bits moved across the ancient of more than 500 people and displacement of launched in 2019.
Rheic Ocean toward Laurentia, which today more than a million more. Financial losses “We generated 800 scenarios of flood and
corresponds to the North American conti- reached around $3 billion. The extent of the tide conditions,” Ghosh said. “When the
nental core, Ross said. damage prompted the Indian government to model receives a weather forecast from the
As the Rheic oceanic slab subducted, fluids approach scientists to develop a flood fore- National Centre for Medium Range Weather
drove partial melting that powered a volcanic casting system for the city. Forecasting, it will search and find the closest
arc on the edge of the Yucatán crust, said Subimal Ghosh, a professor of civil engi- scenario. If there is a chance of flood, the
Ross. Using trace element geochemistry from neering at the Indian Institute of Technology model will predict the vulnerable sites for the
individual grains, she found that in spite of Bombay, led the efforts. Chennai’s topogra- next 3 days.”
their tumultuous impact history, Carbonifer- phy makes it particularly vulnerable, Ghosh Sisir Kumar Dash is a scientist at the
ous zircons preserve volcanic arc signatures. said. In addition to being a coastal city, Chen- National Centre for Coastal Research (NCCR)
This research, said coauthor and geo nai has many rivers and an upstream catch- in Chennai, which is responsible for the oper-
chronologist Daniel Stockli, is very tedious ment area from which water flows when there ation of the model. “We analyze daily rainfall
micrometer-by-micrometer work. But ulti- is heavy rainfall. data, and if there is a probability of inunda-
mately, he said, these finely detailed data illu- tion, the model is run and alerts are sent to
minate processes at the scale of plate tectonics. Forecasting in Chennai the state disaster management department,”
The city’s topography determines where he said.
inundation occurs and made the development Since the tool was implemented, however,
By Alka Tripathy-Lang (@DrAlkaTrip), Science of a flood forecasting system complex. The Chennai has not experienced heavy rainfall,
Writer system had to include the hydrology of the so it has not been put to a strong test.
SCIENCE NEWS BY AGU // Eos.org 9NEWS
Forecasting in Bengaluru World Resources Institute who was not The tool also has a mobile application,
Bengaluru, formerly known as Bangalore, has involved in flood forecasting in Chennai Bengaluru Megha Sandesha (BMS),
seen some success with its own flood fore- or Bengaluru. He had a sober view of the which can be accessed by officials and resi-
casting system, according to scientists at the projects. “A good model is not about the tech dents for r eal-time information about
Indian Institute of Science (IISc) in Bengaluru or visualization that come with it,” he said. rainfall and flooding.
and the Karnataka State Natural Disaster Instead, it’s “about the ability to help in the Mujumdar added that “short-duration,
Monitoring Centre. The organizations devel- decisionmaking process, which hasn’t h igh-intensity floods are increasing in
oped the system together. been successfully demonstrated in India.” Indian cities and happen very quickly—
P. Mujumdar, a professor of civil engineer- Shubha Avinash, scientific officer at within 1 5–20 minutes—due to climate
ing at IISc who led the work, said that “short- the Karnataka State Natural Disaster Moni- change and urbanization. Similar models
d uration rainfall forecasts from various toring Centre, said the forecasting model was should be developed for all cities.”
weather agencies were combined with our still an effective tool: “The forecast model has Last year, India’s Ministry of Earth Sci-
hydrology model—which has h igh-resolution served as a better decision support system for ences developed a flood warning sys-
digital elevation maps of the city—and infor- administrative authorities in disaster pre- tem for the Mumbai region, i FLOWS-
mation on drainage systems and lakes.” paredness, postflood recovery, and response Mumbai, which is likely to be operational this
R eal-time rainfall data are obtained actions in heavy rain events faced by the year.
through a network of 100 automatic rain city in recent years.” Avinash oversees the “Cities need to have a proper road map,”
gauges and 25 water level sensors set operation of the Bengaluru flood model. Bhagat said, “with not just the model
up on storm water drains at various flood- Avinash added that the alerts help city as the target but an integrated response
v ulnerable areas across Bengaluru. The officials take timely, location-specific action. plan (both short term and long term).
model, however, is unable to make reliable For instance, the city power company (Ban- It should start with the creation and seam-
predictions if the rainfall is sudden and didn’t galore Electricity Supply Company Lim- less sharing of related data in the public
appear in the forecast, Mujumdar added. ited, or B ESCOM) makes use of the wind domain.”
speed and direction forecasts to ascer-
Scaling Up tain which areas would have a probability
Raj Bhagat Palanichamy is a senior manager of fallen electric lines and shuts down power By Deepa Padmanaban (@deepa_padma),
at the Sustainable Cities initiative of the supply to ensure safety. Science Writer
10 Eos // AUGUST 2021NEWS
Climate Clues from One of the Rainiest Places on Earth
Alejandro Jaramillo, a hydrologist at the
Center for Atmospheric Sciences at the
National Autonomous University of Mexico,
said that more observations will allow for a
better model, which will lead to better pre-
diction of rainfall and major weather events,
like hurricanes. Jaramillo was not involved in
the new research.
“If you better understand the processes
that are causing this high rainfall, you can
find better ways for climate models to fill in
the gaps where there [aren’t] hard data,”
Jaramillo said.
The Pacific Ocean off the coast of Nuquí, Chocó, Colombia, is one of the rainiest spots on Earth. Credit: Andreas
Philipp, CC BY-NC-ND 2.0 (bit.ly/ccbyncnd2-0) Impacts Beyond Climate
According to Germán Poveda, a coauthor on
the recent study and a professor at the
National University of Colombia, the project
A
jet stream known as the Chocó low- not only aimed to understand the dynamics
level jet (the ChocoJet) connects the and thermodynamics that explain the rainiest
Pacific Ocean with western Colombia. region on Earth but also was an opportunity to
It helps dump more than 9,000 millimeters train Colombia’s next generation of climate
of rain each year, making the area offshore of scientists.
the Colombian town of Nuquí one of the rain- Juliana Valencia Betancur, for instance, was
iest places on the planet. an undergraduate environmental engineer-
“The ChocoJet—this low-level flow—is a ing student at Colegio Mayor de Antioquia in
physical bridge between the sea surface tem- Medellín during the Nuquí field campaign.
peratures and sources of moisture in the She and a half dozen other undergraduate
Pacific, and the climate patterns of western students helped prepare and launch balloons
South America,” said John Mejia, an associate as part of their undergraduate research expe-
research professor of climatology at Nevada’s rience.
Desert Research Institute and lead author of “I hadn’t had much interest in atmospheric
a new paper on the phenomenon. science, but after Nuquí, with all the marvel-
In addition to its regional impact, the ous things I learned, my outlook changed
ChocoJet plays a role in the El Niño–Southern completely, and my professional career
Oscillation (ENSO), a climate pattern whose changed course,” she said, adding that she is
variations can signal droughts and floods for Students from Institución Educativa Ecoturistica Lito- now looking for graduate opportunities in
Colombian farmers. ENSO also has significant ral Pacifico in Nuquí prepare to launch a sonde bal- atmospheric science.
impacts on Europe, Africa, Asia, and North loon during the fieldwork campaign. Credit: Organi- Johanna Yepes, a coauthor and researcher
America. zation of Tropical East Pacific Convection (OTREC) based at Colegio Mayor de Antioquia, said that
“In the atmosphere, we are all connected,” participants/John Mejia Nuquí’s local schoolchildren also benefited
Mejia said, and the ChocoJet “is part of the from the project’s outreach activities. During
engine that redistributes the heat from the the field campaign, the researchers visited
tropics to higher latitudes.” Nuquí’s only school and, with enthusiastic
standing of the dynamics and thermodynam- support of the principal, presented their proj-
Rainy Puzzle ics of the ChocoJet’s processes, which have ect to students in the fourth to seventh
In 2019, after 6 months of preparations, Mejia implications for regional wildlife and agricul- grades. The students were also invited to visit
and his team were able to get enough helium ture, as well as for natural hazards. Mejia said the launch site and got a chance to launch a
tanks and sonde balloons to this remote region, the main contribution of the field campaign sonde balloon themselves.
which is accessible by only sea or air. They in Nuquí and the resulting data was to find out “For me, it was the most beautiful part, put-
launched the balloons up to four times a day why and how these precipitation mechanisms ting what we were doing in very simple words
over 51 days, resulting in new data on tempera- produce one of the rainiest places on Earth, and seeing how the children understood the
ture, winds, and other atmospheric conditions. with the added benefit of building on the very daytime cycle of rain, sometimes even better
They detailed their findings in a recent scant climate data gathered previously. “This than we did ourselves,” Yepes said.
paper published in the Journal of Geophysical is a field experiment that can help test cli-
Research: Atmospheres (bit.ly/rainy-chocojet). mate models…. Figuring this out can make
The new data contribute to a better under- global models more accurate,” Mejia said. By Andrew J. Wight (@ligaze), Science Writer
SCIENCE NEWS BY AGU // Eos.org 11NEWS
Studying Arctic Fjords with Crowdsourced Science
and Sailboats
I
n June 2017, Nicolas Peissel led the 1 3-meter
sailboat Exiles out of port in St. John’s, New-
foundland and Labrador, Canada. The ves-
sel sailed north to Greenland and into the
remnants of Tropical Storm Cindy. Peissel and
several other crew members are aid workers
for Doctors Without Borders, but they were
on a 3
-month scientific—not medical—expe-
dition aboard Exiles.
The expedition explored the feasibility of
crowdsourced science using sailboats to
expand data collection in fjords affected by the
melting Greenland Ice Sheet. Daniel Carlson,
“Scientific work was
historically, and should
continue to be, undertaken
by members of the general
public.” Exiles, whose crew collected data on fjords in the Arctic, anchors near a receding glacier in 2017. Credit: Daniel
Carlson
an oceanographer at Germany’s H elmholtz-
entrum Hereon and science officer for the
Z boats also require much less fuel, lessening the their affordability and versatility and would
expedition, sailed on Exiles for a month. After environmental impact of Arctic research. like to see more people with sailboats taking
he left, the crew of nonscientists continued Together, the Exiles crew took 147 CTD part in research. “It’s not like you can just
collecting data. The expedition log and pre- measurements. Carlson also took aerial pho- make your own thing—you need the instru-
liminary results were published in Frontiers in tographs of icebergs with a drone to estimate ments—but I think there would be interest
Marine Science (bit.ly/arctic-sailing). the rate at which they melt. He said this from citizen scientists,” Bouchard said.
The melting ice in Greenland is increasing wouldn’t have been possible on a research Although it takes experienced sailors to
the amount of fresh water in fjords, which cruise with tight schedules and timelines. navigate in the Arctic, more sailboats than
changes the salinity and mixing of ocean ever have been heading north, which could
water. Scientists don’t fully know what Crowdsourcing Science in the Arctic bring new opportunities for amateur scien-
impact these changes will have on the marine Carlson collected m uch-needed data on tists. Peissel said that sailors in the Arctic
ecosystem. changes occurring in fjords as a result of melt- usually have an intense connection to the sea
To study what contributes meltwater to the ing ice. The expedition also demonstrated that and nature. “These are the people who are
ocean, scientists measure the conductivity, crowdsourced science is a viable option for more than likely to say, ‘Hey, why don’t you
temperature, and depth (CTD) of the water expanding Arctic oceanography research. put your instruments on board?’”
column, but reaching these remote fjords to “We were extremely happy that we could Following their study’s success, Carlson and
take measurements on research ships is collaborate with a professional scientist in a Peissel are planning another expedition to the
expensive and treacherous. Ships also often scientific institution,” said Peissel, who is a Arctic in 2022. “The scientific discipline, just
carry several research teams with conflicting coauthor on the paper. “But we also wanted like humanitarianism, does not uniquely
experimental needs and schedules. These to be the citizens that could produce raw, reli- belong to the scientist or the humanitarian,”
limitations leave gaps in our understanding able scientific data, and we proved that.” The Peissel said. “Scientific work was historically,
of the changing Arctic waters. crew took 98 CTD measurements after Carl- and should continue to be, undertaken by
“Since you’re spending so much money on son left. members of the general public.”
a research cruise, there’s usually a push to visit Caroline Bouchard, a fisheries scientist at
as many fjords as possible,” Carlson said, “but the Greenland Institute of Natural Resources
with the sailboat, you’re able to just stop and who wasn’t involved in the study, also uses By Andrew Chapman (@andrew7chapman),
investigate things you find interesting.” Sail- sailboats for Arctic research. She appreciates Science Writer
12 Eos // AUGUST 2021NEWS
A New Tool May Make Geological Microscopy Data
More Accessible
I
t all started with a problem many geosci- A technical report on the device, named The software also does not replicate all the
entists faced in 2020. iAutoStage, was recently published in Geo-
P different functions of a microscope, Rooney
Alex Steiner, a doctoral student at Mich- chemistry, Geophysics, Geosystems (bit .ly/pi said. “You don’t have the ability to use a lot of
igan State University, had research to do work- -auto-stage). the advanced tools that are in a microscope that
ing on thin sections—slivers of geological Because thin sections are also commonly help students identify ambiguous crystals.”
materials that are usually analyzed under a used for instruction in geoscience lab courses, Despite these limitations, “from the per-
microscope. But he and the two undergraduate PiAutoStage could also provide instructors a spective of a broad teaching tool, we think it’s
students on the project were not allowed to new, affordable resource to digitize and use useful and in fact is different to a micro-
access the lab or the geological samples they specimens and literary materials they already scope,” Rooney added. “Previously, students
were working on because of the pandemic. have curated in their curriculum. would not have actually been able to see the
It was out of this necessity that Steiner “I think this is a really nice approach to entire area of a microscope slide in a pan-
helped develop a new tool that could automat- a problem that I heard a lot of people talking oramic image.”
ically take pictures of entire thin sections and about last year when everything moved
stitch them into digital panoramic microscope online,” said Anita Marshall, a geologist at
images that could be analyzed anywhere. the University of Florida who was not
involved in the study. “Anybody that had any “In a postpandemic world,
sort of microscope work in their courses really
struggled to move that work online.”
devices like this could still be
used for teaching. It allows
Getting Microscopy Online students to have access to
iAutoStage consists of an o
P pen-source mech-
samples, for example, that
anism that moves the sample around the
microscope, attached to a high-resolution
might be very valuable and can’t
integrated camera and an inexpensive Rasp- be left in the lab, or there aren’t
berry Pi computer. The researchers wrote enough thin sections for an
computer code to take hundreds of high-
entire group.”
resolution images of an entire microscope
sample and combine them into a single pan-
orama.
This technique allowed two undergraduate
students—one at Michigan State University More Accessible Geoscience
in East Lansing and another at Wayne State “In a postpandemic world, devices like this
University in Detroit—to work collaboratively could still be used for teaching,” Rooney said.
on the same project at the same time using PiAutoStage “allows students to have access
the same thin sections of a flood basalt to samples, for example, that might be very
sequence, said Tyrone Rooney, a geologist at valuable and can’t be left in the lab, or there
Michigan State University and senior author aren’t enough thin sections for an entire
of the paper. group.”
And for the most part, the students enjoyed Although resources that can image micro-
working with the microscope images online, scope samples already exist, they are often
Steiner said. “Because the interface behaves prohibitively expensive: Microscopes with
the same way as things like Google Earth or built-in or add-on cameras can cost tens of
things like that. It’s just zoom in, zoom out, thousands of dollars.
click and drag around. So they picked it up By contrast, because the P iAutoStage
real quick. I don’t think anyone had any com- mechanism is entirely 3D printed, it would
plaints, even with the very first lab we ran cost less than $200 to make the device, said
These image mosaics of a fragment of Earth’s man- this year. Steiner, who was lead author of the report.
tle were collected in optical arrangements with the One downside to long-distance micros- “You don’t have to order the parts from any-
PiAutoStage: (a) plane-polarized light, (b) cross- copy, however, is its difficulty in replicating body or anything like that. You can liter-
polarized light, and (c) c ross-polarized light at 45° of the collegiality that comes with the ability of ally make all of the hardware—it’s all printed
rotation. Three sets of images permit students to “students to be able to shout across [the and assembled, [and] basically, it snaps
examine minerals and rock textures in a way that room] to another student, ‘Hey, what’s together.”
replicates the experience of using a petrographic this?’” said Rooney. The researchers tried to The system is also open source and made
microscope. Credit: Steiner and Rooney, 2021, replicate this interaction by allowing students to be adaptable to almost any microscope.
https://doi.org/10.1029/2021GC009693 to share panorama views with one another. The researchers have set up a PiAutoStage
SCIENCE NEWS BY AGU // Eos.org 13NEWS
A crystal-rich lava from northern Kenya was captured in cross-polarized light. The lava contains abundant, chemically zoned clinopyroxene crystals that record a history of
magma interactions. Credit: Steiner and Rooney, 2021, https://doi.org/10.1029/2021GC009693
website detailing examples, instructions, and when we introduce a new tool, usually data “All the petrologists that have seen what
FAQs to help others build their own device. follows.” this is have also responded with, ‘This is so
The new technique could make future The images produced by PiAutoStage cool.’ In fact, that word seems to be one that
research into thin sections more accessible, have one additional benefit. is used quite an awful lot,” he added.
Rooney said. “With more of these devices “Just looking at the thin section imag-
out there, more innovations will happen sim- ery that I’ve taught with for years in a differ-
ply because more people are trying to use it. ent way, I’ve seen them in a different way,” By Richard J. Sima (@richardsima), Science
I don’t know what will happen. All I can say is, Rooney said. Writer
Read it first on
Articles are published on Eos.org before they appear in the magazine. Visit Eos.org
daily for the latest news and perspectives.
A Life at Sea: A Q&A with Robert Ballard
bit.ly/Eos-Robert-Ballard
Seafloor Seismometers Look for Clues to North Atlantic
Volcanism
bit.ly/Eos-seafloor-seismometers
Planning and Planting Future Forests with Climate
Change in Mind
bit.ly/Eos-future-forests
A Tectonic Shift in Analytics and Computing Is Coming
bit.ly/Eos-analytics-computing
Establishing a Link Between Air Pollution and Dementia
bit.ly/Eos-pollution-dementia-link
Siberian Heat Wave Nearly Impossible Without Human
Influence
bit.ly/Eos-Siberian-heat-wave
14 Eos // AUGUST 2021NEWS
Forecasters Navigate a Highway to Success
Around Lake Victoria
W
ith the sight of a color-coded flag
or the touch of a mobile phone
button, fishers and fish traders
along the vast shores of Lake Victoria now
know when it’s ideal to postpone a fishing
trip or to buy less fish for the day.
Four years of testing an e arly-warning sys-
tem (EWS) to inform fisherfolk in East Africa
of approaching high-impact weather events
on Lake Victoria recently concluded. The High
Impact Weather Lake System (HIGHWAY)
project successfully demonstrated how
improved weather, water, and climate ser-
vices can save lives and livelihoods, as well as
support socioeconomic development of vul-
nerable communities.
In 2017, the H IGHWAY project started
on Lake Victoria, the largest of the African
Great Lakes and the largest inland fishery
on the continent. Lake Victoria’s 7,1 45-
kilometer-long shoreline is shared by Kenya,
Tanzania, and Uganda. Fisheries employ
between 500,000 and a million people A man raises a red flag, signaling severe weather, on the shores of Lake Victoria. Credit: Samuel Gatei/WMO
from those countries as well as from neigh-
boring nations Burundi and Rwanda and har-
vest about a million metric tons of fish every
year. early warnings that improved the lives of on the lake given that not all incidents are
Lake Victoria’s size (it is the world’s communities living in the Lake Victoria reported,” said Paul Oloo, Kisumu County
second-largest freshwater lake, behind only basin,” said Wilson. director of meteorology and assistant director
Lake Superior in North America) allows it to “This early-warning system is a good thing of the Kenya Meteorological Department.
generate its own weather patterns, some- for Lake Victoria, because according to Red
times suddenly and with human and eco- Making the System
nomic casualties. According to its website, As part of the project, the National Meteoro-
HIGHWAY aimed to “enhance the resilience logical and Hydrological Services (NMHSs) of
of African people and economic development
to weather and climate related shocks, with
“Thanks to the strong Kenya, Rwanda, Tanzania, and Uganda coop-
erated in generating regular Lake Victoria
an initial focus on the Lake Victoria Basin.” commitment, partnership, weather forecasts and severe weather warn-
The project was funded by £4.5 million from ings.
the U.K. Department for International Devel-
and collaboration…we HIGHWAY supported the increase in avail-
opment, under Weather and Climate Infor- succeeded in increasing ability of meteorological data and observa-
mation Services for Africa. tions throughout the Lake Victoria basin. Of
“HIGHWAY was an ambitious project that
access to and use of note, the project contributed to the rehabili-
spanned the entire weather and climate ser- codesigned early warnings tation of upper air stations in Lodwar and
vices value chain—improving surface-based Nairobi, Kenya; Entebbe, Uganda; and Dar es
observations, developing products to improve
that improved the lives of Salaam, Tanzania.
forecasting quality, and providing training on communities living in the The project also contributed to the avail-
impact-based forecasts and warnings in the ability of such enhanced tools as h igh-
Lake Victoria basin,” said Jay Wilson, head of Lake Victoria basin.” resolution modeling, as well as products,
the Project Management and Implementation including Rapidly Developing Thunderstorm
Division at the World Meteorological Organi- (which detects, tracks, characterizes, and
zation (WMO). forecasts convective cells) and Convective
“Thanks to the strong commitment, part- Cross statistics, about 5,000 people were dying Rainfall Rate (an algorithm based on the
nership, and collaboration from all interna- annually [due to storms, strong winds, and assumption that high clouds with a large ver-
tional and regional partners, we succeeded in large waves] prior to the year 2016. This figure tical extent are more likely to be raining).
increasing access to and use of co-designed does not include all the deaths that occur Such products improve the accuracy of severe
SCIENCE NEWS BY AGU // Eos.org 15NEWS
mation to plan fishing trips and other jour-
neys on the lake,” said Wilson.
In establishing the regional early-warning
system, standard operating procedures and
impact-based warning methods were devel-
oped jointly by partner states. Representa-
tives from those states joined daily telecon-
ferences so they could agree on severe weather
warning information, but each partner state
disseminated weather advisories in its area of
jurisdiction.
“We receive weather messages on our
phones, and when you get an update, you
send it to other people and put it on your
WhatsApp status so that it can reach many
fishermen,” said Mildred Shihanga, a fish
trader in Kenya.
Saving Lives and Livelihoods
“I think the EWS for Lake Victoria is a very
Fisherfolk are among those most threatened by severe weather on Lake Victoria. Credit: Samuel Gatei/WMO good and important step to protect the lives
and livelihoods of the communities that live
around the lake,” said N airobi-based climate
scientist Abubakr Salih Babiker of the Inter-
weather forecasting in the basin, explained did not understand the message itself, Oloo governmental Authority on Development’s
Wilson. said. Climate Prediction and Applications Centre,
In contrast, “the early-warning informa- which provides climate services to 11 East
Practical Outcomes tion passed currently to them is in a language African countries but is not part of the
Because of the HIGHWAY enhancements, the and format that they can understand. HIGHWAY project.
Uganda National Meteorological Authority is Weather warnings were co-designed with “The boats used by fishermen are small
able to provide updates on thunderstorms and have no access to weather forecasts,
and heavy rain over Lake Victoria in real time. especially when they are in the water. Now
In Kenya and Tanzania, marine weather fore- the EWS gives them the forecast before and
casts are now being disseminated specifically “The early-warning information while they are in the water using mobile tech-
to fishing communities twice per day. The nology,” Babiker said. “It also helps farmers
forecasting offices of all three NMHSs also
passed currently to [fisherfolk] is to plan better. It will help in saving lives and
share their published forecasts through a in a language and format that livelihoods.”
WhatsApp group. they can understand. Weather Rumelia Joshua, a fish trader in Tanzania,
A three-color traffic light flag system and agreed. “The information helps us because
warnings were co-designed with
notice boards are also used on beaches around when we get notified about bad weather, we
the lake to describe the conditions expected
them, standard weather buy fish in small quantities and save money,”
during the forecast period. messages developed jointly, and she said.
The flag signals help people without the weather information passed
smartphones, said Ibrahim Mengo, a fisher-
directly in its original format Scaling Up
man in Uganda. “When I look at the forecast WMO and other supporters of the HIGHWAY
and see the flag is green, then I know it’s OK using the WhatsApp platform.” project plan to scale it up to encompass
to go, but when [the flag is] red or orange, I regional forecasting for all of East Africa, said
know where I’m going is not safe and I decide Wilson.
whether or not to go.” Babiker said HIGHWAY owes its success to
them, standard weather messages developed the cooperation of the partner states as well
Communication and Cooperation jointly, and the weather information passed as to forecast products that focus on the lake
Efforts supported by H IGHWAY addressed directly in its original format using the itself as opposed to national systems. “In this
improving communication and cooperation WhatsApp platform,” Oloo said. way, you get better products and better user
in sharing meteorological data among orga- Innovations also included a “quick refer- services. If you are a fisherwoman on the lake,
nizations and communities. Severe weather ence guide developed for translating standard you basically need the same information
forecasts, participants said, could be incon- weather terms to local languages,” he added. regardless of your country,” he said.
sistent: In some cases, fisherfolk did not Training sessions for forecasters, observ-
receive any weather warning. In other cases, ers, and users in fishing communities have
the fisherfolk did not take received weather built trust in the forecasts. “Communities are By Munyaradzi Makoni (@MunyaWaMakoni),
information seriously, and sometimes they more confident in using the weather infor- Science Writer
16 Eos // AUGUST 2021You can also read