Working Paper Series Can Technology Improve the Classroom Experience in Primary Education? An African Experiment on a Worldwide Program - NOVAFRICA
←
→
Page content transcription
If your browser does not render page correctly, please read the page content below
Working Paper Series

Can Technology Improve the Classroom
Experience in Primary Education? An African
Experiment on a Worldwide Program

Joana Cardim
Universidade Nova de Lisboa and NOVAFRICA

Teresa Molina-Millán
Universidad de Alicante, NOVAFRICA and IZA

Pedro C. Vicente
Universidade Nova de Lisboa, NOVAFRICA, and BREAD

ISSN 2183-0843
Working Paper No 2101
January 2021

NOVAFRICA Working Paper
Series

     Any opinions expressed here are those of the author(s) and not those of NOVAFRICA.
     Research published in this series may include views on policy, but the center itself takes
     no institutional policy positions.

     NOVAFRICA is a knowledge center created by the Nova School of Business and
     Economics of the Nova University of Lisbon. Its mission is to produce distinctive
     expertise on business and economic development in Africa. A particular focus is on
     Portuguese-speaking Africa, i.e., Angola, Cape Verde, Guinea-Bissau, Mozambique, and
     Sao Tome and Principe. The Center aims to produce knowledge and disseminate it
     through research projects, publications, policy advice, seminars, conferences and other
     events.

     NOVAFRICA Working Papers often represent preliminary work and are circulated to
     encourage discussion. Citation of such a paper should account for its provisional
     character. A revised version may be available directly from the author.

  NOVAFRICA | Nova School of Business and Economics - Faculdade de Economia da Universidade Nova de Lisboa
Campus de Carcavelos | Rua da Holanda, Nº 1, 2775-405 Carcavelos – Portugal | T: (+351) 213 801 673 | www.novafrica.org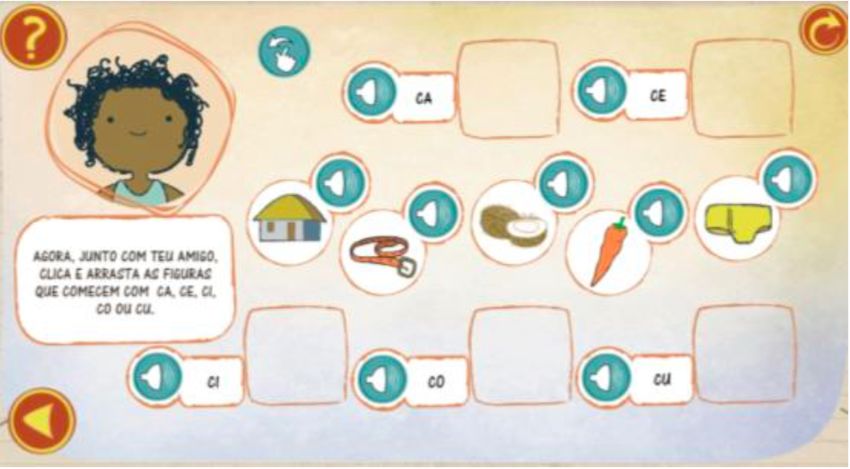
Can Technology Improve the Classroom Experience in
       Primary Education? An African Experiment on a
                                                                       ∗
                               Worldwide Program

          Joana Cardim†, Teresa Molina-Millán‡, and Pedro C. Vicente§

                                          January 2021

                                              Abstract

           Primary school coverage has been increasing in most developing countries. Yet,

        it has not been accompanied by significant improvements in learning indicators. We

        implemented a randomized experiment in Angola around the introduction of ProFu-

        turo, a worldwide educational program. The program includes a Computer-assisted

        Learning (CAL) software directed at improving the regular classroom experience.

        One year after the program started, we find higher familiarity with technology.

        Teachers miss fewer days of classes and implement better teaching practices. Stu-

        dents become more interested in learning and pro-social. Finally, the program

        improves students’ test scores in the most popular subject in the CAL platform.

JEL codes: O12, I21.
Keywords: Primary education, computer-assisted learning, CAL, field experiment, RCT,
   ∗
     We thank seminar and conference participants at NEUDC, IFS, and NOVAFRICA for useful com-
ments. We are grateful to Ana Margarida Araújo, Carine Canonici, Sara Queirós, Xaver Schenker, and
Sara Vaz for outstanding field coordination and/or research assistance. We also convey a word of appre-
ciation to all the enumerators we worked with in this project. We acknowledge funding from la Caixa
Foundation. Ethics clearance was given by Universidade Nova de Lisboa. All remaining errors are our
responsibility.
   †
     Nova School of Business and Economics and NOVAFRICA. Email: joana.cardim@novasbe.pt.
   ‡
     Universidad de Alicante, NOVAFRICA, and IZA. Email: teresa.molina@ua.es.
   §
     Nova School of Business and Economics, NOVAFRICA, and BREAD. Email:                            pe-
dro.vicente@novasbe.pt.

                                                  1
Africa, Angola.

1    Introduction

Human capital is widely considered to be vital for growth and human development. This
shared belief is illustrated by the fact that, after the Millennium Development Goal of
achieving universal primary education, ensuring inclusive and equitable education quality
became one of the most prominent Sustainable Development Goals of the United Nations.
Indeed, policy makers of developing countries, NGOs, and international institutions have
been primarily focused on increasing school enrollment and attendance. However, learn-
ing outcomes are still very low in many developing countries. In these settings the main
challenge is now to find effective ways to improve education quality, despite the limited
availability of skills in the population (Hanushek and Woessmann, 2008). One possibility
is to gear the incentives of teachers and parents/students for higher school attendance
and better learning. A large literature has devoted attention to incentives schemes, e.g.,
Duflo, Hanna, and Ryan (2012); Molina-Millán et al. (2019). But the role of school inputs
in the classroom should not be disregarded.
     Relating to school inputs, it is important to note that recently expanded school
systems in developing countries are often focused on elite students. Classical school in-
puts, such as textbooks, could then be the wrong inputs to help strengthening education
quality, e.g., Glewwe, Kremer, and Moulin (2009). Targeting more and better school
inputs to those students lagging behind could be the way to go, namely in settings where
student heterogeneity is significant (Banerjee et al., 2007). At the same time, computer
technology enabled pedagogical methods to be more tailored to the specific needs of
individual students. Many programs have been trying to improve education quality in
developing countries through the use of technology. However, experimental evidence from
various parts of the world reviewed by Escueta et al. (2017) proves that simply providing
schools with computers is unlikely to improve children’s academic performance. Differ-

                                            2
ently, computer hardware combined with Computer-assisted Learning (CAL) software
has demonstrated clear positive impacts on student achievement, in particular when in-
dividual customization of contents is possible, e.g., Muralidharan, Singh, and Ganimian
(2019).
Important questions do however remain about how to link these CAL programs
to regular teachers and classroom dynamics. In this paper, we assess the impact of
the introduction of ProFuturo, an innovative CAL program present in 38 countries of
three continents, which has already reached more than 450,000 teachers and 12 million
children. Importantly, the package provided by the ProFuturo program enables tailoring
contents to individual student needs. However, two innovative features of the program
stand out. First, its main objective is to help regular primary school teachers in their
core teaching activities in the classroom, i.e., after significant teacher training, ProFuturo
places teachers at the center of the program’s experience. Second, it promotes student
interaction with teachers and peers, namely through group work. Apart from the learning
software, ProFuturo includes an equipment set composed by individual tablets for all
students in a classroom. Since the objective of the program is to familiarize students and
teachers with technology while motivating and improving not only teachers’ teaching but
also students’ learning experience in all major contents of regular primary school, we ask
in this paper whether the program is effective in that regard. We also investigate the
effects of the implementation of ProFuturo on children’s cognitive skills.
The context of our study is the city of Luanda, Angola.1 Angola is a suitable
illustration of an expanded but low-performing school system. The Gross Enrollment
Rate in Angola’s primary education grew from an estimated 71% in 1998 to 113% in
2015. However, in 2014 its youth literacy rate was close to the average of Sub-Saharan
African countries, at 77% (World Bank, World Development Indicators, 2019). Sizeable
heterogeneity in students’ abilities within each classroom is common. Hence, it is clear
that the main challenge today in Angola, like in other African countries, is to increase
1
Angola is a low-income country with 30.8 million inhabitants in 2018. It has maintained political
stability since the end of the 27-year civil war in 2002. However, the country still faces substantial
development challenges stemming from high dependency on oil and very high poverty rates.
3the quality of education.
We implemented a randomized field experiment to test the impact of ProFuturo.
From the 42 primary schools in Luanda that were selected to receive ProFuturo, 21
were randomized to receive it in the beginning of 2018 and 21 assigned to start using
it in 2019. We employ a comprehensive set of measurements, including detailed school
principal, teacher, student, and household surveys, three rounds of class systematic ob-
servation, student standardized tests in Mathematics, Portuguese, and Science, as well
as administrative data from schools and the program.
Approximately a year after the program was introduced, We find that it increases
the levels of technology usage for both teachers and students. Importantly, teachers’
motivation improves with ProFuturo. Specifically, the program led to a reduction in
teachers’ absenteeism. The point estimate is large when employing administrative data:
less 0.69 standard deviations in days missed by teachers. Students also become more
motivated, namely towards Mathematics. Central to the program and to our analysis
are effects on teacher and student behaviors. Teachers improve the quality of their class
preparation and engage more often in active teaching in the classroom. Students devote
more time to reading, and to shared time with their guardians using technology. Some
evidence also suggests more pro-social interaction between students. Finally, we observe
in classrooms higher standards of teacher knowledge. These effects of ProFuturo translate
into improved students’ test scores in Science, which was the subject most frequently
selected to be taught under ProFuturo. We do not find any treatment effects in other
subjects.
Our paper relates to the literature on the use of computer technology for educational
purposes. The literature has shown that delivering computer hardware to schools has not
led to clear improvements in test scores. This literature includes non-experimental but
plausibly-identified causal effects: Angrist and Lavy (2002) show impacts of a lottery
program in Israel, and Machin, McNally, and Silva (2007) analyze the impact of ICT
funding for English schools. Barrera-Osorio and Linden (2009) show null results for a
two-year RCT in Colombia. A critical determinant of the extent to which these inputs give
4rise to better learning outcomes could be how they interact with teachers and pedagogy
in the classroom.
Similar null results are found for the One Laptop per Child program (OLPC), which
allocates computers to students one-to-one, with an emphasis on home use. Beuermann
et al. (2015) and Cristia et al. (2017) provide comprehensive supporting evidence from
OLPC experiments in Peru in both the short and longer run, as well as rural and urban
settings. A large RCT in the US also finds precise but null effects of access to computers
at home on educational outcomes (Fairlie and Robinson, 2013). Employing a regression-
discontinuity design, Malamud and Pop-Eleches (2011) find negative effects on school
grades of a voucher program in Romania to purchase computers, despite improvements
in computer skills.2
One pedagogical approach that seems to have a role in student achievement is Com-
puter Assisted Learning (CAL). This includes delivering hardware to students along with
a specific software designed to develop particular skills (e.g., improving Mathematics).
In some cases, this software may adapt and respond to students’ learning needs. This
approach may be particularly relevant as schools in developing countries typically have
more than a grade per class, a large student-teacher ratio, and highly heterogeneous
students. There are promising results of this type of interventions.
Banerjee et al. (2007) evaluate a CAL program in India that consisted of Math games
whose level of difficulty responded to students’ ability to solve them. These authors find
large gains in test scores at the end of one and two years of the program for all types of
students. Consistently, for a sample of American schools, Barrow, Markman, and Rouse
(2009) find significant improvements in pre-algebra and algebra skills after a targeted
CAL program was implemented. These authors hypothesize that these effects arise from
increased individualized instruction as impacts appear larger for students in larger classes.
Indeed, it could be that the individual tailoring of CAL programs is particularly important
for their effectiveness. A series of experimental evaluations of CAL in China have found
modest positive impacts on learning. A likely explanation is that the evaluated program
2
The exception in this literature is the experimental evaluation of Mo et al. (2013) which finds
improvements in Maths scores of migrant students in Beijing.
5employed technology that did not feature extensive individual customization (Yang et al.,
2013; Lai et al., 2013; Mo et al., 2014; Lai et al., 2015).
Muralidharan, Singh, and Ganimian (2019) evaluate a CAL program (Mindspark)
explicitly designed to customize pedagogy to the right level of students in grades 6 to 9
in New Delhi, India. The program included an initial screening test and an algorithm
that constantly updated its information about the student. It used a CAL system able to
finely calibrate students’ competencies and tailor academic content to the corresponding
level. The study finds high impact in Maths and Language skills, with larger gains for
the academically weaker students.
On a comprehensive evidence-based review of the impact of education technology,
Escueta et al. (2017) identify that the majority of programs that have positive results
focused on improving Maths outcomes instead of Language. Some specific examples are
Rouse and Krueger (2004) for an early American program focusing on Language, and
Carrillo, Onofa, and Ponce (2011) for a more recent program in Ecuador with a large
contrast between Maths and Language. The authors of the review study also claim that
the channel through which CAL is expected to improve learning the most is by tailoring
education to the needs of the students and by providing immediate feedback to students.
One can argue that programs such as Mindspark may act as substitutes and not
complements to teachers, hindering the potential benefits that students may attain from
student-teacher interactions. Escueta et al. (2017) claims that little is known about how
CAL programs interact with teachers’ efforts. Beg et al. (2019) studied a program in
Pakistan that consisted of video lectures together with some suggestions of activities for
the teacher to implement in the classroom. The authors found that student achieve-
ment in Maths and Science tests increased after 4 months of exposure to the program.
They found some evidence of complementarity between school inputs: teachers using
the program increased attendance and spent more time preparing the lessons. In this
case, however, the program did not include individual student customization. Another
critique to CAL programs is related to the possibility of decreasing interaction among
peers. Araya et al. (2019) experimentally evaluate an innovative technology program
6that uses gamification to increase Maths learning in low-performing primary schools in
Chile. Students improved learning outcomes but the program increased Maths anxiety
and reduced students’ preferences towards teamwork.
We contribute to this literature by studying the impact of a highly innovative pro-
gram that combines three important components of successful CAL programs: instruction
tailored to students’ needs, the inclusion of teachers as the main intermediaries in the
implementation of the CAL - i.e., securing substantial interaction between teachers and
students -, and the possibility of undertaking activities in student groups through the
CAL package. We also focus on a developing setting with implications for where in the
world the most acute shortcomings in education quality are present.
The remainder of this paper is organized as follows. Section 2 provides the context
of our experiment and the details of the program. Section 3 describes the design of
the experiment, including of the measurement. Section 4 explains the hypotheses and
the identification strategy. In Section 5 we present and discuss the results. Finally, we
conclude.
2 The ProFuturo program
The CAL program that we study in this paper, ProFuturo, is an international program
sponsored by Fundación la Caixa and Fundación Telefónica in Spain. It is one of the
largest digital education initiatives in the world: it aims to target 25 million children in
vulnerable areas by 2030. By the end of 2017, 5.8 million children were beneficiaries of the
program. Today, ProFuturo is present in 38 countries in Latin America, the Caribbean,
Africa, and Asia, having trained more than 450,000 teachers and benefited 12 million
children.
The main objective of ProFuturo is to ‘bridge the education gap in the world by
providing quality, digital education to children from vulnerable environments.’ To reach
this goal, ProFuturo aims to improve teachers’ expertise both at the technological and
pedagogical levels, and to promote learning by students through increased motivation, as
7well as improved quality in classroom dynamics. At the center of ProFuturo is the idea
of a CAL tool that intends to be a complement, and not a substitute for teachers in the
classroom. ProFuturo takes teachers as ‘the main learning activator.’
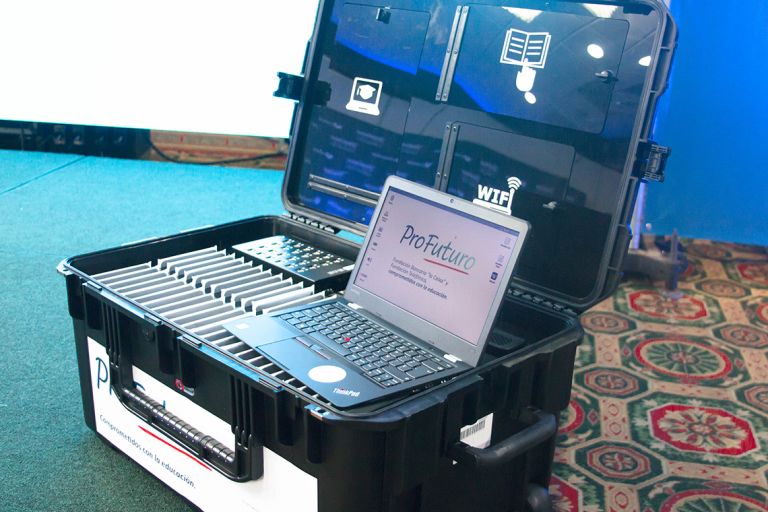
The program includes the distribution of suitcases which include tablets, a computer
for the teacher, and a projector. Each suitcase suits roughly one classroom, with enough
tablets for all students. This technology may be easily implemented in the context of a
developing country, where there is limited access to electricity, as batteries last for nine
hours after being charged for four hours and its software runs only offline. Each tablet
is equipped with a software, produced on purpose for ProFuturo. The software contents
are engaging and interactive and were approved by several educational partners, such as
UNESCO and Instituto Cervantes (Spain). They are adapted for different countries in
terms of language and cultural references.
While focusing on core educational contents at the primary level employing inter-
national standards, the contents of the software package include lectures on Language
(Portuguese), Mathematics, and Science. Other more specific types of contents are also
included, namely on Technology and on Ethics and Citizenship (including contents on so-
cial cohesion, the relationship with others and the community, rules of conduct in school,
among other topics). There are activities available at the end of each module to test
students on what they learned. These activities give immediate feedback to students
– praising them when they give a correct answer and telling them to try again if they
make mistakes. The platform also allows teachers to have access to the progress of stu-
dents by giving them reports about students’ performance in activities performed within
ProFuturo. Teachers can then customize contents to be used according to the needs of
individual students. They can also create their own contents, which become available
together with the full repository of ProFuturo for didactic contents.
Before implementation, ProFuturo trains school principals and teachers in the schools
where the program is introduced. Teachers are trained according to their perceived level
of computer proficiency by ProFuturo coordinators. Each training module directed to
principals typically lasts 5 hours; modules directed to teachers have the duration of
8around 20 hours.
ProFuturo has been present in Angola since the end of 2015, in close link with
the Catholic Church and the Ministry of Education of Angola. It was first introduced
in Luena, Moxico province. At the end of our project, it was present in 124 schools,
involving 1,208 teachers and around 100,000 children in primary schools.3 These schools
typically serve children from disadvantaged socioeconomic neighborhoods. ProFuturo
included at this point in time 22 full-time coordinators in Angola.
We present more details on the ProFuturo program and its adoption in Luanda at
the time of our study in Section A of the Appendix. It is important to note that Science
contents were the ones most frequently selected by teachers using the ProFuturo platform.
Administrative data provided by the ProFuturo platform reports that 40-44 percent of
all activities performed using ProFuturo in 2018 and 2019 were in Science, followed by
Portuguese (23-24 percent) and Mathematics (16 percent).
3 Experimental design
In the end of 2017, ProFuturo selected 42 Catholic schools in Luanda to be included
in this study.4 The randomization procedure for the allocation of schools to treatment
was implemented following a stratified clustered design. After schools were paired based
on region and school characteristics,5 half of them were randomly allocated to receive
the ProFuturo program immediately (21 schools), with the other half assigned to a con-
trol group which was promised to receive the program following the end of the impact
evaluation project (approximately a year after the treatment group).
3
The schools included in the program were at this point located in some of the main cities of Angola:
Luanda, Caxito, Viana, Benguela, Huambo, Moxico, Malange, Uige, Dundo, and Saurimo.
4
See figure A1 for a map with the geographic distribution of selected schools in Luanda.
5
The employed school characteristics included: number of students, number of teachers, number
of classrooms, average number of students per class, maximum number of students per class, school
access to electricity, safety from crime within the school, school access to internet, indicators of school
infrastructure, and school staff knowledge of information technology.
93.1 Measurement
The structure of measurements in this project included: (i) baseline and endline surveys at
the school principal, teacher, student, and student’s guardian levels; (ii) student cognitive
tests; (iii) classroom observation activities; (iv) administrative data from schools as well
as from Profuturo on students’ and teachers’ use of ProFuturo’s software package. Figure
A7 in Appendix B depicts the timeline of the measurements.
Surveys: The surveys we designed and conducted included face-to-face submission
of questionnaires to all school principals and to all teachers working in each school at the
time of the interview, as well as to a random sample of students and their caregivers.
This data collection effort started before the beginning of the intervention for the baseline
surveys, from December 2017 to March 2018, and for the endline surveys, 11 months later,
from November 2018 to May 2019.
The survey questionnaires targeting school principals included questions on their
demographic and socioeconomic characteristics. They also included a module on school
management. The survey questionnaires targeting teachers were analogous. Beyond de-
mographic and socioeconomic questions, and importantly for our analysis, they included
questions on use of technology, motivation and attitudes towards teaching, as well as time
allocation. We also collected self-reported information on teacher absenteeism.
We randomly sampled 60 students in the 4th, 5th, and 6th grades in each school,
stratified by class, for the students’ and guardians’ surveys. The survey questionnaires
targeting students included questions on their ability to use technology, their motivation
towards the school, as well towards learning in general and in specific subjects. Students
were also asked to report their absenteeism, and they were subject to a test on their
executive function, in particular a forward and backward digit span test, in which the
respondent is asked to repeat a series of numbers read to him/her (Engle, 2002). The
questionnaires directed to students’ guardians included questions about demographic and
socioeconomic characteristics of the student’s household. They also included questions
regarding the guardian’s perception of his/her child’s motivation, satisfaction about the
school, learning, as well as time allocation when he/she is not in school.
10Classroom observation: Our systematic classroom observation involved the ran-
dom selection of five classes within each school from the 4th, 5th, and 6th grades to be
observed. We implemented a classroom observation questionnaire, to be answered by
enumerators observing the delivery of classes by teachers in the classroom. This was con-
structed using the ‘Stallings Classroom Snapshot Instrument.’ The Stallings instrument
generates quantitative data describing the activities performed by the teacher during the
class and the type of interaction between the teacher and students in the classroom. The
classroom observation effort entails the enumerator coding ten different snapshots, using
regular intervals of time, during each observed class. During the submission of the ques-
tionnaire, the enumerators were asked to write down a brief description of the activity
before coding each activity according to the instrument. To reduce possible subjectivity
on observations, we deployed two enumerators per classroom. At the end of each class
observation, enumerators reported their overall perceptions about the class, registering
aspects such as perceived teachers’ mastery of the contents being taught. We included
three rounds of classroom observation in our measurement design, one at the baseline
and two after approximately a year had passed from the introduction of ProFuturo, with
a few months in between.
Cognitive tests: As part of the implementation of the teachers’ surveys, we included
an assessment of teachers’ cognitive skills based on the Survey of Adult Skills (PIAAC)
- an international test developed by the OECD, and adapted to the context of a de-
veloping country. The test consisted of a reading comprehension question about a text
in Portuguese and three Maths questions. In addition, we submitted cognitive tests to
students. We randomly selected six classes from grades 4, 5, and 6 within each school
to be submitted these tests. All tests were constructed based on the materials of the
learning initiative Uwezo. This is a platform that conducts annual, large-scale, citizen-
led, household-based assessments that measure actual levels of children’s literacy and
numeracy. The platform is dedicated to Kenya, Tanzania, and Uganda. The curricula of
Portuguese, Mathematics, and Science for each grade were also taken into account. The
tests begin with relatively easy questions and gradually become more difficult.
11Administrative data: We collected administrative data from each school on various
dimensions of school operation.6 Since some of the data we accessed were incomplete,
we will dedicate particular attention in the analysis that follows to the most complete
dimensions of school operation, which included the data on teacher absenteeism. Data
from ProFuturo’s software platform are also available to complement data collected in
the field. However, it is not possible to link these data to individual data collected for
the students (surveys and test scores) due to no name identifiers being available in the
ProFuturo platform for data protection reasons. However, we use these data to formulate
a better understanding of the main activities and subjects studied through the platform.7
All main outcome questions employed in our study are fully described in Section
C of the Appendix. We organize them by families of outcomes. We begin with use of
technology. We then list the outcomes we employ to describe the levels of motivation
by teachers, students, and guardians. The time allocation of teachers, and the observed
class delivery are next. Subsequently, we take students’ time allocation, behavior, and
interactions at school. We finally depict the variables we employ for cognitive skills of
both teachers and students.
4 Hypotheses and estimation strategy
Our main hypothesis is that ProFuturo improves the classroom experience of students in
primary education leading to an improvement in their skills.8 Various channels for these
effects are at stake. These are described as follows.
Hypothesis 1: The program increases the use of technology for teachers and
6
These included the number of teachers and students in each school, the number of classes and number
of children per class, attendance of teachers and students, dropout and enrollment rates of students,
national exam grades (at the time of the 6th grade), internal school grades, teacher evaluations, and
students’ discipline.
7
In addition, we implemented three behavioral activities to assess non-cognitive behaviors. These
measured: (i) children’s motivation with school and learning; (ii) altruism and pro-social behavior of
children; and (iii) teachers’ motivation towards the school and teaching. However, we encountered
many problems when implementing these activities, and we found out that participation of students and
teachers was not completely voluntary in some schools. Therefore, we do not include these measures in
the analysis.
8
For details on the proposed research design prior to data access, see the research proposal available
at Research proposal, June 2017.
12students.
Hypothesis 2: The program leads to an increase in the motivation levels of teachers
and students, which includes reducing absenteeism.
Hypothesis 3: The program leads to higher quality teaching by teachers, including
better preparation and delivery of classes.
Hypothesis 4: The program leads to a better learning experience by students,
including more time devoted to learning at home and more effective social interactions
at school.
Hypothesis 5: The program improves the cognitive skills of teachers and students.
We estimate the Intent-to-treat (ITT) effect of ProFuturo on our broad set of out-
come variables. The basic specification of the model is:
yis = α + βProFuturos + δyis0 + Xis0 γ + is (1)
where yis is the outcome of interest for individual i in school s, measured at the endline.
Note that individual i can be a teacher, a student, or a student’s guardian. The variable
ProFuturos is a treatment indicator taking value 1 for schools which were assigned to
receive ProFuturo and 0 otherwise. Xis is a set of individual characteristics including
strata fixed effects, for either teachers, students, and/or students’ guardians depending
on the outcome at stake.9 yis0 is the baseline value of the dependent variable, and i s is an
idiosyncratic error term. To account for possible correlation in outcomes within schools,
the error term is clustered at the school level. If the auto-correlation of the outcome
variable is low, which is the case for most survey outcomes, this specification maximizes
statistical power in field experiments (McKenzie, 2012).
Given that baseline values of the outcome variable are not available for classroom
9
Control variables are as follows. When analyzing outcome variables at the level of the teacher:
gender, age, age squared, education, house ownership, index of assets, an indicator variable on whether
the house has piped water, and an index on the use of technology. When analyzing outcomes at the level
of the student and the guardian: students’ gender, age, and grade; an indicator variable on whether the
student has attended kindergarten, an indicator variable on whether the student has failed at least one
course in the past, and respondent’s month of interview. When analyzing outcome variables at the level
of the guardian, in addition to the above: guardian’s gender, age, age squared, and education; number
of members of the household, house ownership, index of assets, and an indicator variable on whether the
house has piped water.
13observation data, we employ the following specification when employing the referred type
of data:
0
ycs = α + βProFuturos + Xcs γ + cs (2)
where ycs is the outcome of interest for classroom c in school s. Xcs is a set of
classroom characteristics including strata fixed effects, grade, and month of observation.
To assess whether the relatively small number of clusters (schools) biases any of the
results in terms of statistical confidence, we follow Athey and Imbens (2017), as well as
Young (2019), and replicate all our hypothesis tests using randomization-based inference
tests. In randomization-based inference, uncertainty in estimates arises naturally from
the random assignment of the treatment, rather than from hypothesized sampling from a
large population. This method allows estimating the exact p-value under the sharp null
hypothesis that the treatment effect is null, by calculating all possible realizations of a
test statistic and rejecting if the observed realization in the experiment itself is extreme
enough (see Heß (2017)).
In the results section we also check whether the main results of the paper are robust
to using the Post-Double Selection LASSO procedure to select control variables.
5 Results
5.1 Descriptive statistics, balance, and attrition
We now turn to describing the baseline characteristics of teachers, students, and students’
guardians. In the process, we also provide an assessment of balance between treatment
and control groups for the referred traits.
The top panel of Table D1 in Appendix D shows descriptive statistics on school
teachers’ baseline characteristics. Forty percent of teachers in the control group are
women They are on average 37 years old, around half of them are married, and 74 per-
cent have children. There are no significant differences between the control and treatment
14group in terms of teachers’ characteristics, including teaching experience and asset own-
ership. The exception is that teachers in the treatment group are 11 percentage points
more likely to have completed university studies, which is significant at the 1 percent
level.
The middle panel of Table D1 shows descriptive statistics on students’ baseline
characteristics. 53 percent of the sample is female and the average student in the control
group is 11 years old. Both age and gender are balanced across comparison groups.
However, we observe differences across students in two dimensions, pointing in the same
direction. First, students from the treatment group are 3 percentage points less likely to
have attended kindergarten. They are also 4 percentage points more likely to have failed
at least one course in the past. Both differences are significant at the 10 percent level.
There are not significant differences with respect to students’ baseline test scores.10
The bottom panel of Table D1 shows descriptive statistics of students’ guardians at
the baseline. In both treatment and control groups, around 56 percent of the interviewed
caregivers are women. On average guardians in the control group are 39 years old, while
guardians in the treatment group are on average 1.2 years younger. This difference is
significant at the 5 percent level. Guardians from the treatment group are 5 percentage
points less likely to have completed university studies, which is significant at the 5 percent
level. In term of households’ wealth, on average 60 percent of the caregivers own a house
and 38 percent of them have piped water, with no significant differences between groups.
There are no significant differences with respect to IT goods ownership.11
Overall, we can conclude that our randomization procedure was able to identify
comparable groups, namely in terms of demographic characteristics. Nevertheless, we
found some statistically significant differences between individuals in treatment and con-
10
Figure A1 in the Appendix shows the distribution of Mathematics and Portuguese test scores by
grade. The figure confirms that the tests in both fields of assessment performed well in capturing a wide
range of achievement within grades and across grades. As expected, the distributions move from the
right to the left as students’ grades increase.
11
Note that sample averages for the guardians interviewed in the baseline survey should be taken
with caution. We managed to interview 1,087 caregivers from a targeted sample of 2,520. Thus, it is
possible that the averages presented are not representative of the study population: guardians that were
interviewed are likely to be more involved with the school. However, our analysis suggests that this
sample selection did not translate into systematic differences between treatment and control.
15trol schools. To take these imbalances into account we apply Inverse Probability of
Treatment Weighting (IPTW) to the main results (see Section H in the Appendix).
A note is also due on survey attrition. Table E1 in Appendix E presents response
rates in the teachers’, students’, and guardians’ surveys, when comparing baseline to
endline. In the endline, attrition in the teachers’ survey was 13 percent when considering
the total number of interviews and 38 percent when considering the specific teachers in-
terviewed at the baseline (control group). In the students’ survey, it was 7 percent when
considering either the total or the panel (control group). Attrition in the guardians’ sur-
vey was larger. We interviewed 74 percent of the guardians in the endline, and we have
panel data reported by the guardians for 44 percent of the baseline sample. Overall, at-
trition rates are not significantly different between the treatment and the control groups.
Appendix Table A1 shows balance tests on baseline characteristics for respondents sur-
veyed at the endline. Overall, the endline samples of teachers, students, and guardians
are very similar to the corresponding samples at baseline.
5.2 Treatment effects
5.2.1 Use of technology
We now turn to our analysis of treatment effects. We begin our analysis of outcome
variables with measures of familiarity with technology for teachers and students. These
are shown in Table 1. Column 1 is dedicated to teachers’ use of technology during the
lectures. Columns (2) to (4) are dedicated to students’ outcomes. In particular, we
analyze students’ self-reported ability in performing sets of basic and advanced activities
employing a computer, and their desire to use more technology at school. Column 5 is
devoted to students’ use of technology at home, as reported by their guardians.
Table 1 shows that teachers in treated schools are more likely to employ computers
during their lectures than teachers in the control group. The magnitude of the effect
is 0.09 standard deviations, significant at the 1 percent level. The exact p-value from
randomization inference is lower than 1 percent. Students in treated schools report being
able to perform more basic activities (turn on/off a computer, write, and open/close
16programs and applications) than students in the control group. The size of this effect
is 0.09 standard deviations, significant at the 10 percent level and not significant using
randomization inference. We do not find any effect of ProFuturo on the advanced use
of technology, i.e., including performing searches in internet, saving a file, and printing
of documents. Students in treated schools are more likely to report that they would
like to use more technology at school. The size of the effect is 0.03 standard deviations
and it is significant at the 1 percent level. The exact p-value is 0.01. Guardians also
report an increase on the use of technology at home by their children. This effect is
statistically significant at the 1 percent level and its size is 0.23 standard deviations. The
randomization inference p-value is 0.04.
We validate Hypothesis 1, as we find evidence that both students and teachers in
ProFuturo schools are more likely to use technology, not only at school, as is the case for
teachers, but also at home, as is the case for students.
5.2.2 Motivation and absenteeism
We now turn to measures of teacher and student motivation towards the school, including
absenteeism. Table 2 depicts results related to teachers. We employ outcomes from the
schools’ administrative data, from the teachers’ survey, from the guardians’ survey, and
from classroom observations. Specifically, we analyze the number of days the teacher was
absent (from administrative school records and self-reported), the number of days the
teacher arrived late to school (self-reported), and teacher motivation (from the teachers’
survey, the guardians’ survey, and the classroom observations’ data).
We find clear effects of the treatment on absenteeism from the administrative data
both for the month prior to the survey and for the full academic year. Both self-reported
survey data and school administrative data yield treatment effects on missing less days
of classes. There are however no significant effects on being late when arriving at school
as reported by teachers. The effect of ProFuturo on teachers’ absenteeism derived when
employing the administrative data is large: the program reduces the number of days the
teachers missed in the previous month by 0.69 standard deviations. This result is sta-
17tistically significant at the 1 percent level. When employing randomization inference, it
becomes significant at the 5 percent level. We also observe that ProFuturo reduces the
number of days that teachers were absent during the complete school year by 0.4 standard
deviations, which is significant at the 1 percent level (also when employing randomiza-
tion inference). Turning to the teachers’ surveys, ProFuturo reduces the number of days
that teachers reported to be absent by 0.1 standard deviations, which is significant at
the 5 percent level and marginally insignificant using randomization inference. There are
no significant differences in self-reported levels of motivation or on the levels of teacher
motivation reported by guardians. There is a positive treatment effect of 0.23 standard
deviations on the motivation of teachers reported by the enumerators that observed class-
room teaching in the final round. However, this is significant at the 10 percent level, and
not significant using randomization inference p-values.
Table 3 presents results related to students’ and guardians’ motivation and their
attitudes towards the school using data from the students’ and the guardians’ surveys, as
well as classroom observations. Columns (1) to (3) are dedicated to students’ survey data.
Specifically, we analyze whether students report a positive attitude towards the school,
whether they like Mathematics, and whether they like reading. Column (4) is dedicated to
guardians’ survey data, namely on guardians’ reports about school satisfaction. Column
(5) is dedicated to students’ survey data, in particular to the number of days the student
missed school. Columns (6) and (7) are dedicated to data collected through classroom
observations.
Students in treatment schools report they like Mathematics more than in control
schools. ProFuturo increased the likelihood students report liking Mathematics by 0.02
standard deviations, which is statistically significant at the 5 percent level (at the 10
percent level using exact p-values from randomization inference). We do not find sig-
nificant treatment effects on attitudes of students towards school or reading. Turning
to the guardians’ survey, we find a positive impact, of 0.13 standard deviations, on re-
ported overall school satisfaction. This effect is significant at the 10 percent level but
insignificant when employing randomization inference. We do not find any treatment
18effect on students’ absenteeism, i.e., on the number of school days missed. Finally, when
analyzing classroom observation data, namely from enumerators assessments of students’
motivation, we do not report any significant effects of ProFuturo.
We conclude that ProFuturo was effective at decreasing the absenteeism of teachers
and increasing their motivation, consistently with Hypothesis 2. The effects on absen-
teeism are particularly clear. Regarding students, we find that the program has some
effects on increasing their motivation, namely on having a more positive attitude towards
Mathematics.
5.2.3 Teaching
We turn now to analyzing the quality of teachers’ preparation of the classes they teach,
their broader time allocation, as well as their behavior in the classroom. Table 4 de-
picts treatment effects on a self-reported teachers’ classroom preparation index as well as
teachers’ self-reported allocation of time in a regular working week by activity. Specif-
ically, the classroom preparation index includes information about whether the teacher
has a plan of the subjects to teach during the academic year, a book of class registries
and summaries, and a notebook in which they prepare classes. We also analyze teachers’
allocation of hours to teaching, planning teaching activities in school, planning teaching
activities at home, and undertaking administrative tasks.
Related to teachers’ planning, we find that teachers in ProFuturo schools become
more careful about preparing their classes. The magnitude of this effect is 0.12 stan-
dard deviation units, significant at the 5 percent level. The exact p-value is, however,
marginally above standard levels of statistical significance. For a regular week, teachers
report to spend more time teaching and less time planning teaching activities at school.
The effect magnitudes are 0.04 standard deviations and -0.06 standard deviations, respec-
tively, both significant at the 10 percent level, although not significant with randomization
inference. There are no statistical significant differences in time planning at home and
undertaking administrative activities.
Table 5 shows results from the second and third rounds of the classroom observation
19data. Specifically, columns (1) to (3) show results on teacher allocation of time during
class. We analyze teachers’ allocation of time in the classroom to reading, instruction, and
discussion, to practice and drill, and to monitoring. Column 4 is dedicated to knowledge
of the subject shown by teachers during the classes as observed by enumerators.
In the second round of observations, there are no significant treatment effects except
for a positive effect on time allocated to monitoring. Teachers in the treatment group
allocate 6.5 percentage points more time to that activity, which is significant at the 5
percent level (the exact p-value from randomization inference is 0.108). In the third round
of classroom observations, we find clear treatment effects on expanding time allocated to
practice and drill, and on increasing knowledge shown during the classroom observation.
The magnitude of the effects are 1.2 percentage points and 0.35 standard deviations
respectively, both significant at the 5 percent level. The corresponding exact p-values are
0.117 and 0.058.
We conclude that ProFuturo induced some changes in line with Hypothesis 3.
Specifically, we find higher quality in teachers’ preparation of their classes, which trans-
lates into more time devoted to teaching as reported by teachers. Looking at observed
classroom activities, we find short-term effects on increasing passive teaching (e.g., mon-
itoring), perhaps as compensation for classes employing ProFuturo teaching.12 However,
these short-term effects do not last and are substituted by positive effects on active teach-
ing, namely through practice and drill, and on improved knowledge of the subject taught
13
in the last round of class observations.
12
We could observe in ProFuturo classes that there was no time devoted to copying activities (see
Table A2 in Appendix A). Indeed, outside ProFuturo classes, teachers could be giving students some
material for them to take home, given that they do not take anything home after ProFuturo classes.
13
Table F1 in Appendix F shows results on teacher allocation of time during class observation bro-
ken down by activity. Specifically, we analyze teachers’ allocation of time in the classroom to reading,
instruction, discussion, practice and drill, monitoring seatwork, monitoring copying, disciplining, man-
aging the classroom, being off-task, and being absent. In addition to the results shown in Table 5, the
only treatment effect is on increasing time allocated to managing the classroom in the third round. The
magnitude of the effects is 3.8 percentage points, significant at the 5 percent level. The exact p-values is
0.064.
205.2.4 Students’ time, behavior, and interactions
We now consider students’ allocation of time to various activities at home as reported by
guardians interviewed in the corresponding endline survey, as well as students’ behavior
and interactions with their teachers and peers at school. Table 6 shows results on students’
allocation of time. We analyze in particular the time allocated by students to reading,
studying, and playing in a regular week. We also devote attention to how the shared time
between guardians and their children is spent, namely on activities using technology and
on studying.
Students in the ProFuturo schools spend 0.23 standard deviations more time reading
and 0.15 standard deviations more time playing. Results are significant at the 1 percent
and 5 percent levels, respectively. The corresponding randomization inference p-values are
0.03 and 0.05. Regarding the time treated guardians and their children spend together,
it is more likely to be spent using technology, by additional 0.11 standard deviations,
when compared to control individuals. This result is significant at the 10 percent level
but not significant using exact p-values. There are no differences regarding time devoted
to studying (by students alone or together with their guardians).
In Table 7 we report our results on students’ behavior and interactions with their
teachers and peers at school, while employing data from students’ surveys. Specifically,
we analyze a measure of students’ self-reported altruism, students’ perceptions about the
level of collaboration among themselves, and their beliefs about whether they have many
friends at school.
We observe a positive treatment effect of 0.03 standard deviations, significant at
the 1 percent level, on the measure of students’ altruism. This result is significant at
the 10 percent level using randomization inference. Students from treatment schools are
0.02 percentage points more likely to have received help from other students, which is
statistically significant at the 10 percent level, but not significant when looking at exact
p-values from randomization inference. This effect does not translate to having more
friends at school.
Overall, we find some consistent patterns with hypothesis 4. Our findings imply
21positive effects of ProFuturo on time devoted to reading by students and on shared time
with their guardians using technology, possibly playing games. They are also suggestive
that ProFuturo induces some movement towards pro-social interaction between students.
5.2.5 Cognitive skills
In Tables 8-9, we show treatment effects on outcomes related to teachers and students’
cognitive skills. In the case of Table 8, we analyze treatment effects on the performance
of teachers in standardized test scores following PIAAC (columns 1 and 2) and on their
knowledge self-assessment (columns 3-6).
We find that teachers in the treatment group have lower performance in standard-
ized test scores assessing knowledge of Portuguese. The magnitude of this effect is -0.15
standard deviations, statistically significant at the 5 percent level, and significant at 10
percent level using exact p-values from randomization inference. A possible interpreta-
tion for this counter-intuitive result is related to the fact that the ProFuturo platform
was set up in Brazilian Portuguese which is quite different from the Portuguese com-
monly used in Angola. We do not find significant treatment effects on teachers’ perfor-
mance in standardized test scores assessing their knowledge of Mathematics. In terms of
self-assessment, we see no effects regarding overall self-assessment or self-assessments on
Portuguese and Mathematics, but there is a positive treatment effect of 0.13 standard
deviations on the self-assessment of knowledge in Science, significant at the 5 percent
level, although marginally insignificant when employing randomization inference.
Table 9 is dedicated to the analysis of treatment effects on outcomes related to
students’ cognition. Specifically, we study impacts on students’ scores in the memory for
digit span test and in standardized test scores.
We find treatment effects on the standardized test scores in Science. The size of this
effect is 0.07 standard deviations, significant at the 5 percent level. We also encounter
marginal statistical significance at standard levels when employing randomization infer-
ence. We do not find any significant effects on other subjects.14
14
Table F2 in Appendix F shows treatment effects on students’ self-assessment in Portuguese and
Mathematics, and on students’ ability to estimate their own performance. Overall, there is no evidence
22Teachers report higher levels of knowledge in Science, which is consistent with higher
test scores by students in that subject. This may be explained by the fact that this is
the subject most frequently selected in classes employing Profuturo. See Section A in
the appendix for further details of content adoption. We do not observe clear changes in
other subjects. Hence, the evidence in favor of Hypothesis 5 is mixed.
5.2.6 Robustness
A further note is needed to account for robustness exercises we conduct on the choice of
control variables for teachers, students, and guardians, as well as on a weighting exercise
to improve the comparability of the treatment and control schools.
Specifically, in Section G of the Appendix we show the replication of the main results
of the paper while employing the Post-double Selection Lasso procedure for selecting the
referred control variables.15 In Section H of the Appendix we describe how we construct
the inverse probability weights to correct for sample imbalance at baseline and show the
replication of the main results of the paper while applying IPTW.16 Overall, we do not
identify any relevant departure from the benchmark results of the paper.
5.3 Aggregation of outcomes
In order to address the risks posed by the analysis of multiple outcomes, we now devote
attention to aggregating the outcomes we analyzed in detail in the previous section. We
bundle outcomes in indices that are built using the procedure detailed in Kling, Liebman,
and Katz (2007). We then calculate within-sample z-scores for each individual outcome,
employing the mean and the standard deviation of the control group. Subsequently, we
obtain the unweighted average z-score for each set of outcomes. In order to aggregate
that students from ProFuturo schools are more likely to correctly estimate their own performance. In
Portuguese, however, students are 5.2 percentage points less likely to overestimate their performance,
significant at the 5 percent level and at the 10 percent level using exact p-values. In Mathematics, they
are 2.4 percentage points more likely to underestimate their performance. This effect is significant at
the 10 percent level, but not at standard levels when using randomization inference.
15
We do not apply Lasso to the analysis done using the classroom observation questionnaire as there
we have very few control variables.
16
We do not apply IPTW to the analysis done using the classroom observation questionnaire as we
have very few control variables to construct weights at the classroom level.
23outcomes defined at different units of analysis, i.e., at the level of the teacher, student,
guardian, and class, we construct indices at the school and grade level. This means
that we take a low number of observations in the regressions that follow, meaning that
this is a very conservative exercise. Specifically, we consider indices on: Technology
use, built from outcomes of Table 1; Teachers’ absenteeism and motivation, built from
outcomes of Table 2; Students’ absenteeism and motivation, built from outcomes of Table
3; Teachers’ time allocation: built from the outcomes in Table 4; Observed class delivery:
built from outcomes in Table 5; Students’ time allocation: built from the outcomes in
Table 6; Students’ behavior and interactions at school: built from the outcomes of Table
7; Teachers’ cognitive skills: built from the outcomes in Table 8; and Students’ cognitive
skills: built from the outcomes in Table 9.
Figure 1 shows treatment effects analogous to the ones shown in the previous sec-
tion on the aggregate indices we described above. Confidence intervals are built using
statistical significance at the 10 percent level.17 In face of the standardization of outcome
variables embedded in the procedure we adopted, all treatment effects are expressed in
standard deviation units.
We find significant treatment effects of ProFuturo in technology use and teacher’s
motivation. The magnitudes of both these effects are 0.19 and 0.14 standard deviations,
significant at the 1 percent level (also using randomization inference). We find positive ef-
fects on teachers’ time allocation towards teaching and students’ behavior and interaction
at school, significant at the 5 percent level (but marginally significant when employing
exact p-values). Treatment effects on students’ absenteeism and motivation, and time
allocation towards reading, studying, playing, and using technology with their guardians
are on the aggregate positive but not robustly significant in statistical terms. We do not
find significant effects on the remaining aggregates.
17
Appendix F includes the table corresponding to this graph.
24You can also read