WOOL INDUSTRY - NATIONAL RD&E STRATEGY 2018-2022 - APRIL 2018
←
→
Page content transcription
If your browser does not render page correctly, please read the page content below
WOOL INDUSTRY –
NATIONAL RD&E STRATEGY
2018-2022

                         APRIL 2018
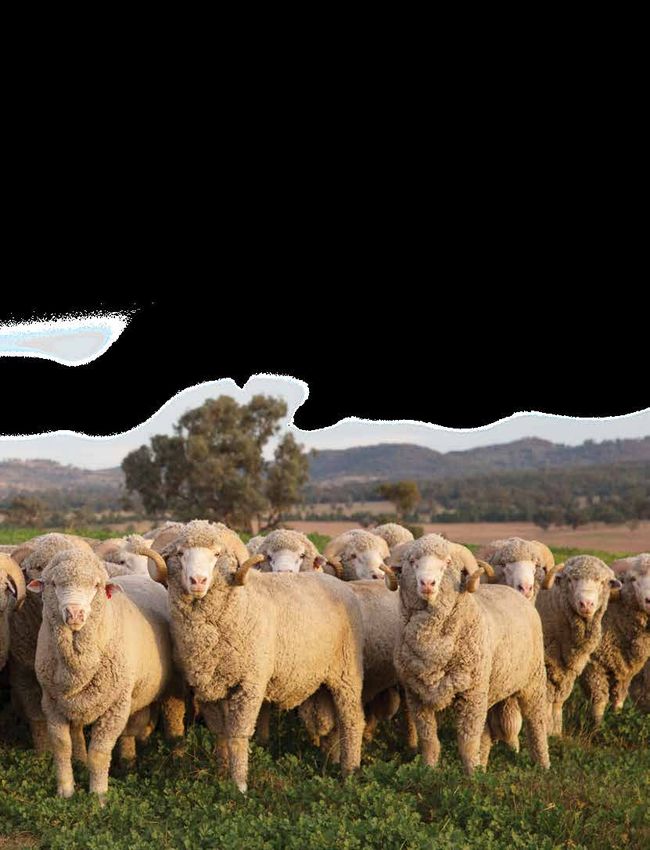
TABLE OF CONTENTS
National Wool Industry RD&E Strategy                     5. Plan governance
2018-20223
                                                           5.1 Guiding principles                      21
Acronyms5
                                                           5.2 Oversight                               21
1. Introduction                                    6      5.3 Role of major, link and support agencies 22

2. Wool industry situation analysis – at a glance          5.4 Monitoring, evaluation and reporting    22

   2.1 	Australian wool’s place as a world              6. Appendices
        textile fibre7
                                                           Appendix 1: Process to develop this Strategy 23
   2.2 Wool harvesting and selling                 7
                                                           Appendix 2: Situation analysis              26
   2.3 Flock size, production and producers        8
                                                              A1.1 G
                                                                    lobal and Australian wool
   2.4 Future drivers                              8              industry trends                     26

3. Wool RD&E situation analysis                               A1.2 Wool harvesting and selling         36

   3.1 Wool RD&E investment and capability         10        A1.3 Australian sheep industry
                                                                    demographics – two decades
   3.2	Industry and government                                     in transition37
        RD&E priorities                            10
                                                           Appendix 3: Future wool industry scenarios 43
4. Strategic direction for National Wool RD&E
                                                           Appendix 4: Resources available for
   4.1 Vision                                      14     Wool RD&E                                   48
   4.2 N
        ational Wool RD&E Program                            A4.1 Investment                          48
       Framework 2018-202214
                                                              A4.2 Human resources                     49
      Program 1: Increase productivity             15
                                                              A4.3 Facilities                          52
      Program 2: Optimise adoption                 16
                                                              A4.4 Flocks                              52
      Program 3: Build capacity and confidence 16
                                                              A4.5 Adoption/extension/
      Program 4: Manage risks, exploit                              communication resources54
      opportunities16
                                                           Appendix 5: Industry and government
      Program 5: Strengthen the value chain        17     RD&E priorities69
       rogram 6: Support wool’s
      P                                                       A5.1 N
                                                                    ational Research Priorities
      market positioning17                                        (Australian Government)69
   4.3 	Alignment with sheepmeat                             A5.2 National Wool RD&E Strategy         69
       industry RD&E                               18
                                                              A5.3 A comparison of plans               69
   4.4 	Alignment with new National Rural
       RD&E priorities	                            19

                                                                                                              3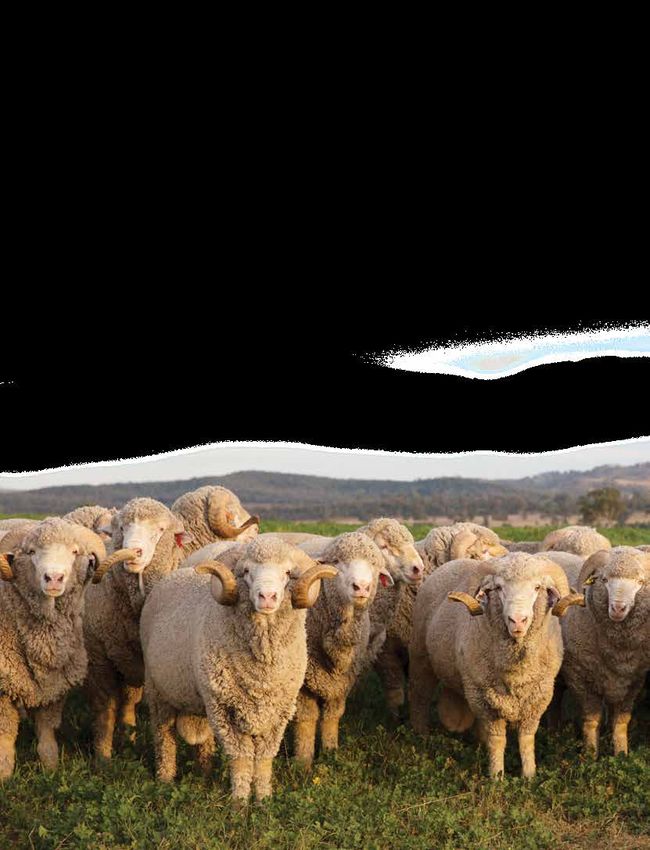
NATIONAL WOOL INDUSTRY RD&E
    STRATEGY 2018-2022
    The focus of this National Wool Industry RD&E Strategy is to help guide investments to increase the value
    of the sheep and wool industry to the Australian economy and to Australian wool producers. The following
    diagram summarises the key targets of the Strategy:

              Vic $2.1bn in 2016         2016 dollars                          SA $982.1m in 2016

             NSW $1.7bn in 2016               National GVAP from               TAS $170.6m in 2016
                                              sheep maintained in
                                              real terms between
              WA $1.2bn in 2016                 2016 and 2030                 QLD $120.4m in 2016

     1. Productivity: by 2030 marking rates increase 0.5% pa;
        Merino survival rates increase by 0.2% pa (lamb), 0.13%
        (hogget); 0.1% (adult); proportion hogget ewes mated
        increase by 0.5% pa; average cut/head maintained at 4.5kg;
        overall sheep numbers increase by 0.7% pa

     2. Adoption: by 2022 25% of Merino ewes managed using
        LTEM recommendations, number of Merino ewes scanned
        and differentially managed increase from 25% to 34%, 50%
        of Merino producers using genetic tools in ram purchases
                                                                               – Sheepmeat specific RDE
     3. Capacity and confidence: by 2022 producer confidence in
                                                                                   – Wool and meat
        industry increases, new labour saving technologies available
                                                                                  marketing activities

     4. Risk management: by 2022 producers have tools to comply                – Market access and trade
        with health and welfare standards, 80% of producers have                 liberalisation activities
        knowledge and skills to manage climate variability,
        investment in biosecurity sufficient for EADRP

     5. Value chain: by 2022 testing/wool selling costs at or below
        2015 levels, relative cost of wool harvesting below 2015
        level, 90% of wool sold with NWD

     6. Market positioning: by 2022 improve wool's environmental
        footprint rating

4
ACRONYMS

AGSOC      Agriculture Senior Officials’ Committee

AWI        Australian Wool Innovation

AWET       Australian Wool Education Trust

AWEX       Australian Wool Exchange

AWTA       Australian Wool Testing Authority

CSIRO      Commonwealth Scientific and Industrial Research Organisation

CSU        Charles Sturt University

DAFWA      Department of Agriculture and Food WA

DEDJTR     Department of Economic Development, Jobs, Transport and Resources (Vic)

DPIRD      Department of Primary Industries and Regional Development (WA)

EADRP      Emergency Animal Disease Emergency Response Plan

EMI        Eastern Market Indicator (of wool price)

FAWO       Federation of Australian Wool Organisations

FTE        Fulltime employee (equivalents)

GVAP       Gross value of agricultural production

MLA        Meat & Livestock Australia

NSW DPI    New South Wales Department of Primary Industries

NWD        National Wool Declaration

PIRSA      Department of Primary Industries and Regions, South Australia

QDAF       Queensland Department of Agriculture and Fisheries

RD&E       Research, Development and Extension

SARDI      South Australian Research and Development Institute

Sheep CRC Sheep Cooperative Research Centre

SISP       Sheepmeat Industry Strategic Plan

TIA        Tasmanian Institute of Agriculture

UNE        University of New England

UWA        University of Western Australia

WPA        Wool Producers Australia

                                                                                     5
01

    INTRODUCTION

    The original National Wool RD&E Strategy was                      The purpose of this Strategy is to establish a
    published in June 2011. It was developed under the                framework to guide investment in RD&E so that the
    National Primary Industries Research,                             Australian wool industry can:
    Development and Extension (RD&E) Framework,
    as one of 14 sectoral and four cross-sectoral                     –– Identify its RD&E priorities and future direction;
    strategies created to ‘encourage greater
    collaboration and promote continuous                              –– Clarify the linkages between existing R&D
    improvement in the investment of RD&E resources                      and industry-sector strategies, and other
    nationally’¹.                                                        relevant documents;

    This revised version of the Strategy was published                –– Have the tools, resources and information
    in April 2018, following a comprehensive review                      available in the future to enable informed
    process overseen by a Steering Group of the                          decision making;
    parties to the Strategy. A description of the process
    adopted for the re-write and the organisations                    –– Monitor and evaluate its RD&E programs;
    involved is provided in Appendix 1.
                                                                      –– Support national priority needs (e.g. emergency
                                                                         management, market access); and

                                                                      –– Maintain and improve market access and
                                                                         consumer confidence.

    1 www.agriculture.gov.au/ag-farm-food/innovation/national-primary-industries

6
02

WOOL INDUSTRY SITUATION
ANALYSIS – AT A GLANCE
A comprehensive situation analysis is included as       –– One factor which has had an influence on the
Appendix 2 to this report. Key components of that          demand for wool and on wool prices in the past
analysis are:                                              is the relative prices for competing fibres,
                                                           notably cotton and synthetic fibres. However, the
2.1 AUSTRALIAN WOOL’S PLACE AS                             impact of the relative price of these competing
A WORLD TEXTILE FIBRE                                      fibres appears to have waned.

–– Wool production has been falling globally due to     –– Based on global trade data, knitwear and men’s
   low prices and perceived higher profitability of        suits, jackets and trousers provide a solid
   other enterprises, notably cropping and                 foundation for wool use, while wool’s volume
   lamb production.                                        and share in most women’s wovenwear has
                                                           been eroded by price competition and a trend to
–– Australian wool production and sheep numbers            ‘fast fashion’ retailing.
   have followed global trends. Shorn wool production
   in Australia fell from a record level of 1,029       –– Casualisation and active leisure wear are a
   mkg greasy in the 1989/90 season to 325 mkg             natural fit for Australia’s growing superfine
   greasy in 2015/16.                                      wool component.

–– However, after two decades of decline, global        –– These opportunities, as well as sustained
   wool production has stabilised over the past            consumption in the major advanced economies,
   seven years at around 1,100-1,150 mkg clean.            will be aided by promotion of wool to
                                                           consumers. The latter will be needed to
–– While world wool production and sheep                   highlight the value attributes of wool products
   numbers have stabilised, world production of            targeted at their key requirements.
   other fibres, particularly of man-made fibres,
   continues to grow.                                   2.2 WOOL HARVESTING AND SELLING

–– The Australian wool clip has been trending           –– The aggregate cost of harvesting wool from the
   genetically finer since the early 1990s with a          sheep’s back through to delivery to the ‘mill
   significant shift towards production of superfine       door’ in 2013/14 was around $2.63/kg greasy.
   wool (18.5 micron and finer), away from medium          This is 12% higher than the level it was four
   Merino wool (21 to 23 micron). There has also           years previous in 2009/10.
   been an increase in production of crossbred and
   broader wool.                                        –– Shearing remains the most significant cost for
                                                           growers in delivering their wool from the
–– Demand for wool continues to be at the mercy            sheep’s back to the mill and accounts for 64% of
   of macro-forces which are outside the control           these total costs and around one quarter of the
   and influence of wool producers. Consumer               average price received at auction.
   demand for wool products is significantly
   influenced by local economic conditions, fashion
   trends, retail prices and competition from
   products of other fibres.

                                                                                                               7
02

    –– The total selling costs (i.e. between shearing                   –– Over three decades to 2011, the number of
       shed door and ship’s rail) in 2013/14 amounted                      farmers in Australia declined 40% while the
       to $0.95/kg greasy or $167/bale (transport,                         median age increased by nine years to 53, with
       warehousing, testing charges, insurance,                            the proportion of farmers under 55 years of age
       selling and buying commissions, showfloor                           diminishing considerably.
       costs, AWEX fees, Wool Levy).
                                                                        –– There is a significant ongoing change in the
    –– Total wool harvesting and selling costs                             provision of support services (especially
       amounted to 38% of the average price received                       extension and advice) for farmers – moving
       at auction.                                                         from the public to the private sector.

    –– 85 to 90% of Australia’s wool is sold at auction.                2.4 FUTURE DRIVERS
    2.3 FLOCK SIZE, PRODUCTION                                          In early 2015, the NSW Government received a
    AND PRODUCERS                                                       report entitled ‘NSW Wool Industry and Future
                                                                        Opportunities’2 which considered what the NSW
    –– Between 1990 and 2015, the Australian sheep                      wool industry might look like in 2025, and how
       population declined from 170 million to                          producers, industry and NSW Government
       70 million, an overall decline of nearly 60%.                    should respond to address challenges and
                                                                        embrace opportunities.
    –– Breeding ewes and lambs have increased as
       a proportion of the flock at the expense of                      While the focus of that report was the NSW wool
       wethers as sheep meat has risen in importance                    industry, the issues and implications are equally
       as a revenue stream.                                             applicable to the entire Australian wool industry.

    –– Merino ewes, however, still account for about                    That review included a situation analysis of the
       three quarters of all breeding ewes.                             wool industry of 2014/15, which has been
                                                                        incorporated into this Strategy. The analysis also
    –– Between 1991 and 2000, the number of                             sought to identify the drivers of change in the
       specialist sheep producers declined as they quit                 wool industry over the next decade. It strongly
       sheep or moved into cropping, and then from                      suggested that in 2025 the wool industry will be
       2000 onwards the number of specialist sheep                      shaped by the following key forces:
       producers remained almost unchanged while
       mixed enterprise producer numbers reduced as                     –– Price pressures from retail back to the producer
       farms were aggregated without increasing                            will remain intense – that is, producers’ terms of
       flock size.                                                         trade will continue to tighten.

    –– Lamb production has replaced mutton turn-off                     –– Production conditions will be more variable as
       resulting in an increase in product quality                         climate change takes hold.
       (and value).
                                                                        –– The trend towards casualisation in consumer
    –– The transition from a wool-driven sheep industry                    markets will continue, shifting demand away
       to a dual-product (wool plus lamb) industry is                      from some of wool’s traditional market
       reflected in the converging value of each                           segments and towards active-leisure wear.
       commodity where sheepmeat now has a higher
       gross value of production (GVP) than wool.
    2 	 NSW DPI (2015), ‘NSW Wool Industry and Future Opportunities’. A report to NSW DPI from Miracle Dog, Poimena Analysis,
         Scott Williams Consulting and DAFWA

8
–– Product quality, provenance and sustainability
   will assume increasing importance, as will
   high animal welfare and ethical production
   standards, which will be required to maintain
   the industry’s social licence to operate.

–– Demand for sheepmeat will continue to grow,
   particularly from export markets.

Given these conditions, the NSW Report
hypothesised that it is likely that the successful
wool producer of 2025 will:

–– Determine the optimum balance between
   sheep and other enterprises on their farm,
   and between wool, sheep meat and livestock
   trading, based on a considered, well-informed
   and objective long-term view of the respective
   industries, resource capability and
   personal preferences.

–– Understand the target product segment for
   their annual wool production, such as the
   active-leisure knitwear sector, and structure
   their wool production and husbandry practices
   to produce wool with the specifications required   –– Participate in, and meet the standards of,
   by that main product segment.                         an Australian wool industry provenance/
                                                         sustainability scheme which has credibility in
–– Conduct annual production and financial               the eyes of customers in their target market
   analyses to monitor progress against business         for wool.
   plans, adjusting as needed.
                                                      –– Actively manage production and price risk
–– ‘Know what they need to know’ to successfully         through flock structure, stocking rate, feed
   run their business – and source these skills          conservation / fodder purchases and use of
   either by their own professional development,         price risk management tools.
   or by retaining expert advisers where needed.
                                                      –– Have sourced and structured the financial
–– Have in place a sheep genetic improvement             capacity required to put their plans into practice.
   program optimised to the enterprise mix of the
   business and target market segment(s).             –– Have developed and adopted a clear succession
                                                         plan in conjunction with their family and/or
–– Adopt a continuous improvement mindset                business partners.
   where productivity improvements are vigorously
   and relentlessly pursued.                          A listing of the brief scenarios developed for the
                                                      NSW Report is included as Appendix 3.

                                                                                                               9
03

     WOOL RD&E SITUATION ANALYSIS
     3.1 WOOL RD&E INVESTMENT                                              3.2 INDUSTRY AND GOVERNMENT
     AND CAPABILITY                                                        RD&E PRIORITIES

     In the preparation of this Strategy, a survey was                     A range of strategic and operational plans with
     undertaken to assess the level of investment,                         relevance to the wool industry exist across various
     human resources (and capability), facilities and                      industry organisations and agencies. An analysis
     flocks dedicated or in part available to the wool                     of these plans has been undertaken to assess
     industry. Full details are provided in Appendix 4.                    consistency across plans, especially in relation to
     As the degree of detail in reporting the level of                     how they align with the Commonwealth’s Rural
     investment in people and facilities / flocks varies                   Research and Development Priorities, as well as
     across timeframes, comparisons between plans                          with the existing Wool Industry National RD&E
     can be problematic. However, the survey and                           Strategy. A snapshot of the comparison of relevant
     anecdotal information indicate that³:                                 wool industry (and associated) plans is provided
                                                                           below in Table 1.
     –– Investment into wool RD&E across all
        jurisdictions is probably similar (or possibly                     A range of other documents were also reviewed
        reduced) in 2015 compared to 2011, in real terms.                  but are not included in the table. These include:

     –– The number of FTE employed in these areas                          –– ABARE (2009), ‘Promoting productivity in the
        has almost certainly reduced.                                         agriculture and food sector value chain: issues for
                                                                              R&D investment’ ABARE and BRS report for the
     –– The demographics of research and extension                            Rural R&D Council
        resources are reported (anecdotally and
        with some justification from the data) as                          –– AWI (2015), Presentation to RMCIC Meeting, June
        skewed towards ‘closer to retirement than
        commencement’.                                                     –– NSW DPI (2015), NSW Wool Industry and Future
                                                                              Opportunities. A report to the NSW Department
     –– Most of the reduction in resources between 2011                       of Primary Industries from Miracle Dog,
        and 2015 has been in publicly-funded extension.                       Poimena Analysis, Scott Williams Consulting
                                                                              and DAFWA
     –– Available facilities for wool RD&E remain very
        similar in 2015 compared to 2011, as do the                        –– PIRSA (2013), South Australian Sheep and Wool
        number of flocks.                                                     Industry ScoreCard Overview 2013-14

     –– The likely retention of all flocks except for                      –– PISC (2010), National Beef Production RD&E
        one in NSW (Glen Innes) demonstrates                                  Strategy. Primary Industries Standing
        ongoing commitment to wool research by                                Committee – R&D Sub-Committee, January
        Australian institutions.
                                                                           –– RIRDC (2014), Assessing the competitiveness of
     –– With reducing extension personnel being                               Australian Agriculture – Summary
        employed within the public sector, there
        appears to be an increase in private sector                        –– RIRDC & CSIRO (2015), Rural industry futures
        consultants available (a list of these consultants                    - Megatrends impacting Australian agriculture
        was compiled in the preparation of this plan).                        over the coming twenty years. Stefan Hajkowicz
                                                                              and Sandra Eady
     –– However, the overall reduction in human
        resources across all RD&E areas has negative
        consequences for the future capacity and
        capability within this sector.

     3 	 Institutions appear to have interpreted the request for information in different ways, so the raw data sometimes appear anomalous.
          For example, in some cases wool and sheepmeat RD&E have been combined.
10
–– RMCIC (2014), Sheep and Beef Extension – a vision –– Soil, water and managing natural resources,
and framework for future investment. Discussion to manage soil health, improve water use
Paper – Version 2 efficiency and certainty of supply, sustainably
develop new production areas and improve
–– TFGA (2014), The Tasmanian Red Meat Industry resilience to climate events and impacts; and
Strategic Plan
–– Adoption of R&D, focussing on flexible delivery
The Universities involved in the wool industry of extension services that meet primary
through both on- and off-farm RD&E tend not to producers’ needs and recognising the growing
have documented strategic priorities. Research role of private service delivery.
groups at Universities are typically formed along
discipline lines (genetics, nutrition, health, The Government notes that, while these priorities
reproduction, etc) across species. do not cover all of the important issues facing
primary production (and are not designed to be
There are also a range of other national plans with extensive or exclusive), they are the highest priority
which the wool industry engages, including: areas based on stakeholder feedback.
–– National Primary Industries Animal Welfare In May 2015, the Federal Government also released
RD&E Framework a broad set of Science and Research Priorities, and
corresponding Practical Research Challenges.
–– Climate Change Research Strategy for Primary These priorities and challenges have been
Industries: RD&E Strategy developed to ‘increase investment in areas of
immediate and critical importance to Australia and its
–– (National Primary RD&E Framework) Animal place in the world’⁵ and cover the following topics:
Biosecurity RD&E Strategy
–– Food (including fibre);
–– Australian Wool Industry Emergency Animal
Disease Preparedness RD&E Strategy. –– Soil and water;
The National Rural Research and Development –– Transport;
Priorities listed in Table 1 focus on advanced
technology; biosecurity; soil, water and management –– Cybersecurity;
of natural resources; and the adoption of R&D’⁴.
–– Energy;
The priorities are:
–– Resources;
–– Advanced technology, to enhance innovation
of products, processes and practices across –– Advanced manufacturing;
the food and fibre supply chains through
technologies such as robotics, digitisation, –– Environmental change; and
big data, genetics and precision agriculture;
–– Health.
–– Biosecurity, to improve understanding and
evidence of pest and disease pathways to help
direct biosecurity resources to their best uses,
minimising biosecurity threats and improving
market access for primary producers;
4 http://agriculture.gov.au/ag-farm-food/innovation/priorities
5 http://science.gov.au/scienceGov/ScienceAndResearchPriorities/Pages/default.aspx
1103
TABLE 1: A COMPARISON OF PREVIOUS AND EXISTING WOOL-RELATED RD&E PLANS
ALIGNMENT OF WOOL RELATED RD&E STRATEGIES
PROGRAM 2: PROGRAM 3:
PROGRAM 1: WOOL SUPPLY CHAIN WOOL INDUSTRY
WOOL MANAGEMENT AND RESILIENCE
STRATEGY PRODUCTION DEMAND GROWTH AND GROWTH
through effective biosecurity systems
through reducing post-harvest costs
2.2 Improving supply chain logistics
production – labour, market specs,
2.1 Innovating product, processing
1.4 Improving wool harvesting and
1.2 Accelerating genetic gains of
carbon markets, industry skills
and enhanced product integrity
confidence in woollen products
on-farm management for wool
and improving selling systems
resiliance – climate variability,
3.2 Enhancing wool enterprise
1.3 Enhancing welfare of wool
3.1 Protecting market access
2.3 Strengthening consumer
delivering new products and
and manufacturing through
1.1 Attaining best practice
parasites, reproduction
enhancing efficiency
producing sheep
merino sheep
clip quality
Sub-Strategy
National Wool RD&E Plan 2011-2030 ü ü ü ü ü ü ü ü ü
AWI Strategic Plan 2016/17 – 2016/19
ü ü ü ü ü ü ü ü ü
Sheepmeat Industry Strategic Plan
SISP 2020 ü ü ü ü ü
Sheep CRC Operational Plan 2015/16
ü ü ü ü
Animal Health Australia Strategic Plan
2015-2020 ü ü ü ü ü
WA Sheep Industry Strategic Plan
2025+ ü ü ü ü ü ü
Victoria Sheep & Beef Industries
ü ü ü ü ü ü
Investment Plan 2015-2019
NSW Sheet Industries Strategic
ü ü ü ü ü ü
Direction 2014 to 2019
SA Sheep Industry Blueprint
ü ü ü ü ü
Charles Sturt University ü
National Rural Research & Adoption of R&D Supply chain and markets Bio- Soil, water and
Development Priorities (previous) security natural resour
Advanced Technology
12Some observations from this comparison are:
–– Collectively, the various wool strategic and
OTHER AREAS operational plans fully cover all of the previous
COVERED BY PLANS Rural R&D Priorities (for a comparison of this
new National Wool RD&E plan with the new
Government R&D priorities see sections 4.4).
3.4 Building wool industry strategic
sustainable wool enterprises –
–– The strategies and sub-strategies of the
pasture productivity and NRM
thinking – value propositions
3.3 Building environmentally
National Wool RD&E Strategy 2011-30 are also
fully covered by the various wool strategic and
operational plans.
–– As expected, AWI’s Strategic Plan 2016/17 –
2018/19 has the broadest scope of all plans.
12
–– Other plans align well with the AWI Strategic
Plan except in the areas of:
ü ü Previous plan
Significant coverage of marketing, business • Innovating product, processing and
ü ü intelligence, coprporate affairs, Woolmark manufacturing through delivering new
and corporate services products and enhancing efficiency, and
Sheepmeat focus - Marketing and promotion,
ü ü product (meat) quality and integrity systems, • Strengthening consumer confidence in
processing and live exports woollen products.
Quality-based sheepmeat value chains;
estimating carcase values based on lean This is to be expected given the low existing
ü capacity in Australia.
meat yield and eating quality; yearling
Merino and large lamb grading
–– Many associated plans cover all aspects of the
sheep industry – that is, both sheepmeat and
wool – while others also cover other broadacre
WA sheep industry brand, communication
pursuits such as beef cattle.
ü and promotion: Industry leadership, skills
and capacity
Also covers beef industry
ü ü
Considerable focus on sheep meat, with
ü ü
strong links to Sheep CRC
Vision is 'increase industry productivity and
ü ü value by 20% by 2020. Also SA Sheep &
Wool Industry Scorecard
Specialist in mixed farming systems
d managing
rces
1304
STRATEGIC DIRECTION FOR
NATIONAL WOOL RD&E
4.1 VISION PROGRAM 1: INCREASE PRODUCTIVITY
Rationale:
A profitable and sustainable Australian wool
industry producing the world’s best natural fibre. Innovation drives the prosperity of every industry.
R&D to deliver new products and processes is
The objective for the Australian sheep industry critical to ensuring wool remains a competitive
is to maintain the gross value of agricultural textile fibre, and the wool industry is profitable and
production (GVAP) of sheep at 2017 levels in real satisfying for all participants. This program seeks
terms through to 2030. to increase the productivity and hence profitability
of wool producers.
To achieve this vision will require a highly efficient
and effective wool RD&E sector, undertaking Activities:
collaborative investment and capability planning,
to develop and deliver technology and systems that Priorities for R&D investment over the life of this
improve productivity through R&D and adoption; plan are:
develop the industry’s people; manage industry
risks; strengthen the value chain; and support –– Reproductive performance, especially of
wool’s positioning in markets globally. the Merino;
4.2 NATIONAL WOOL RD&E PROGRAM –– Survival rates, especially in ewes, lambs
FRAMEWORK 2018-2022 and weaners;
The following programs have been identified as –– Reduced predation of sheep;
priorities for wool RD&E investment over the next
five years. Programs are articulated at a high level –– Running the right sheep for the enterprise,
to provide the flexibility to exploit good ideas as achieved largely through breeding decisions;
they arise, while at the same time making clear the
RD&E priorities of the industry. –– New options for sheep in the cereal zone; and
These programs cover only those areas in which –– Greater understanding of breed demographic
there is cross-organisational investment among shifts and the impacts on wool production
the parties to the plan. Areas such as new wool and productivity.
product development, which is the remit of AWI
and textile industry partners, are not included in
this plan.
14Key performance indicators6: between different broadacre enterprises. These
differences are due to the adoption or non-adoption
Over the life of this plan and to 2030: of practices proven to improve profitability or
reduce risk.
1. Average marking rates will increase by 0.5%
per annum Activities:
2. Average Merino hogget survival rate will Projects will be undertaken to enhance the
increase by 0.13% per annum⁷ adoption of proven practices guided by sound
decision-making. Consistent with the priorities
3. Average Merino lamb survival rate will increase identified in Program 1, practice adoption priorities
by 0.2% per annum include (but are not limited to) those that optimise
the management of the breeding flock – such as
4. Average adult sheep survival will increase by targeted nutrition, use of scanning, individual
0.1% per annum animal management and the application of the
most current quantitative genetic and genomic data
5. The proportion of hogget ewes mated will and tools.
increase by 0.5% per annum (from 10% to
17.5% in 2029-30) Key performance indicators:
6. The average wool cut per head will be By 2022:
maintained at 4.5 kg (2014-15 base) or
will increase 1. 25% of Merino ewes will be managed
using the recommendations of Lifetime
7. These targets will collectively result in a 0.7% Ewe Management8
p.a. increase in sheep numbers
2. The number of Merino ewes that are scanned
PROGRAM 2: OPTIMISE ADOPTION for litter status and differentially managed to aid
Rationale: reproductive performance will increase from
25% to 34%9
The outcomes of Program 1, and of the R&D
conducted over many decades in the wool industry, 3. 50% of Merino producers will be using genetic
are of little value unless they are appropriately tools (e.g. Australian Sheep Breeding Values,
adopted by industry participants. There are much Merino Superior Sires, wether trial data) in ram
greater differences in performance between purchase decisions10
top-performing and average wool enterprises than
6 These KPIs have been based on a combination of information taken from Young, J. (2016) “Meta-Target Outcomes for the AWI
Reproduction Strategic Plan” and Thompson AN, Trompf J, Young JM (2016). Reproduction Strategic Plan. AWI Internal document,
along with assumptions within the modelling work of Curtis, K (Unpublished)
7 Current survival rates are: Merino hogget 94%; Merino lamb 92%; and adult 96%
8 Thompson, A (2016) pers. communication
9 Thompson, A (2016) pers. communication: Assumes that in 2016, 32% of Merino ewes are scanned for multiples, and around 80% of
those differentially managed = 25.6 of ewes differentially managed. Assumes target increase to 33-35% (which would mean an 8%
increase in total % ewes scanned for multiples and a 5% increase in the % of those differentially managed)
10 Combination of opinions and data from AWI, NSW DPI, DAFWA and the Sheep CRC
1504
PROGRAM 3: BUILD CAPACITY AND CONFIDENCE PROGRAM 4: MANAGE RISKS,
EXPLOIT OPPORTUNITIES
Rationale:
Rationale:
Farming is an increasingly complex business
demanding multiple skills, many of which have not The wool industry faces a number of serious risks
traditionally been associated with agriculture, such to its capacity to operate, its domestic social
as business planning, procurement and price risk licence and its consumer acceptance. Such
management. The success of the wool industry risks include:
relies heavily upon its participants having the
capacity and confidence to build profitable and –– Changing climate, droughts, floods etc.;
sustainable enterprises. This strategy is closely
aligned with and an enabler of Program 2. –– Pests and weeds;
The future success of the industry also relies on –– Emergency animal diseases;
the ongoing availability of skilled researchers and
extension/training experts, especially given the –– Consumer responses to animal welfare
aging profile of current resources. and management
Activities: Collective action is important to manage these
risks as effectively as possible. With an effective
Investments will be made in activities that build approach, some risks become opportunities –
skills in business management, risk management for example, wool production can be a key risk
and resilience, workplace (physical and mental) management tool for landholders in conjunction
health and safety, succession planning, leadership with cropping as climate variability increases.
and related areas. A key area of investment will be
labour savings and efficiency, included here rather Activities:
than in Program 1 because it can reduce stress
and aversion to sheep as an enterprise. Activities under this strategy seek to reduce the
chance of occurrence, or mitigate any impacts
Key performance indicators: that do eventuate, in relation to key industry risks.
Priorities for industry-level risk management are
By 2022: in the areas of animal welfare, climate change
and variability, and emergency and endemic
1. As a result of capacity building programs, animal disease.
producer confidence in the sheep industry
will increase Key performance indicators:
2. New labour-saving technologies will be By 2022:
available for use by producers
1. Australian producers have the tools and
know-how to enable compliance with relevant
domestic and international guidelines for
sheep health and welfare
162. 80% of producers have the knowledge and PROGRAM 6: SUPPORT WOOL’S
skills to better manage the effects of MARKET POSITIONING
climate variability
Rationale:
3. Investments in biosecurity research and
Wool is a premium product occupying a small
diagnostic capacity are maintained at a level
niche of the textile market. Like any differentiated
sufficient to allow industry to respond as
product, its success relies on strong positioning
required under the Emergency Animal Disease
underpinned by credible evidence to support that
Response Plan
positioning. AWI’s marketing campaigns and those
of many downstream players seek to emphasise
PROGRAM 5: STRENGTHEN THE VALUE CHAIN
the many qualities of wool. There is an important
Rationale: role for R&D to support these market propositions.
Developments in information and communication Activities:
technology offer opportunities to greatly improve
the flow of products and data throughout the value Activities under this strategy will be focused on
chain. Greater exchange of data between industry wool’s key competitive strengths, including its
participants will deliver efficiency in product naturalness, ecological credentials, health
description and feedback as well as traceability, benefits (sleep, skin health) and functional
important for Program 4. benefits (next-to-skin comfort, active cooling etc).
Activities: Key performance indicators:
The strategy will involve investments in areas By 2022:
such as wool harvesting, wool sampling and
testing, classing, bale identification and wool 1. Improve wool's environmental footprint rating
selling systems.
2. Evidence of and specifications for:
Key performance indicators:
- wool next to skin garments to ameliorate
By 2022: chronic skin condition
1. The costs associated with testing and the - wool bedding and sleepwear improves sleep
management of wool selling systems has been
maintained at or reduced from 2015 levels - safety benefits of wool
2. The relative cost of wool harvesting
(average c/kg) has been reduced from the
2015 benchmark
3. At least 90% of all wool sold is covered by the
National Wool Declaration (NWD)
1704
4.3 ALIGNMENT WITH SHEEPMEAT INDUSTRY RD&E
The National Wool RD&E Strategy has been developed with close attention to the Sheepmeat Industry
Strategic Plan 2015-2030 (SISP) in order to maximise alignment, and minimise duplication, between the
two streams of RD&E.
Table 2 maps the National Wool RD&E Programs to the corresponding elements of the SISP.
TABLE 2: COMPARISON OF NATIONAL WOOL RD&E PROGRAMS AND THE SISP.
WOOL RD&E
STRATEGY SISP COMMON OPPORTUNITIES
Program 1: Theme 1: Wellbeing of the animals within our care – R&D, especially in:
Increase productivity Imperative 2: Minimising the impacts of endemic –– Reproductive performance
animal disease –– Genetics
Theme 8: Production efficiency in farms and in –– Animal health and welfare
intensive finishing systems – Imperative 2: Increasing –– Feed base and grazing
livestock productivity through new research management
Program 2: Theme 8: Production efficiency in farms and in Adoption resources and delivery
Optimise adoption intensive finishing systems – Imperative 1: Systems vehicles – recognising the ‘one
support to improve the farm business sheep’ industry
Program 3: Theme 11: Capability and capacity for the Skills (including leadership)
Build capacity industry’s future development – resources and
and confidence delivery vehicles
Program 4: Theme 1: Wellbeing of the animals within our care – RD&E and associated activities
Manage risks, Imperative 1: Continuous improvement of sheep health (such as QA programs) addressing:
exploit opportunities and wellbeing and Imperative 2: Minimising risk and –– Animal welfare
impact of emergency disease on the sheep industry –– Biosecurity
Theme 2: Stewardship of our environmental resources –– Environmental management
Program 5: Theme 7: Guaranteeing product and systems integrity Improvement of systems to track
Strengthen the sheep and products, and facilitate
value chain flows of useful data such as disease
prevalence
Program 6: Theme 1: Wellbeing of the animals within our care – RD&E and associated activities
Support wool’s Imperative 1: Continuous improvement of sheep health (such as QA programs) addressing:
market positioning and wellbeing and Imperative 2: Minimising risk and –– Animal welfare
impact of emergency disease on the sheep industry –– Environmental management
Theme 2: Stewardship of our environmental resources
184.4 ALIGNMENT WITH NATIONAL RURAL RD&E PRIORITIES
The National Wool RD&E Strategy has also been developed with close attention to the Federal
Government’s Rural R&D Priorities. These are mapped against the National Wool RD&E Programs in
Table 3.
TABLE 3: COMPARISON OF NATIONAL WOOL RD&E PROGRAMS AND THE GOVERNMENT’S
RURAL R&D PRIORITIES.
WOOL RD&E
STRATEGY RURAL R&D PRIORITIES COMMON OPPORTUNITIES
Program 1: Advanced technology, to enhance innovation of R&D, especially in:
Increase productivity products, processes and practices across the food –– Reproductive performance
and fibre supply chains through technologies such –– Genetics
as robotics, digitisation, big data, genetics and –– Animal health and welfare
precision agriculture –– Feed base and grazing
management
–– Precision agriculture
Program 2: Adoption of R&D, focussing on flexible delivery of Directly related and identified as a
Optimise adoption extension services that meet primary producers key priority
needs and recognising the growing role of private
service delivery
Program 3: Advanced technology, to enhance innovation of A combination of skills development
Build capacity products, processes and practices across the food but also labour saving technologies,
and confidence and fibre supply chains through technologies such listed here as well as within
as robotics, digitisation, big data, genetics and Program 1
precision agriculture
Program 4: Biosecurity, to improve understanding and RD&E and associated activities
Manage risks, evidence of pest and disease pathways to help direct addressing:
exploit opportunities biosecurity resources to their best uses, minimising –– Biosecurity
biosecurity threats and improving market access –– Climate variability
for primary producers –– Natural resources
Also: –– Market access
Soil, water and managing natural resources, to
manage soil health, improve water use efficiency
and certainty of supply, sustainably develop new
production areas and improve resilience to climate
events and impacts
1904
TABLE 3: COMPARISON OF NATIONAL WOOL RD&E PROGRAMS AND THE GOVERNMENT’S
RURAL R&D PRIORITIES. (CONTINUED)
WOOL RD&E
STRATEGY RURAL R&D PRIORITIES COMMON OPPORTUNITIES
Program 5: Advanced technology, to enhance innovation of Improvement of systems to track
Strengthen the products, processes and practices across the food sheep and products, and facilitate
value chain and fibre supply chains through technologies such flows of useful data such as
as robotics, digitisation, big data, genetics and disease prevalence
precision agriculture
Program 6: Advanced technology, to enhance innovation of New product development will
Support wool’s products, processes and practices across the food involve innovation of products
market positioning and fibre supply chains through technologies such and processes
as robotics, digitisation, big data, genetics and
precision agriculture
2005
PLAN GOVERNANCE
5.1 GUIDING PRINCIPLES 5.2 OVERSIGHT
The guiding principles for the implementation of A significant difference between this Strategy and
this Strategy, especially co-investment in projects, its 2011 predecessor has been the need to work
are as follows: towards improved collaboration in the current
Strategy. To assist this, the Strategy will be
1. Participation in this Plan represents a genuine overseen by a Committee comprising a selected
commitment by each party to contribute actual group of woolgrowers plus representatives of:
and appropriate resources to joint projects.
–– Wool Producers Australia (WPA);
2. The autonomous governance arrangements of
wool industry RD&E participants will not be –– Federation of Australian Wool Organisations
superseded by any overarching collaborative (FAWO);
governance arrangement.
–– State agencies;
3. Contributing parties to the agreement will fund
their participation in consultation and –– State Sheep Industry Councils, where applicable;
collaboration processes.
–– Universities;
4. Parties will choose whether and how much
to co-invest in projects on a case-by-case –– CSIRO;
basis depending on their specific priorities
and reflecting their relative public/private –– Australian Wool Exchange (AWEX);
responsibilities.
–– Australian Wool Testing Authority (AWTA);
5. Staff time and other non-cash resources will be
appropriately valued and respected by all parties. –– Meat & Livestock Australia (MLA); and
6. Every potential project will need to have its –– AWI.
value to woolgrowers clearly articulated, a clear
path to market and a monitoring and evaluation The Committee will meet three or four times per
component built into it from inception. year at times providing appropriate alignment with
the AWI and MLA planning and project call
7. Every effort will be made to ensure that projects processes. The Chair of the Committee and hosting
do not crowd out the private sector participation of meetings will be rotated among members by
and investment. mutual agreement. AWI will resource a Committee
secretariat to assist with meeting organisation,
8. The Wool RD&E Program Framework will not including the distribution of papers and preparation
duplicate cross-sector strategy investments, of minutes.
such as those that occur under the National
Primary Industries Animal Welfare or The terms of reference for this Committee will be
Biosecurity RD&E Strategies. determined by the Committee but should include:
9. Wool RD&E will be complimentary and aligned –– Developing a detailed implementation plan for
as closely as possible with sheepmeat RD&E, the new national RD&E strategy, including
as set out in the SISP, to minimise duplication agreements between parties for capability and
and maximise the benefits delivered to management arrangements and information
sheep producers. sharing, including IP;
2105
–– Establishing consultation arrangements with However, whether a state agency’s investment is at
stakeholders (including Agriculture Senior a major, support or link level will have no bearing
Officials’ Committee (AGSOC) agencies, on the role the agency plays in the oversight
Universities, RDCs etc.) and preparing a committee. An agency’s intention as to whether it
communication plan; and wishes to invest in wool RD&E at a major, support
or link level is an indication to the industry as to the
–– Establishing timeframes and responsibilities for level of general investment across agencies only.
all parties, including monitoring, reporting and
review (see below). The commitment from agencies to the role they
intend to play over the period 2018 to 2022 is shown
5.3 ROLE OF MAJOR, LINK AND in Table 4.
SUPPORT AGENCIES
Table 3: Role of partner AGSOC agencies in the
Under the National Primary Industries Research, implementation of this Strategy.
Development and Extension (RD&E) Framework,
partner agencies play either a major, support or AGENCY ROLE
link role depending on their level of commitment
and availability of resources. DPIRD Major
These definitions will continue to apply in the
2018-2022 National RD&E Wool Strategy. NSW DPI Support
Each individual government (States, Territories,
and Commonwealth) will perform either: SARDI Link
(a) A major national leadership role in which wool
QDAF Link
is a major priority for the relevant government,
and the government endeavours to give a
high priority to funding research, including 5.4 MONITORING, EVALUATION
infrastructure; or AND REPORTING
(b) A support role in which it undertakes some Objective monitoring, evaluation and reporting
research; or (MER) of progress against this Strategy will be a
high priority. As far as possible, MER will make use
(c) A link role in which it may undertake little or no of data sources already available to the parties
research but access information and resources such as producer surveys, with baseline values
from other jurisdictions or parties to meet established for 2016. The Committee will seek
industry needs by supporting industry adoption. opportunities to undertake MER in conjunction with
that of the SISP – for example, monitoring changes
in lamb marking rates. The MER framework for the
SISP was developed during 2015/16.
2206
APPENDICES
APPENDIX 1: PROCESS TO DEVELOP In brief, the process undertaken by the consultancy
THIS STRATEGY team was as follows:
This plan was prepared under the guidance of –– Review and collate all existing wool industry and
an industry steering committee. The steering related RD&E plans and documents.
committee was chaired by Mr Joe Sullivan (NSW
DPI) and comprised the following members. –– Undertake a stocktake of the human and
physical resources already being applied to
–– Paul Swan (AWI) wool RD&E, or with potential to be applied to it
if required, by the various providers.
–– Sue Hatcher (NSW DPI)
–– Undertake a wool industry situational analysis.
–– Jen Smith (CSIRO)
–– Prepare ‘straw man’ concepts for an
–– Emma Doyle (UNE) industry workshop.
–– Lyndon Kubeil (DEDJTR Vic) –– Facilitate an industry workshop to develop the
skeleton of a revised wool RD&E strategy.
–– Stephen Lee (SA Sheep Industry Blueprint
& Uni Adelaide) –– Convert the concepts from the industry
workshop into a draft strategy.
–– David Crowe (AWTA)
–– Utilise the outcomes from the sheep industry
–– Michael Blake (PIRSA) model to refine the plan’s KPIs.
–– Johan Greeff (DPIRD) The need to strengthen the science and rigour
behind the KPIs was identified at the draft strategy
–– Nicole Sallur (Q DPI) stage. Livestock Dynamics was contracted to
develop a GVP model for the sheep industry (wool
–– Andrew Johnston (WPA) and sheepmeat) in Australia. A summary of the key
components of the model is as follows:
–– Bruce Mullan (DPIRD)
–– The gross value of agricultural production for
–– Joe Keynes (SA Blueprint and WPA) wool has increased by 3.6% p.a. over the last
decade and by 6.8% for sheepmeat
The Strategy was prepared by Scott Williams of
Scott Williams Consulting and Russell Pattinson –– The wool industry contributes slightly under
of Miracle Dog. During the preparation of the 50% of Australia’s sheep production value
Strategy, extensive spreadsheet modelling based
on a range of sheep flock assumptions on
performance and demographics was expertly
prepared by Kimbal Curtis of Livestock Dynamics.
This modelling was fundamental to developing the
Strategy’s key performance indicators (KPIs).
2306
–– The model developed by Livestock Dynamics –– The model developed was tested by predicting
has three key elements: (hind-casting) ABS GVAP against model GVP for
meat+wool for the period 2009-10 to 2014-15
• Demographics:
–– A range of scenarios were tested:
–– Number of {ewes, wethers, rams}, {lambs,
hoggets, adults}, {Merino, other breed} • Baseline
–– Projects lambs marked, sheep and • ‘Steady state’ (S1) – no change in sheep
lambs slaughtered demographics, productivity or reproduction
–– Closing no. = Opening no. + Lambs • ‘Meat sector responds’ (S2) – favourable
marked – Slaughtered – Deaths responses for the meat sector – increases in
marking rate for first-cross (+0.5% p.a.) and
–– Closing number becomes opening meat breed (+1.0 p.a.) lambs
number for following year
• ‘Meat and wool respond’ (S3) – marking
• GVP calculations: rates for all breeds increases (3a = 0.4%,
3=0.5%, 3b = 0.6%), mortality decreases,
–– Gross value of production (GVP) = more Merino hoggets joined
GVP sheep meat + GVP wool
• ‘MISP and SISP’ (S6) – applying assumptions
–– GVP sheep meat = No. slaughtered x and model outputs from the development
Carcase wt. x Price (lamb and mutton of the Meat and Sheepmeat Industry
calculated separately and combined) Strategic Plans
–– GVP wool = Wool production x Yield x • ‘Disinvest in wool’ (S7) – flock remains static,
Eastern Market Indicator (EMI) more Merino slaughterings, reduced Merino
breeding ewes and fewer mated to
• Scenario data: Merino rams
–– Create scenarios by adjusting inputs –– The outputs from these models are shown
in the table below. The industry Steering
–– Productivity adjustments: Committee considered that Option 3b was the
•R
eproduction rate (marking rate), most realistic (although flock numbers were
Death rates quite high by 2030).
–– Management adjustments:
•S
laughter rates, Mix of ewes joined to
Merino versus other breed rams,
Hogget mating
24SCENARIO OUTPUTS FOR 2029-30
MEAT MEAT MEAT MEAT MEAT
MODELLED STEADY SECTOR & WOOL & WOOL & WOOL & WOOL MISP/ DISINVEST
BASELINE STATE RESPONDS RESPOND RESPOND RESPOND RESPOND SISP IN WOOL
SCENARIO (2014-15) ($1) ($2) ($3A) ($3) ($3.5) ($3B) ($6) ($7)
Sheep Opening No.
(SON, million head) 72.6 73.4 73.5 82.6 82.9 77 82.4 83 73.4
Wool production p.a.
(Mkg greasy) 320 320 306 352 352 323 355 342 247
Lamb slaughter p.a.
(million head) 15.6 16.3 17.7 23.0 22.8 22.1 22.8 23.0 22.1
Sheep slaughter p.a.
(million head) 7.5 7.4 7.6 6.6 6.8 6.0 6.8 6.8 6.1
GVP wool 2014-15 $2427M; $2,645M; $2,552M; $2,819M; $2,822M; $2,659M; $2,834M; $2,769M; $2,106M;
$s per head; per SON* $33.4 $36.0 $34.7 $34.1 $34.0 $34.5 $34.4 $33.4 $28.7
GVP meat 2014-15 $2,349M; $2,513M; $2,687M; $3,221M; $3,215M; $3,060; $3,2211M; $3,238M; $3,072M;
$s per head; per SON* $32.4 $34.2 $36.5 $39.0 $38.8 $39.8 $39.0 $39.0 $41.9
GVP total 2014-15 $5,158M; $5,240M; $6,040M; $6,037M; $5,718M; $6,045M; $6,006M; $5,178M;
$s per head $4,776M +8% +10% +26% +26% +20% +27% +26% +8%
Predicted EMI
(2014-15 $s/kg) $11.69 $12.73 $12.87 $12.35 $12.34 $12.70 $12.31 $12.47 $13.16
2506
APPENDIX 2: SITUATION ANALYSIS New Zealand and Uruguay have not seen any
stabilisation of sheep numbers where dairying has
A1.1 GLOBAL AND AUSTRALIAN WOOL taken over land previously used for sheep and in
INDUSTRY TRENDS particular Merino sheep. Argentina has also seen
sheep numbers continue to decline as the result
World sheep population starts to recover
of strong competition from cropping, mainly
World sheep numbers peaked in 1990 at 1,206 for soybeans.
million. Numbers then fell in most of the major
Decline in global wool production stabilises
sheep producing countries (figure 1), with the
exception of China and India where sheep numbers After two decades of decline, global wool
are higher than in 1990. The Commonwealth of production has stabilised over the past seven years
Independent States (CIS, Russia) has also seen a at around 1,100-1,150 mkg clean (figure 2). Global
recovery in sheep numbers over the past 15 years. wool production peaked at an all-time high of
More recently, the decline in sheep numbers has 2,006 mkg clean in the late 1980s in response to
been arrested mainly due to a strong demand for record price levels, excellent seasonal conditions
sheepmeat and interest in dual-purpose sheep in previous years in many countries and market
producing both meat and wool. World sheep intervention, notably with the Reserve Price
numbers fell to a low of 1,084 million in 2010, Scheme in Australia. World production then fell
and have recovered a little since then to be sharply as demand declined after a perfect storm
1,155 million in 2015. of the collapse of the Soviet Union, falling
Fig 1: Sheep Population in Selected Countries
200
160
120
Millions
80
40
0
China Australia CIS EU India New United Turkey South Argentina Brazil Uruguay
Zealand Kingdom Africa
1990 1995 2000 2005 2010 2015
Figure A2.1. Sheep population in selected countries, 1990, 1995, 2000, 2005, 2010 and 2015
(Source: International Wool Textile Organisation, Market Information 2015)
26economic growth in the major advanced in the 1990s and early 2000s and more recently due
economies and the Tiananmen Square incident to the change in focus among sheep producers
in China. This caused large stockpiles in Australia, away from wool-only breeds towards dual purpose
New Zealand and South Africa, and led to a and meat breeds. Production of apparel wool has
decade of relatively low wool prices. Between remained at around that low level since 2012.
1990 and 2009, world wool production fell by 44% As the figure shows, world production of wool used
to a low of 1,109 mkg clean as woolgrowers left in interior textiles also declined in the 1990s but
the industry for other agricultural enterprises, has remained at around 600 mkg clean since 2000.
notably cropping and dairying. Since then, world Production of interior textile wool exceeds that of
production has stabilised and in 2015 is expected apparel wool in 2008 and has remained higher
to be 1,160 mkg clean. since then. This situation is unlikely to change in
the foreseeable future.
The decline in global wool production has been felt
mainly in the production of wool typically used in
apparel end-uses, rather than in interior textiles
end-uses (figure 3). World production of apparel
wool is estimated to have fallen from a peak of
1,275 mkg clean in 1990 to a low of 537 mkg clean
in 2012. This decline was due to a stronger fall in
the prices for apparel wool, notably Merino wool,
Fig 2: World Wool Production
2,500
2,000
1,500
mkg clean
1,000
500
0
1980 1983 1986 1989 1992 1995 1998 2001 2004 2007 2010 2013 2016
Australia China New Zealand CIS India South Africa Other
Figure A2.2. World wool production 1980 to 2016f
(Source: International Wool Textile Organisation, Market Information 2015)
27You can also read