Indicator M3: Avian representation - Envirolink
←
→
Page content transcription
If your browser does not render page correctly, please read the page content below
Indicator M3: Avian representation
Indicator M3: Avian representation

Catriona MacLeod

Landcare Research

Excerpt from:

Bellingham PJ, Overton JM, Thomson FJ, MacLeod CJ, Holdaway RJ, Wiser SK, Brown M,
Gormley AM, Collins D, Latham DM, Bishop C, Rutledge D, Innes J, Warburton B 2016.
Standardised terrestrial biodiversity indicators for use by regional councils. Landcare
Research Contract Report LC2109.

Prepared for:

Regional Councils’ Biodiversity Monitoring Working Group

Auckland Council
Bledisloe Building, Level 2 South
24 Wellesly St
Auckland Central

August 2016

Landcare Research, Gerald Street, PO Box 69040, Lincoln 7640, New Zealand,
Ph +64 3 321 9999, Fax +64 3 321 9998, www.landcareresearch.co.nz
Reviewed by: Deb Wilson, Landcare Research
 Philippa Crisp, Greater Wellington Regional Council

Approved for release by: Fiona Carswell
 Portfolio Leader – Enhancing Biodiversity Landcare Research

Cite this report as:
Bellingham PJ, Overton JM, Thomson FJ, MacLeod CJ, Holdaway RJ, Wiser SK, Brown M, Gormley AM, Collins D,
Latham DM, Bishop C, Rutledge D, Innes J, Warburton B 2016. Standardised terrestrial biodiversity indicators
for use by regional councils. Landcare Research Contract Report LC2109 for the Regional Councils’ Biodiversity
Monitoring Working Group.

Disclaimer
This report has been prepared by Landcare Research for Regional Councils’ Biodiversity Monitoring Working
Group. If used by other parties, no warranty or representation is given as to its accuracy and no liability is
accepted for loss or damage arising directly or indirectly from reliance on the information in it.
Contents

Overview........................................................................................................................... v

1 Indicator M1: Land under indigenous vegetation ............................................................. 1

2 Indicator M2: Vegetation structure and composition .................................................... 17

3 Indicator M3: Avian representation ........................................................................ 39
 3.1 Introduction............................................................................................................. 39
 3.2 Scoping and analysis ................................................................................................ 40
 3.3 Current approaches employed by regional councils................................................... 48
 3.4 Data storage and reporting....................................................................................... 54
 3.5 Development of a sampling scheme ......................................................................... 56

Appendix 3-1 – Skills and logistical requirements for bird count methods ........................ 79

Appendix 3-2 – Extending the DOC BMRS sampling grid across regions ............................ 81

Appendix 3-3 – Unadjusted bird count methods .............................................................. 85

Appendix 3-4 – Adjusted bird count methods .................................................................. 86

Appendix 3-5 – Key assumptions about detection probabilities ........................................ 88

Appendix 3-6 – Informing trade-offs in sampling design ................................................... 89

4 Indicator M5: Vulnerable ecosystems ............................................................................. 92

5 Indicator M6: Number of new naturalisations..............................................................117

6 Indicator M7: Distribution and abundance of weeds and animal pests .......................137

7 Indicator M8: Change in area under intensive land use & Indicator M9: Habitat and
vegetation loss ........................................................................................................................167

8 Indicator M11: Change in temperature and precipitation............................................185

9 Indicator M12: Change in protection of naturally uncommon ecosystems .................235

10 Indicator M13: Threatened species habitat: number and status of threatened species
impacted by consents .............................................................................................................243

11 Indicator M14: Vegetation consents compliance .........................................................287

12 Indicator M15: Indigenous ecosystems released from vertebrate pests .....................301

Landcare Research Page iii

Standardised terrestrial biodiversity indicators for use by regional councils

13 Indicator M16: Change in the abundance of indigenous plants and animals susceptible
to introduced herbivores and carnivores ...............................................................................309

14 Indicator M17: Extent of indigenous vegetation in water catchment ..........................337

15 Indicator M18: Area and type of legal biodiversity protection .....................................349

16 Indicator M19: Contribution of initiatives to (i) species translocations and (ii) habitat
restoration ..............................................................................................................................381

17 Indicator M20: Community contribution to weed and animal pest control and
reductions ...............................................................................................................................395

Page iv Landcare Research
Standardised terrestrial biodiversity indicators for use by regional councils

Overview
In 2010, the Technical Group of the Regional Council Biodiversity Forum worked with
Landcare Research to develop the Regional Council Terrestrial Biodiversity Monitoring
Framework. 1

This framework is designed as part of ‘a national, standardised, biodiversity monitoring
programme, focusing on the assessment of biodiversity outcomes, to meet regional council
statutory, planning and operational requirements for sustaining terrestrial indigenous
biodiversity’

The terrestrial biodiversity monitoring framework adopts the same approach as the ecological
integrity framework designed by Landcare Research for the Department of Conservation
(DOC) and consists of three components: (i) indigenous dominance, (ii) species occupancy,
and (iii) environmental representation. 2 To inform the framework, there are four broad areas:
(i) state and condition, (ii) threats and pressures, (iii) effectiveness of policy and
management, and (iv) community engagement.

A standardised monitoring framework ensures that data for each measure are consistent
among regional councils, which allows for reliable State of Environment reporting.
Furthermore, to enable national reporting across public and private land, it is also desirable
that where possible, measures can be integrated with those from DOC’sBiodiversity
Monitoring and Reporting System (DOC BMRS). 3 The monitoring framework covers most
categories of essential biodiversity variables 4 recommended for reporting internationally,
addressing species populations, species traits, community composition, and ecosystem
structure adequately, but does not address genetic composition and only in part ecosystem
function.

This report contains descriptions of 18 terrestrial biodiversity indicators developed within this
framework by scientists who worked with regional council counterparts and representatives
from individual regional councils. Each indicator is described in terms of its rationale, current
efforts to evaluate the indicator, data requirements, a standardised method for implementation
as a minimum requirement for each council, and a reporting template. Recommendations are
made for data management for each indicator and, for some, research and development
needed before the indicator can be implemented.

The terrestrial biodiversity indicators in this report are designed to enable reporting at a
whole-region scale. Some of the indicators are also suitable for use at individual sites of

1
 Lee and Allen 2011. Recommended monitoring framework for regional councils assessing biodiversity
outcomes in terrestrial ecosystems. Lincoln, Landcare Research.
2
 Lee et al. 2005. Biodiversity inventory and monitoring: a review of national and international systems and a
proposed framework for future biodiversity monitoring by the Department of Conservation. Lincoln, Landcare
Research.
3
 Allen et al. 2013. Designing an inventory and monitoring programme for the Department of Conservation’s
Natural Heritage Management System. Lincoln, Landcare Research.
4
 Pereira et al. 2013. Essential biodiversity variables. Science 339, 277–278.

Landcare Research Page v
Standardised terrestrial biodiversity indicators for use by regional councils

interest within regions. Each indicator is described in terms of a minimum standard for all
councils. If implemented by all councils, each measure can then be aggregated to allow
national-scale reporting (e.g., for State of Environment reports, or for international
obligations such as reporting on achievement of Aichi Targets for the Convention on
Biodiversity). Individual councils could add additional measurements to supplement the
minimum standards recommended.

Three of the 18 terrestrial biodiversity indicators – Measures 1 ‘Land under indigenous
vegetation’, 11 ‘Change in temperature and precipitation’, and 18 ‘Area and type of legal
biodiversity protection’ – were implemented and reported on for all regional councils in June
2014. An attempt to implement and report two others at that time – Measures 19
‘Contribution of initiatives to (i) species translocations and (ii) habitat restoration’ and 20
‘Community contribution to weed and animal pest control and reductions’ – was unsuccessful
because the data needed for these indicators was either not readily available or not collected
in a consistent way, and investment will be needed to remedy these issues before they can be
reported successfully.

Page vi Landcare Research
Standardised terrestrial biodiversity indicators for use by regional councils 3 Indicator M3: Avian representation Author: Catriona MacLeod, Landcare Research 3.1 Introduction This report focuses on M3 (‘Avian Representation’), one of three measures used to inform the ‘Biodiversity Condition’ indicator within the framework. Recommendations for the bird monitoring design are based on review of current New Zealand bird monitoring schemes in relation to best-practice guidelines in the international literature. This work was carried out by Landcare Research for the Regional Council Biodiversity Working Group between July 2011 and December 2013. To achieve successful conservation outcomes, a combination of biodiversity monitoring, diagnostic research, the testing and proving of management solutions, and their successful incorporation into population- or community-wide management schemes is required (Yoccoz et al. 2001; Wilson et al. 2010; Lindenmayer et al. 2012). The value of biodiversity monitoring has been clearly demonstrated in recent years, for documenting ecosystem change (Both & Visser 2001; DeVictor et al. 2010; Anderson et al. 2011), engaging public awareness in environmental issues, and providing the necessary evidential basis for conservation legislation (Butchart et al. 2010). Although birds comprise only a small fraction of animal species, they are often selected for monitoring studies (Pereira &Cooper 2006) and to build headline indicators of biodiversity (Schmeller et al. 2012). Four main drivers for this have been identified (Furness & Greenwood 1993; Newton 1998): Compared with other taxa, birds are relatively easy to observe and identify, as most species are diurnal and well-known taxonomically. Individual nests can be monitored to measure reproductive success, and individual birds can often be fitted with a tracking device or permanently marked (using a tag or leg band), allowing data on their movements, behaviour and life-histories to be obtained relatively easily (Bairlein et al. 2012). As many species are high in the food chain, birds are considered good indicators for measuring the status of other taxa and also ecosystem health (i.e. how active the ecosystem is and how well it maintains its organisation and autonomy over time, and its resilience to stress; Constanza et al. 1992). Birds represent an iconic component of biodiversity with which policymakers and the general public alike connect. With many ongoing monitoring programmes in place and many volunteers willing to contribute, birds are often selected as target taxa for global and regional monitoring schemes (Pereira &Cooper 2006). However, as a result, there has been a proliferation of methods and approaches in recent decades (and accompanying debates among the proponents of different approaches). This frequently makes it difficult for conservation managers (or other end-users conducting bird population monitoring) to know how best to proceed for their own specific Landcare Research Page 39
Standardised terrestrial biodiversity indicators for use by regional councils needs. A review of 144 established bird monitoring schemes in Europe (Schmeller et al. 2012), for example, identified the following design issues as priorities for improvement: Ensuring unbiased spatial coverage Sampling effort optimisation Replicated sampling to account for variation in detection probability More efficient statistical use of the data. 3.2 Scoping and analysis 3.2.1 Indicator definition The Indicator M3 (‘Avian Representation’) aims to quantify the presence of suitable bird species across trophic levels; it is one of three measures used to assess the status of the ‘Biodiversity Condition’ indicator (Lee & Allen 2011).1 We recommend that all species detected are recorded, rather than just one particular subset of species. This approach will allow flexibility and provide baseline data for future measurement of shifts in bird assemblages that were not anticipated at the outset, e.g. the possibility of some currently rare bird species becoming common in the future. For nocturnal species of interest (e.g. kiwi Apteryx spp. and morepork Ninox novaeseelandiae), we recommend that a separate (but complementary) system is developed. The sampling scheme is appropriate for diurnal bird species at terrestrial sampling locations within a region. This scheme is designed for reporting primarily at the regional or national level. Some habitats currently administered by regional councils (e.g. wetland areas including coastal, braided riverbeds and dune habitats) may need to be monitored independently if species assemblages associated with these habitats are of interest. In particular, we expect that migratory and wetland species associated with these habitats will be poorly monitored by the current scheme. 3.2.2 Indicator statistic Indicator statistics for Avian Representation could potentially be measured at the population, species or community level. We recommend that regional councils focus on the following three indicator statistics: Species richness (the number of species present) Occupancy (the proportion of locations occupied by a given species) Population density (the number of individuals of a given species within a hectare). These can be measured either as static (e.g. population size or occupancy) or dynamic variables (e.g. population trend or extinction rate; Box 1). All indicator statistics should include some measure of the precision of the estimate (e.g. the mean species occupancy or richness with 95% confidence intervals), to allow the reader to determine what confidence can be placed in those estimates and the strength of the inferences that can be drawn from them. Page 40 Landcare Research
Standardised terrestrial biodiversity indicators for use by regional councils Box 1 Indicator statistics can be measured at population, species or community levels, and as static or dynamic variables State variables can be the mean or variance estimates. Dynamic variables measure system function (rather than just state), so typically quantify rate parameters (Boulinier et al. 1998). Dynamic variables can be used to explain state and are relevant for both community- and species-level traits: Population or species level: 1. Colonisation and extinction rates: Measure vital rates of site occupancy dynamics for a given 1. Distribution: Specifying where birds do and do not occur, typically population or species level (MacKenzie et al. 2003). At the community level, temporal displayed as maps(Bibby et al. 2000) Sampling effort should be changes in species composition are measured as turnover rates (Magurran et al. 2010). uniform (or measured and reported) otherwise the resulting maps will show the distribution of observer efforts as much as the distribution of 2. Trends and rates of change: Can be absolute or relative, but measuring the percentage birds. change (since an arbitrary baseline year) can provide a more robust way to assess biodiversity trends (Magurran et al. 2010). 2. Occupancy: Estimates the proportion of sites occupied by a given species (MacKenzie et al. 2002). Potentially more cost-effective to 3. Turning points and changing variance: Turning points identify the timing of significant measure than abundance (Noon et al. 2012). changes in population or community trajectories (Fewster et al. 2000). Measures of increased variability in biomass and other community attributes can be indicators of change 3. Abundance: Can be relative or absolute, with strongest inferences in community composition from one state to the next (Magurran et al. 2010). usually drawn from the latter Buckland et al 2008). Note when measuring trends, it is important to consider these aspects: Community-level variables can be calculated for all species or subsets of species (e.g. different taxonomic groups or guilds). These are useful for The ecology of the study species (e.g. is it a naturally cycling species?) (Thomas & Martin assessing the structure and function of communities and the impacts of 1996) and community (e.g. what is the underlying level of temporal turnover in that management on a variety of species or functional groups of species: community?) (Magurran et al. 2010). 4. Richness: Measures the number of species in the community of Sampling fluctuations can lead to an alert being triggered when the true reduction (if any) in interest. It is the simplest way to describe community and regional the population is not of a magnitude to warrant it (Magurran et al. 2010), but smoothing diversity (Gotelli & Colwell 2001). splines can be used to remove short-term fluctuations in population trends (Fewster et al. 5. Evenness: The equitability of the proportional abundances of the 2000) and take into account the precision of the change measure within the alerts process species in the community of interest (Tuomisto 2012). This can provide (Magurran et al. 2010). useful insights into the mechanisms that structure a community and Small changes in the way that the data are selected for analysis can affect the overall the extent that it is disturbed (Studeny et al. 2011). magnitude of trends (e.g. any resulting bias due to adding a constant to count data before 6. Diversity: Consists of two components, richness and evenness. Most log transformation is expected to decrease within increasing abundance). are weighted sums of relative abundances of species, but also could be The method of trend estimation can affect the magnitude, direction and statistical value-weighted according to ecosystem or economic values or significance of population trends assigned to species, thus assessing patterns of population taxonomic distinctiveness to inform management (Yoccoz et al. 2001). change (rather than focusing on the magnitude of calculated trends and variance) may be more important or useful (Thomas & Martin 1996; Buckland et al. 2005). Landcare Research Page 41
Standardised terrestrial biodiversity indicators for use by regional councils 3.2.3 Reference points for measuring change Three types of reference points can be used to assess the state of biodiversity across a region and any spatio-temporal trends (Box 2) (Buckland et al. 2008): Baseline measures provide the starting points (at some time or state) against which change can be assessed Thresholds set some stage at which an alert is raised (e.g. a species has become threatened) Targets are set against agreed measurable endpoints and a specified timeline Biodiversity measures can also be assessed against reference points, either in a static manner (i.e. distance from thresholds or targets) or a dynamic one (i.e. rates of change towards or away from thresholds or targets; Box 2). Box 2 Setting monitoring goals: approaches, reference points and timelines 1. Static approaches include measures of ‘population status’ (e.g. population size and occupancy) against threshold measures and, at a community level, proportions of species that meet specified management targets, for example: Classify species according to thresholds specified under the IUCN Red List classification system (IUCN 2008). 2. Dynamic approaches include the tallying of such numbers or proportions of species within various categories and monitoring changes in the status of these assemblages over time (Magurran et al. 2010). It is important to specify what levels of trend and within what confidence intervals the system aims to detect. The IUCN system, for example, raises an ‘amber’ alert about a population if it declines by 25% over 25 years and a ‘red’ alert if it declines by >50% over 25 years (IUCN 2008). The NeoTropical Migratory Bird Conservation Program, for example, defined an effective monitoring system as one that has 90% chance of detecting a 50% decline in a species’ abundance over 25 years (Thomas & Martin 1996). 3. Assessments with respect to previously identified thresholds can also combine both static and dynamic variables, such as in ‘alerts’ approaches where sets of quantitative population criteria are used to place species on a ‘red’, ‘amber’ or ‘green’ alert. The UK bird ‘alert’ listing criteria, for example, assess global conservation status, historical population decline, recent population decline (numbers and geographical range), European conservation status, rarity, localised distribution, and international importance of populations (Eaton et al. 2009). 3.2.4 Reporting frequencies We anticipate regional councils adopting a sampling design based on a rotating-panel design, with a unique subset of randomly-selected locations (or ‘panels’) sampled in each year of the 5-year cycle (Table 3-1). If this design is adopted, trends in the biodiversity measures can be estimated, on an annual basis between ‘panels’ of locations from the second year, and within locations after the first 5-year cycle. It is important, however, that sampling locations in year two and beyond are selected randomly and not according to strata (such as land cover or Landcare Research Page 42
Standardised terrestrial biodiversity indicators for use by regional councils

environmental gradient), or else inference about trend will be confounded by the different
strata measured each year.

Table 3-1 Schematic specifications (Urquhart et al. 1998) for the proposed rotating-panel design, where a panel
consists of a unique subset of randomly-selected sampling locations is sampled each year of the 5-year cycle

Panel Sampling year
 1 2 3 4 5 6 7 8 9 10 11 12 13 14 15 16 17 18 19 20
 1
 2
 3
 4
 5

Complementary systems will be required to facilitate monitoring of managed species and
places. Such systems would include monitoring of rare and threatened species or
communities (Williams et al 2007; Rodriguez et al. 2011; Holdaway et al. 2012), or those
with confined distributions, as well as the effects of conservation management efforts at
specific locations. Thus, the regional-level sampling proposed here is not intended to address
these issues. Addressing specific management-effectiveness questions (e.g. testing the
effectiveness of possum control management within the region) may require intensive
sampling regimes (e.g. as implemented on DOC Tier 2 monitoring sites).

A trade-off between detail and scope or coverage is a practical limitation faced by all
monitoring programmes. DOC uses a nested hierarchy (Box 3) to collect information with
different levels of scope and coverage.

Landcare Research Page 43
Standardised terrestrial biodiversity indicators for use by regional councils Box 3 Hierarchical nested monitoring adopted by the DOC Biodiversity Monitoring and Reporting System. Broad scope Narrow coverage Tier 3 Reference Sites (e.g. Little Barrier Island) Tier 2 Local management issues (e.g. Managed Ecosystems and Threatened Species) Narrow scope Broad coverage Tier 1 National context (e.g. Ecosystems and Species) Physical and biological indicators measured in all tiers with different scope and coverage Tier 1. The lowest level represented is monitoring that has broad spatial and temporal applicability (e.g. National Ecosystems and Species). This level provides geographic and interpretive context for data collected for Managed Ecosystems or Managed Threatened Species (Tier 2 and Tier 3). Tier 2. The middle tier indicates enhanced investigation effort that is limited in spatial and temporal extent but focused on management-driven impacts and outputs (Managed Ecosystems or Managed Threatened Species). Tier 3. Monitoring conducted intensively at a few sites (e.g. Waitutu, Eglinton, Craigieburn). These sites are useful for understanding interactions and allowing the development of predictive models. These intensive monitoring areas may become reference sites or benchmarks against which other sites may be compared. Intensive investigations aid in interpreting Tier 1 and Tier 2 data. 3.2.5 Reporting hierarchies Information can be presented for all species, different subsets of species or individual species. Bird species can be grouped according to their origin (native or introduced) or functional traits or trophic levels (e.g. insectivores vs seed-eating species). 3.2.6 Spatial and temporal analysis In the short term, it will be feasible to report on Avian Representation status at regional and national levels. Where sampling effort is sufficient, it will also be feasible to report on Avian Representation status within the predominant environments and land-use types at regional and national scales. After the first set of remeasurements, the system will report on the status of biodiversity measures relative to baseline measures from the initial survey at regional and national scales, as well as within predominant environments and land-use types. In the longer term, the system will report on trends in the biodiversity measures and evaluate these trends against agreed standards or limits. 3.2.7 Relationships between indicators and present patterns We recommend integrating sampling protocols for the Avian Representation measure with those of the closely aligned M16 (Changes in abundance of animals susceptible to introduced Page 44 Landcare Research
Standardised terrestrial biodiversity indicators for use by regional councils

herbivores and carnivores). Other measures could be used to interpret any spatial and
temporal changes in the avian representation metrics. Measures of Habitat Loss and Land
under Indigenous Vegetation could be used, for example, to test for evidence of land-use-
change impacts (e.g. agricultural intensification and loss of indigenous vegetation) on bird
populations. Similarly, the Biodiversity Protection measures could be used to assess whether
areas subject to protection policies provide enhanced biodiversity outcomes relative to areas
without protection. Such analyses could thus inform management and policy at regional and
national scales.

 3.2.8 Assessment of existing methodologies

Bird monitoring can take either surveillance or question-driven approaches, being motivated
either by curiosity or by scientific questions and/or management issues (Yoccoz et al 2001;
Field et al 2007; Lindenmayer & Likens 2010; Jones et al 2011; Jones et al 2013).
Monitoring can be aimed either at the birds themselves or at bigger picture environmental
goals (i.e. using birds as indicators) (Furness & Greenwood 1993; Newton 1998; Pereira &
Cooper 2006). Different users tend to ask different questions of monitoring depending on
their needs or interests (Figure 3-1), influencing the approaches (what is measured) and
methods (how it is measured) chosen.

Figure 3-1 Purposes for monitoring and the approaches used.

Landcare Research Page 45
Standardised terrestrial biodiversity indicators for use by regional councils

The Avian Representation measure requires standardised field sampling and classification of
birds into relevant guilds. A number of bird monitoring schemes are currently applied in New
Zealand (Table 3-2), each using different monitoring designs and field sampling methods.
There is currently no standard classification of feeding guilds for birds in New Zealand, with
independent studies using their own interpretation of the literature to classify species (Hoare
et al. 2012; MacLeod et al. 2012).

Footnotes to Table 3-2 (over page)
1
 Department of Conservation Biodiversity Monitoring and Reporting System; Lee et al. 2005; Allen et al.
2009b; MacLeod et al. 2012e; Macleod et al 2012a
2
 Agricultural Research Group on Sustainability; MacLeod et al. 2012c
3
 Spurr 2012
4
 Bull et al. 1985; Robertson et al. 2007
5
 Scofield et al. 2005
6
 Sullivan 2012

Page 46 Landcare Research
Standardised terrestrial biodiversity indicators for use by regional councils

Table 3-2 Summary of bird monitoring initiatives in New Zealand (GOV = government, ACA = academic, IND = industry, NGO = non-government)

 1 2 3 4 5 6
Approach DOC BMRS ARGOS Garden Bird Survey NZ bird atlases eBird NatureWatch
Governance GOV ACA, IND NGO, ACA NGO NGO NGO, ACA
Objective Assess status Assess status Assess trend Assess status Curiosity Curiosity
 Monitor for impacts Monitor for impacts Raise awareness Assess status
 Assess management Assess management
 Early-warning system
Structured surveillance? Yes Yes Semi Semi No No
Species variables Species richness Species richness Species occupancy Inventories of Inventories of Inventories of species
 Species occupancy Species occupancy Species abundance species of interest species of interest of interest
 Species abundance Species abundance Species distribution
Statistics quantified State (and trend) State (and trend) Trend (and state) State (and trend) Usually state, Usually state,
 occasionally trend occasionally trend
Reference points Baselines from initial Baselines from initial Baselines from initial Baselines from initial Not specified Not specified
 survey survey survey survey
Spatial scope Public conservation Farmland within three Urban at national National scale Locations of interest Locations of interest
 lands at a national scale sectors scale to personnel to personnel
Temporal scope Rotating-panel design c. 2–3 year intervals Annual c. 20-year intervals Variable Variable
 over a 5-year cycle
Repeated measures Yes Yes Some Possibly Not specified Not specified
Bird count technique Modified 5-min Bird Distance sampling Timed counts, Roving records of Ad hoc observations Ad hoc observations
 Count, incorporating transects & point maximum number species lists
 distance sampling counts observed
Repeated counts Yes Yes No Some Possibly Possibly
Detection probabilities Yes Yes No No No No
Record sampling effort Yes Yes Yes Yes Typically no Typically no
Field personnel Professional Professional/student Citizen science Citizen science Citizen science Citizen science
Database development Ongoing Established Ongoing Established Established Established
Analysis controls for Yes Yes No No Typically no Typically no (but see
sampling effort variation Sullivan 2012)
Precision Yes Yes Yes No No No
Reporting Annual c. 2–3 years Annual 20-year intervals No No

Landcare Research Page 47
Standardised terrestrial biodiversity indicators for use by regional councils 3.3 Current approaches employed by regional councils Regional-scale monitoring efforts: Currently limited to two regions: Auckland (but focusing on a subset of the landscape – remnants of woody vegetation); and Greater Wellington (a pilot study testing feasibility of using 8 × 8 km grid to sample pastoral landscapes, recognising that information on other dominant habitats is available from DOC). Site-focused surveys: Most current bird monitoring efforts are focused on measuring the impact of management such as pest control or restoration activities (e.g. Greater Wellington Regional Council; Hawke’s Bay Regional Council; Environment Waikatov) (Fitzgerald & Innes 2013). There is potential to establish coordinated monitoring among these monitoring locations akin to a Tier 2 monitoring system (Box 3). The key challenge here is variation in management approaches and different scales of monitoring vs management. Bird count methods employed: The five-minute bird count is the primary method used, with fieldwork carried out by private contractors (e.g. Hawke’s Bay) or in combination with in-house skills (e.g. Greater Wellington; Environment Canterbury) or community groups (e.g. Environment Canterbury). Analytical capability available: This varies among regional councils, with some better resourced than others. This is a specialist skill-set perhaps best provided by a third party; this is also better from an audit perspective (akin to the DOC/KPMG audit/auditor general review process). Regular reporting: There is currently only limited reporting – the primary focus being state of the environment reporting (e.g. Auckland Council). Reporting for other purposes could include community engagement projects (e.g. Hawke’s Bay). 3.3.1 Monitoring objectives and sampling designs Bird monitoring schemes currently underway in New Zealand are governed by a range of different parties (Table 3-2), including government agencies (DOC’s Biodiversity Monitoring and Reporting System, DOC BMRS), academic research institutes (e.g. the Agricultural Research Group on Sustainability, ARGOS, which works closely with industry) and non- government organisations (primarily the Ornithological Society of New Zealand) or partnerships between multiple parties (e.g. the New Zealand Garden Bird Survey). Although the monitoring goals are not always explicitly stated, most schemes appear to aim to assess the status of bird populations and communities, with few being specifically designed to assess and monitor management impacts. The schemes range from highly structured surveillance designs (DOC BMRS and ARGOS) to semi-structured ones (Garden Bird Survey) to those using unstructured surveillance approaches (e.g. eBird, NatureWatch NZ). v Hamilton Halo project: http://www.waikatoregion.govt.nz/Environment/Natural- resources/Biodiversity/Hamilton-Halo/ Landcare Research Page 48
Standardised terrestrial biodiversity indicators for use by regional councils

For the regional council Terrestrial Biodiversity Monitoring Framework the key will be to
select a scale, design and intensity of monitoring that are appropriate for its purpose, as this
will influence the extent and strength of inferences that can be drawn from the monitoring
data (Yoccoz et al. 2001). Strongest inferences are typically made when the measured
variables have low bias (minor systematic under- or over-estimation) and high precision (a
low level of uncertainty) (Thompson 2002; Buckland et al. 2008; Snäll et al. 2011). Having
established an initial design (MacKenzie & Royle 2005; Voříšek et al. 2008), the sampling
strategy should be re-evaluated given the available resources (Appendix 3-1), to ensure that it
will be feasible to implement in the field and will provide adequate representation and
precision to address study objectives (Gregory 2000; Field et al. 2005). If not, the objectives
and design either need to be revised or the required resources secured (Magurran et al. 2010).

 3.3.2 Species metrics and monitoring reference points

Different monitoring approaches will provide different species metrics (Figure 3-2). In
general, atlases provide useful preliminary information about bird distributions or species
inventories within a region, but to detect trends and direct management and policy, more
detailed and regular surveys will be required (Bibby 1999). While smaller-scale (but more
intensive) monitoring may be better suited for accurate and precise abundance measures for
single species, less intensive monitoring at larger spatial scales may be better suited for
community measures such as species richness, and monitoring to gain information on
population trends generally needs long time-series of data to separate trend from random
variance.

Most New Zealand schemes currently focus on measuring status and change relative to
baselines derived from the initial surveys. Some aim to measure trend but currently do not
have sufficient information to do so (except possibly the Garden Bird Survey).

Landcare Research Page 49
Standardised terrestrial biodiversity indicators for use by regional councils

Figure 3-2 Survey design and the development of knowledge on trends and numbers of birds. Different survey
approaches work differently according to the pattern of numbers and distribution of the species. Adapted from
Bibby (1999).

 3.3.3 Spatial and temporal scope

The spatial and temporal scope of the different bird monitoring initiatives in New Zealand
vary extensively (Figure 3-3), with only the bird atlases aiming to provide information at a
national scale. Some focus on particular land uses (conservation, agricultural or urban
landscapes), while others concentrate on specific locations of interest to the observer. The
frequency and timing of sampling events also vary widely among the schemes. These
differences in spatial and temporal scope make it difficult to directly compare and collate
information collected from these different schemes (MacLeod et al. 2013).vi In addition to
considering the spatial scope of monitoring underway under other schemes, assessing the
power of those schemes to realistically detect changes in bird community composition is also
important (Figure 3-3).

vi
 Assessing the feasibility of drawing from multiple data sources for reporting on biodiversity status and trend
information is the focus of a new MBIE-funded project, ‘Trustworthy biodiversity measures – using birds as a
proof-of-concept’ (MacLeod et al. 2013).

Page 50 Landcare Research
Standardised terrestrial biodiversity indicators for use by regional councils Figure 3-3 Comparing bird monitoring schemes currently implemented in New Zealand to highlight differences in their spatial zones of inference and potential power to detect change in avian community composition. Schemes using structured surveillance approaches implement standardised sampling protocols at specified sampling locations and those locations are repeatedly sampled at regular intervals at a similar time of year (e.g. DOC BMRS and ARGOS). Using repeated measures from the same sampling locations over time can increase the power of a given monitoring design to detect changes in trends, relative to a design that measures a new set of locations at each sampling event (Monks & MacLeod 2013). DOC BMRS: Benefits of alignment with this scheme would include providing a representative sample across the region, with DOC covering the costs of monitoring for c. 32% locations at the national scale, although some regions will benefit more from this partnership than others (Appendix 3-2) NZ Sustainability Dashboard: This sustainability assessment and reporting tool (Manhire et al. 2012) is currently being developedvii for multiple primary industry sectors within New Zealand. It combines internationally-recognised frameworks and their key generic sustainability performance indicators (KPIs), with complementary KPIs developed specifically for New Zealand and the participating sectors (Hunt et al. 2013). The environmental monitoring framework design is closely aligned to the DOC and regional council biodiversity monitoring and reporting systems (MacLeod & Moller 2013). This provides an opportunity for regional councils to contribute and obtain data to assess sustainability of land management practices at regional, national and industry levels. vii This initiative is being led by the Agricultural Research Group On Sustainability (ARGOS). http://www.nzdashboard.org.nz/ Landcare Research Page 51
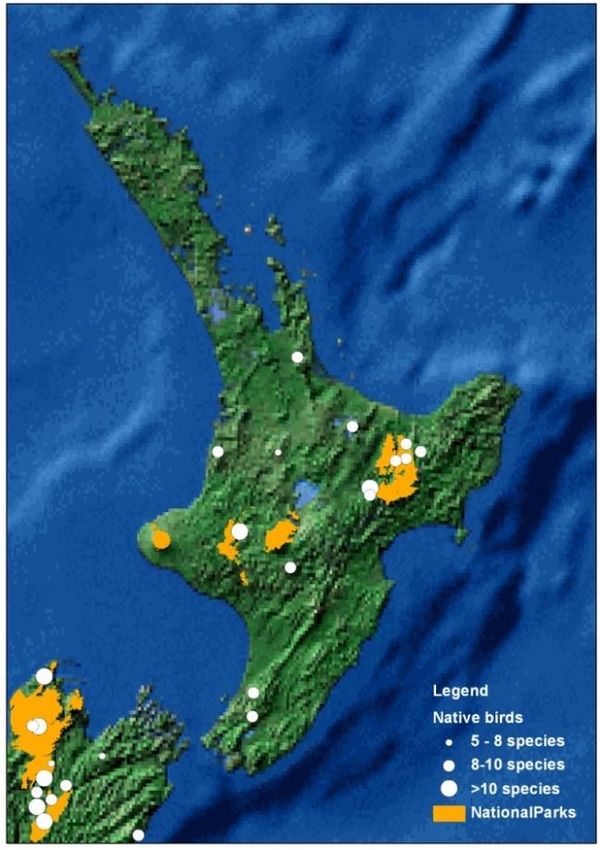
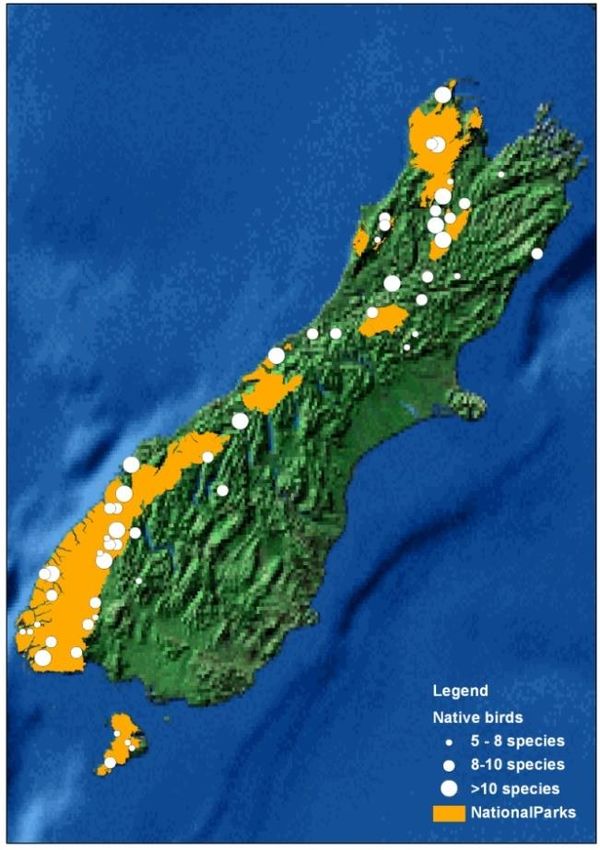
Standardised terrestrial biodiversity indicators for use by regional councils Semi-structured surveillance designs (e.g. the atlas of bird distribution and the New Zealand Garden Bird Survey) are likely to have reduced power to detect change (Bibby 1999; Bibby et al. 2000). This is primarily due to temporal changes in the spatial scope of sampling effort, which makes it difficult to distinguish whether any observed changes are due to real changes in bird populations or if they simply reflect changes in the areas being sampled. Also, sampling may be biased towards locations of interest. New Zealand Garden Bird survey: Extending the 8 × 8 km grid at national scale would provide a relatively small number of locations within urban landscapes (Appendix 3-2). As a good example of an indicator for reporting on community engagement, it could be a potential mechanism for overcoming difficulties in gaining access to private land for monitoring. The following potential sources of bias have not yet been formally investigated but are important considerations: (1) large variation in bird identification capabilities (e.g. Adélie penguins, an Antarctic species, being observed!); (2) the method does not currently account for variation in species detectability among and within regions; and (3) survey effort may be biased towards particular locations, for example gardens close to parks or reserves where birds are more abundant or diverse. Future New Zealand bird atlases: As the sampling protocols employed in previous iterations of the New Zealand bird atlases were flexible, observers may have targeted locations where they were more likely to encounter a wide range of species or those of conservation concern. Hence, there is opportunity to strengthen inferences that can be drawn from these data using a more structured surveillance approach. Unstructured surveillance approaches will typically have very low power to detect change. This is because both the spatial and temporal scopes of sampling are highly dynamic and rarely specified and maintained. Alternatively, the spatial and temporal scopes can be clearly defined but will be focused on locations of interest to the observer (Sullivan 2012), hence limited inferences can be drawn from such information for regional and national reporting purposes. eBird and NatureWatch: There is potential to harness this citizen effort to facilitate a structured surveillance approach. Currently data are too patchy (temporally and spatially) to provide meaningful information at national and regional scales (e.g. see relevant international reviews: Snäll et al. 2011; Dickinson et al. 2010; Conrad & Hilchey 2011). Five-minute bird count database: The five-minute bird count method (5MBC) (Dawson & Bull 1975) has been the predominant bird monitoring technique used in New Zealand over the last 40 years (Hartley 2012). At least 120 000 counts are currently held in a central database (administered by DOC) but these data were primarily collected in short-term studies that were patchily distributed across the country (Figure 3-4). Page 52 Landcare Research
Standardised terrestrial biodiversity indicators for use by regional councils

Figure 3-4 Distribution of five-minute bird count studies currently held in the Department of Conservation’s
5MBC database. Source: Hartley (2012).

 3.3.4 Bird count techniques

Counting birds can be difficult because counts not only vary over space and time due to
actual differences in species composition and abundance, but also due to differences in
detection probabilities of species and individuals among counts (Box 4) and differences
associated with measurement and misclassification errors (Simons et al. 2009). Given that
absolute counts are rarely feasible, most studies aim to sample the community or population
of interest. A large number of methods exist for counting birds. Most of the ‘bird-count-
method’ debate is centred on the importance of detection probabilities, with counts being
classified into two groups according to whether they explicitly measure and account for
variation in detectability or not (‘adjusted’ or ‘unadjusted’ counts; Appendices 3–5).

The bird count methods used in New Zealand schemes (Table 3-1) encompass both adjusted
(e.g. DOC BMRS and ARGOS) and unadjusted counts (e.g. Garden Bird Survey, bird atlases,
eBird and NatureWatch). Adjusted counts, which account for variation in species detection
probabilities (Box 4), include repeated counts (to measure species richness and occupancy;
Box 5) and distance sampling methods (used to estimate population density; Appendices
4–5).

Landcare Research Page 53
Standardised terrestrial biodiversity indicators for use by regional councils

 3.4 Data storage and reporting

Most regional councils (and other organisations) store their data in an ad hoc manner (e.g.
using electronic spreadsheets on individual computers or local servers). However, recently
some organisations have developed independent databases (e.g. OSNZ’s bird atlases, DOC’s
5MBC database) and online data repositories (e.g. eBird, NatureWatch, Garden Bird Survey,
Global Biodiversity Information Facility) to improve data management.

Some regional councils hold a large amount of five-minute bird count data. However, this
information is currently not readily locatable or available as there is no data storage system
that all regional councils (or other stakeholder groups) can use to store bird data. This
presents a number of data management and utilisation issues. For example, if standardised
protocols for recording and storing the metadata and bird count informationviii are not
implemented, this presents difficulties for locating, mobilising and interpreting existing bird
data. Overcoming these issues is particularly important for DOC and regional councils if their
respective monitoring frameworks are to be compatible and able to inform on state of the
environment reporting. Better data-recording and management protocols are required if
multiple sourcesix are to contribute information on a common basis for reporting regionally
and/or nationally.

viii
 http://www.doc.govt.nz/conservation/native-animals/birds/five-minute-bird-counts/resources/
ix
 The BioData Services Stack project recently funded by TFBIS could provide some tools for mobilising
existing bird count data held by regional councils.

Page 54 Landcare Research
Standardised terrestrial biodiversity indicators for use by regional councils Box 4 Detection probability Definition and components Detecting birds is often complicated because some birds move, while others are inconspicuous or actively move to avoid the counter (Elphick 2008). There are two components to detection probabilities (Alldredge et al. 2008): A probability that a bird is available for detection A probability of detection, conditional on its availability. Bird detectability may vary in relation to three types of factors (individually or in combination (Alldredge et al. 2008; Buckland et al. 2008; Elphick 2008; Rozenstock et al. 2002): 1. Observer ability to detect and accurately identify birds 2. Environmental variables that affect bird behaviour and observer efficiency 3. Physical and behavioural traits of birds that make them more or less conspicuous to human observers. Incorporation into abundance estimates Bird count techniques all involve the collection of a count statistic (C), typically the number of birds seen or heard at a given point or along a transect (Nichols et al. 2002).This count statistic is denoted by the formula: ( ) = , where Ni is the true abundance and pi is the detection probability, associated with a given location and time period that the count was undertaken (i). Unadjusted counts do not measure detection probability, but instead assume that detection probabilities will be similar for the times and places for each abundance comparison to be made (i.e. pi = p for all i in the comparison). Thus, unadjusted counts report an index (Ci) that measures the proportion of the population that is counted. Adjusted counts collect data in a manner that allows estimation of the detection probability at the ̂ = . The given location and time period (i) and so permits estimation (˄) of the population size: ̂ resulting population estimate can then be used to draw inferences about changes in abundance over time and/or space. Landcare Research Page 55
Standardised terrestrial biodiversity indicators for use by regional councils

Box 5 Measuring occupancy for an iconic bird in urban parks

‘Citizen science’ initiatives monitoring the success of restoration activities require simple and robust tools if
meaningful data are to be collected. Using an urban monitoring study of the bellbird (Anthornis melanura), we
were able to offer advice and guidance on best practice for such monitoring schemes (MacLeod et al. 2012f).

Three independent surveys were undertaken across 140
locations in Christchurch’s urban parks. Six repeat five-
minute point counts were undertaken at each location per
survey.

A single five-minute count had c. 60% chance of detecting
bellbirds at a location where they were present, while the
cumulative detection probability increased to almost one
after five repeat counts per survey.

Detection probabilities were used to calculate unbiased
occupancy estimates.

Occupancy estimates calculated using three replicate counts
(‘Day1’ and ‘Day2’) were lower, but not statistically
different, than those based on six replicates (‘All data’).

Robust estimates of bellbird occupancy require at least
three repeat counts per location per survey within a short
time frame (to minimise the risk of recording false
absences).

Ideally, multiple locations should be surveyed concurrently.
Prolonging the time taken to complete a survey of all
locations increases the risk of bird movement occurring, and
thus represents a shift from measuring occupancy to
measuring the relative ‘use’ of different locations.

 3.5 Development of a sampling scheme

 3.5.1 Field sampling framework

A rotating-panel design, compatible with the New Zealand Land-Use and Carbon Analysis
System (LUCAS) (MfE 2005) and the DOC BMRS (Allen et al. 2009b), is recommended for
the field surveys (Appendix 3-2). Using a national infrastructure (an 8 × 8 km grid; n = 4084
sampling locations) established to measure carbon, vegetation structure and composition
would provide regional councils with a regular, unbiased framework for sampling. Repeated
measurements of each sampling location would occur at 5-yearly intervals, with a unique
subset of randomly-selected locations surveyed in each year of the 5-year cycle.

Page 56 Landcare Research
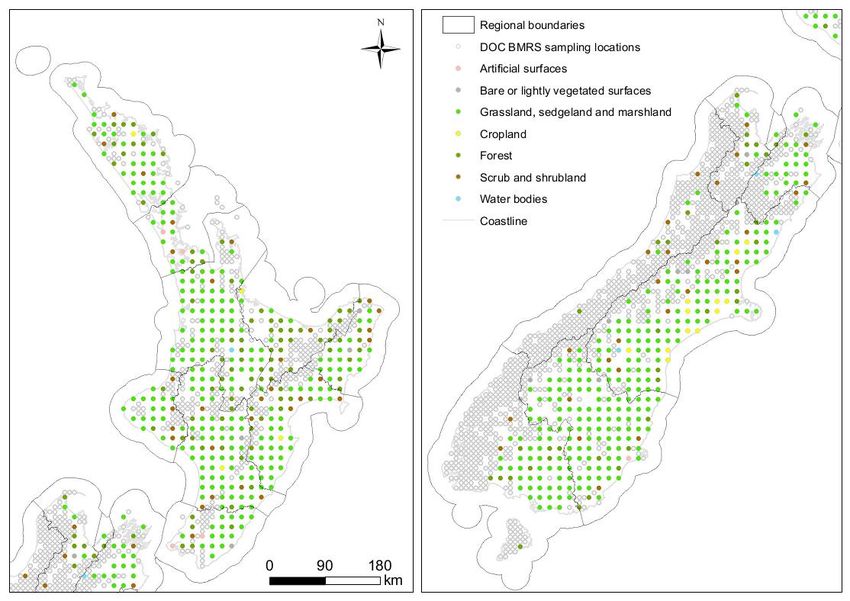
Standardised terrestrial biodiversity indicators for use by regional councils

The information collected using this framework would be suitable for integrating and
reporting at both regional and national scales, with DOC surveying c. 32% of sampling
locations at the national scale (but on public conservation land only) and between 8% and
86% at a regional scale (i.e. within each region, Appendix 3-2). At both national and regional
scales, strongest inferences on the status and trend of biodiversity will likely be drawn for the
two predominant landcover classes: forest (32%) and grassland/sedgeland/marshland (52%;
Appendix 3-2).

 3.5.2 Bird count methods

The optimal time for the bird surveys is mid-September to mid-October, which is early in the
breeding season for most bird species and when male birds sing most consistently. Field
sampling should proceed, in each year, from north to south and east to west to ‘follow the
spring season’. Each sampling location should be permanently marked, wherever feasible, to
allow for repeated sampling at that location. Assuming that the DOC BMRS protocol is
adopted, vegetation measurements are all made within a fixed 20 × 20 m plot. Data on
mammal pests and common birds are collected within a much larger area (220 × 220 m),
using a design that radiates out from the edges of the central vegetation plot (Figure 3-5).
Standardised field sampling protocols are used for both the vegetation and animal surveys
(Allen et al. 2009b; MacLeod et al. 2012e; DOC 2012).

Figure 3-5 Layout of the animal-survey sampling units in relation to the vegetation plot at each sampling
location.

A cluster of five count stations (200 m apart) is set up at each location (Figure 3-5), with
bounded bird-point counts carried out on two consecutive days at each station (DOC 2012;
MacLeod et al. 2012e). One count station is centred on the vegetation plot and one located
200 m directly away from each plot corner (Figure 3-5). Each location is considered an
independent sampling unit, at which species richness, occupancy, and density are estimated
(using data from the bounded bird-point counts collected from the cluster of five stations, i.e.
10 counts from five stations sampled twice).

Surveys are not undertaken in heavy rain, strong winds or poor visibility. To minimise the
effects of diurnal variation in vocalisation and to ensure comparability with historical 5MBC

Landcare Research Page 57
Standardised terrestrial biodiversity indicators for use by regional councils

data, all counts are initiated at least one hour after the official sunrise time for the sampling
location (hence surveying only diurnal species; sunrise times for each day and location can be
calculated using the ‘sunriset’ function in the ‘maptools’ package in R) (Lewin-Koh et al.
2008). Field teams should initiate counts one hour after sunrise and complete counts as
quickly as possible, but the timing of bird surveys may be constrained if the same team also
has to set up and check possum trap-lines (Allen et al. 2009b).

For each replicate bird survey, a ten-minute bird count (10MBC) is used. Distance-sampling
procedures are incorporated into the first five minutes (5MDist) of each 10MBC, using a
point-transect sampling approach (Buckland et al. 2001). During the 5MDist, the number of
individuals detected (flock size) at each observation is recorded, in addition to whether
individuals were initially heard or seen, and the horizontal radial distance from the count
station to the point of first detection. The observer is asked to identify in which distance-band
the bird was located (0–8 m; 9–16 m; 17–25 m; 26–45 m; 46–100 m; and >100 m from the
count station). Birds only observed flying overhead (i.e. not associated with the sampling
location) are not recorded, except for skylark, for which the horizontal radial distance to the
bird is recorded. Where birds in close proximity to the count station are obviously disturbed
by the approach of the observer, care is taken to note the identity and, where possible,
original location of those birds. The observer also records whether or not birds moved
towards them. During the 6–10 min period of the 10MBC, a modified 5MBC is to be
conducted. This is a simple tally of all bird species seen or heard (including overhead
observations) and recorded as either ‘Near’ (0–25 m), ‘Far’ (25–100 m) or ‘>Far’ (>100 m)
within a 5-min period over an unbounded (>100 m) distance. A rangefinder may be useful for
these observations.

Habitat measures are collected within a 20 × 20 m plot at each bird count station, by carrying
out a reduced Recce within the plot. We recommend following the standard Recce protocols
(Hurst & Allen 2007) to characterise the topography and vegetation at each station (i.e.
altitude, aspect, slope, physiography, drainage, cultural, surface and ground cover
characteristics and overall vegetation tier cover classes). Overall vegetation-tier cover classes
should only be provided for Tiers 1–6 as per the protocol for woody vegetation (and not
subdivided Tiers 5 and 6); presence of species in Tier 7 (epiphytes) is noted. (Note: the DOC
protocol (DOC 2012) recommends more detailed measures, which will require more time and
specialist knowledge.)

DOC is currently investigating the feasibility of replacing observers in the field with
automated recording devices for measuring bird community composition. However, these are
new methodological developments, which are still in their infancy, and require
comprehensive ground-truthing before they can be relied upon to cost-effectively deliver
useful information (Elphick 2008). Thus we caution against adopting automated sampling
protocols at this stage.

Page 58 Landcare Research
You can also read