WINOOSKI MASTER PLAN Working Draft - Winooski Planning Commission & City Council
←
→
Page content transcription
If your browser does not render page correctly, please read the page content below
WINOOSKI
MASTER PLAN
Working Draft

Winooski Planning Commission & City Council
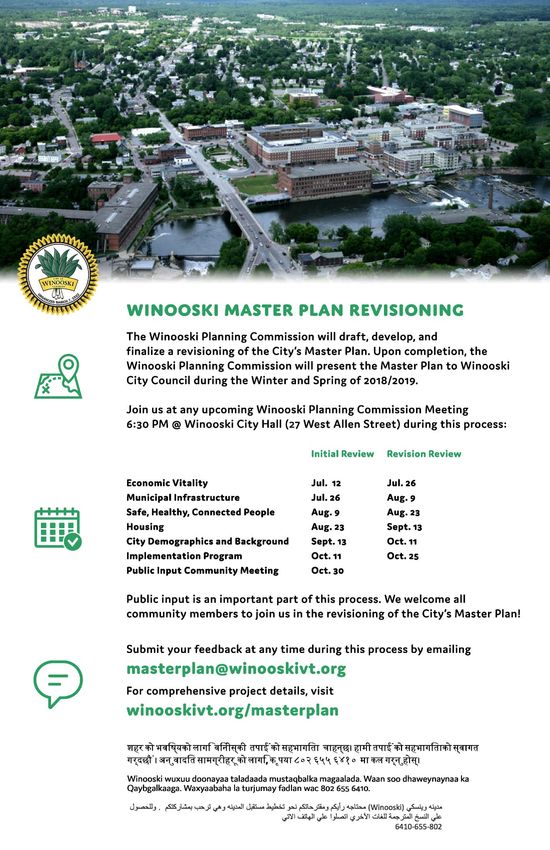
TABLE OF
CONTENTS
INTRODUCTION .......................................................... 1

Purpose of the Plan...................................................................... 2
    Public Engagement ................................................................ 2

Vision ........................................................................................ 4
    Brand ................................................................................... 4

History ....................................................................................... 9
Demographic Insights ................................................................. 13
Land Use ................................................................................... 18
Land Use Goals/Objectives .......................................................... 24
Relationship to Adjacent Municipalities and the Region .................... 27
Implementation Program ............................................................. 29

ECONOMIC VITALITY ................................................ 31

Introduction............................................................................... 32
Economic Insights & Key Issues ................................................... 34
Economic Vitality Goals/Objectives ............................................... 37
Introduction............................................................................... 40
Infrastructure Insights & Key Issues ............................................. 41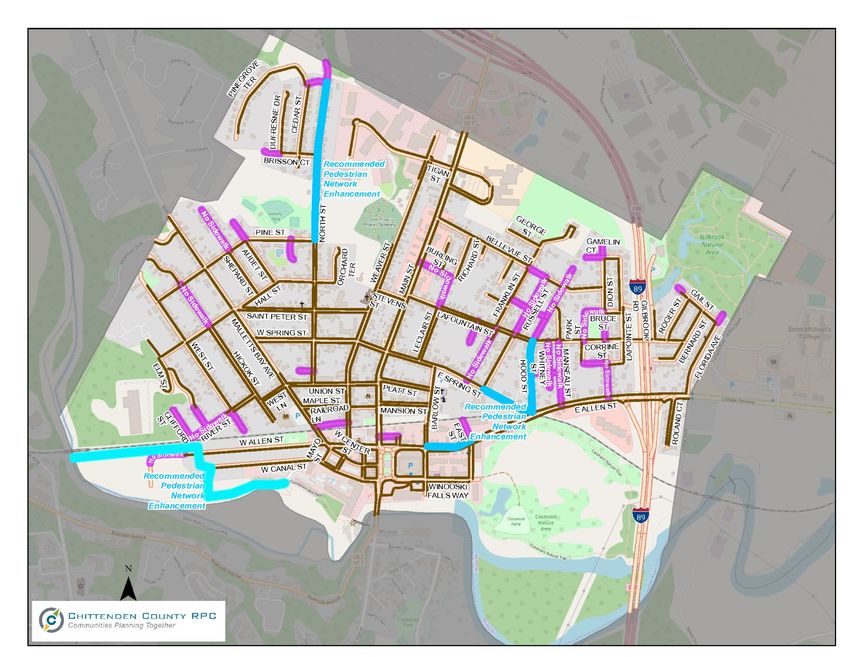
Transportation ...................................................................... 41

     Parking ................................................................................ 45
     Wastewater .......................................................................... 45

     Water .................................................................................. 46

     Stormwater .......................................................................... 46
     City Trees ............................................................................ 47

     Hazard Mitigation .................................................................. 47

     Energy ................................................................................ 48
     Communication Services ........................................................ 48

Municipal INfrastructure Goals/Objectives ..................................... 52

SAFE, HEALTHY, CONNECTED PEOPLE ...................... 54

Introduction............................................................................... 55
Safe, Healthy & Connected People Insights & Key Issues ................. 56
    Public Health ........................................................................ 56

     Healthy Food Access ............................................................. 57

     Education ............................................................................ 58
     Parks................................................................................... 59

     Community Connections/Programming .................................... 61

     Safety: ................................................................................ 63
     Winooski School District......................................................... 65

Safe, Healthy, Connected People Goals/Objectives ......................... 68

HOUSING.................................................................. 71
Introduction............................................................................... 72
Housing Insights & Key Issues ..................................................... 73
   Type of Structures ................................................................ 73

     Rental Housing ..................................................................... 74
     Homeownership .................................................................... 75

     Housing Demand .................................................................. 76

     Balanced Housing Stock......................................................... 78
     Quality of Housing Stock ........................................................ 78

     Homelessness ...................................................................... 79

Goals/Objectives ........................................................................ 80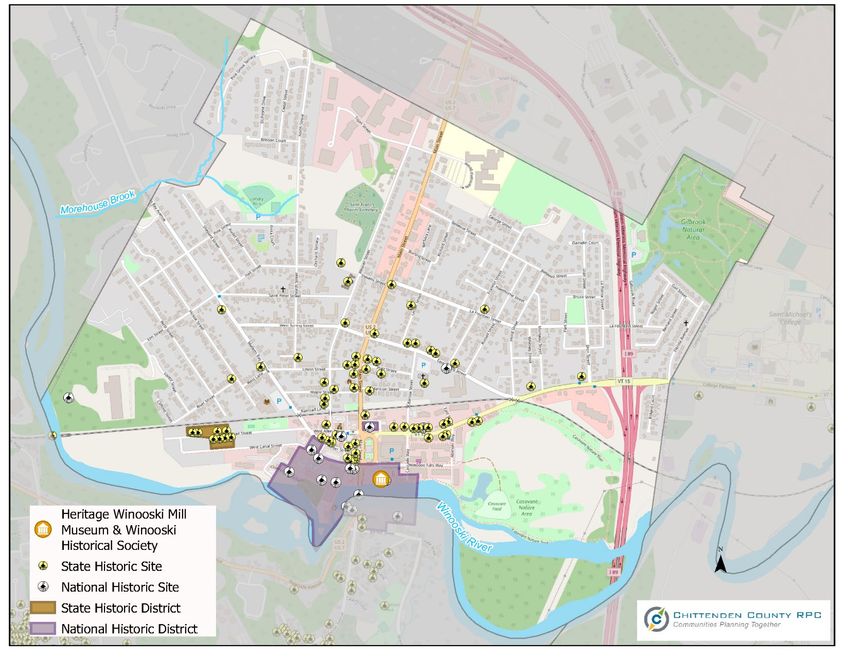
INTRODUCTION

1
PURPOSE OF THE PLAN

Winooski’s Master Plan presents a vision for land use and development in the present
and for the future. It provides a framework for enhancing the quality of life, a basis
for public and private investment, and it will be the guiding document for civic action.
The Plan will support Winooski in responding thoughtfully and appropriately to
changing economic, social and environmental conditions in the City and the region.

The City has engaged in numerous planning efforts on specific topics over the last few
years (e.g. Visioning, Economic Development Plan, Transportation Master Plan, Parking
Plan, Housing Needs Assessment, Gentrification Analysis, Branding Study, etc.). This
Master Plan is a high-level overview document that summarizes and references the
more specific plans. The Plan is organized by the City’s Vision statement.

Public Engagement

This Plan builds upon the previous, more specific, planning studies and the engagement
that took place in the development of them. Each of those planning efforts included a
significant amount of public engagement including online surveys, focus groups, door
to door surveys, community dinners, etc. In addition to building on those efforts, the
Planning Commission received input from each of the three City Commissions in
developing this Plan: Public Works Commission, Public Safety Commission and the
Community Services Commission.

The process also included a flier located in numerous places throughout the City and
posted on front porch forum to alert the community of the effort and explain how
citizen’s can get involved. In addition, input and feedback were also sought at the
Farmer’s Market, Halloween Party and the Mayor’s Live at Five show. The final draft
was noticed and distributed as required by statute both for the Planning Commission
and City Council’s hearings.

2
3
VISION

Winooski will continue to be a livable, diverse, and affordable community where the role
of government will be to foster and guide:

Economic Vitality: Maintain and expand our economic development to ensure long-term
vibrancy.

Municipal Infrastructure: Invest in the City’s municipal infrastructure, including energy
resources, facilities, technology, roads, sidewalks, and water, sewer, and storm water
lines, to make our City safe and accessible to residents and visitors while recognizing the
critical role that we play in the region’s system.

Safe, Healthy and Connected People: Foster relationships across generations and
cultures by providing safe, healthy environments and opportunities to connect and
engage.

Housing: Ensure a mix of quality housing that maintains and enhances Winooski’s
unique sense of place and supports the needs of the entire community.

Brand

In addition to the vision statements, the City’s brand helps describe the past, current
and future direction for the City.

      Winooski: Vermont’s Opportunity City

      For almost 100 years, Winooski has welcomed strivers – people looking to build a
      better life for themselves and their families. We’re a small city where neighbors
      know each other. We’re a city where all of our kids learn together, play together,
      grow together. We’re a community where everyone can participate in city
      government, in neighborhood gatherings and in our lively downtown. We’re always
      striving to improve our city and to welcome our next new neighbors.

4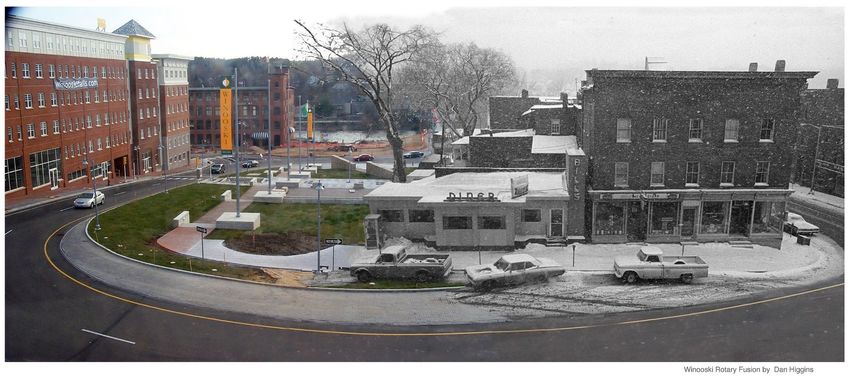
5 Winooski Welcomes You
Winooski Welcomes You
6                       translate
7
Winooski Welcomes You   translate
Winooski Welcomes You
8                       translate
HISTORY

3,000 BCE - 1000 CE Native Americans intermittently occupied the banks of Winooski
Falls -Winooski Site Feeney, 2002

1700’s: Europeans began moving to North America, bringing diseases such as smallpox,
and Native American populations start to decline in the Winooski River Valley.

1770’s: Ira Allen builds Blockhouse which serves as fort, general store and office for land
speculating Onion River Company

1789: Ira Allen builds dam across the Winooski River with sawmills at each end

1830’s: Winooski Mills built and became the state’s leading textile manufacturing center
and the city’s major employer for over
100 years

1866: Frederick Kennedy, Mill agent
requests Vermont legislature to
incorporate the Village of Winooski

1867: Winooski Block is built by
Francis LeClair, Peter LaFountain and
Edwin Chase on the former site of Ira
Allen’s home

1909: Lewis Hine, photographer for the
National Child Labor Committee, visits and
takes photos in the mills.

1922: After 54 years as a Village,
Winooski becomes a City via a charter
change by the state Legislature and a
vote by the residents, separating from the
Town of Colchester. Link to this article for
what life was like in Winooski in 1922:

https://www.burlingtonfreepress.com/story/news/local/2014/09/19/winooski-became-
city/15608231/

9
1927: Major Flood that destroyed dams, bridge and mills suffered major damage

1952- Porter Screen Factory, once the largest producer of screen doors and windows in
the world, ceases manufacturing.

1954: American Woolen Company closes mills at Winooski

1959: New Winooski High School opens on Upper Main Street

1965: Mayor Dominque Casavant applies
Winooski for the Model Cities program to
receive federal funding for the
improvement of the city. Program funding
allows the city to improve sewage
treatment, upgrade water system,
improve parks, build a public pool, a new
fire house, and provide affordable housing
for the elderly and disadvantaged.

1970- Winooski Urban Renewal Agency
established under Model Cities program.
Acquires downtown property on East side
of Main Street through eminent domain
for demolition of buildings to open area
for new development. In 1973, historic
"Fort Pick" neighborhood is destroyed and
residents relocated.

10
1973: Vermont Furniture Company factory on Malletts Bay Ave. burns, leaving hundreds
without jobs

1976: York Electric built a plant in the newly designated area of Highland Park

1973: Gilbrook reservoir no longer used as Winooski’s primary water supply (reservoir
drained in 1983)

1979: The City researched the idea of a dome over the City to reduce heating costs.
Internal combustion engines would have been banned.

1980: Refugee Resettlement Program Begins in Vermont

1980’s: Revitalization begins with restoration of mill buildings. Ray Pecor acquires the
Champlain Mill and restores the building for retail and office space. Prompts a temporary
downtown renaissance in the early 1980's with other former industrial structures
converted to condos and apartments.

1999: Downtown revitalization begins

2003: State Downtown Designation Received

2004: TIF District is established

11
2005: Riverwalk Promenade Opens

2005-6: Circulator was Built

2006: City wins National Smart Growth award for New Downtown

2012: Waking Windows Begins

2016: Form Based Code zoning approved for the Gateways

****Looking Ahead****

2022: Winooski celebrates its 100th birthday!

2025: TIF Expires

12
DEMOGRAPHIC INSIGHTS

Key trends in Winooski can be summarized as follows:

•   Winooski’s population is increasing since it’s second revitalization period as shown
    between 2000 and 2010; and this growth is likely to continue going forward.

•   Winooski is Vermont’s most racially and ethnically diverse community.

•   Essentially half (48%) of Winooski’s population falls into the age cohort between 20-
    44 years old – a significantly younger population than the County and the State.

•   60% of Winooski’s housing stock is rental and 51% of rentals are subsidized –
    significantly higher than the County as a whole.

•   25% of Winooski’s households are below the poverty line.

•   Winooski has a well-educated workforce, with almost 90% of the population over 25
    holding a high school diploma or a higher level of education, and over 50% holding a
    bachelor’s degree or higher.

Winooski’s historic population growth follows the growth of the mill industry, the decline
thereafter, and the two subsequent revitalization efforts. While there is no accurate
population count since 2010, there is an assumption that the City has grown considering
the housing development that has occurred. Looking forward it is helpful to study a
probable future trend. The forecasted population growth represents 10% growth
between 2020 and 2050. This is in line with Chittenden County’s historic and projected
population growth as well. However, the State’s total population has remained relatively
unchanged lately and
                                        Winooski Historic and Forecasted
is forecasted to grow                         Population Growth
at a much slower rate.      8500
While there is no           8000
                            7500
certainty in a specific     7000
                            6500
amount of growth, it is
                            6000
likely that Winooski will   5500
                            5000
continue to grow based      4500
on it being an                 192019301940195019601970198019902000201020202030204020502060

attractive place from               Source: US Census and CCRPC Projections approved in 3/2017, by
                                            Economic & Policy Resources for 2018 ECOS Plan
environmental,
economic, and social perspectives.

13
Winooski is Vermont’s most racially and ethnically diverse community, including 6.9% of
residents identifying as Black or African American, 6.2% as Asian, 3.4% who choose the
classification “two or more races”, 2.2% who identify themselves as Hispanic or Latino
(of any race) and under 1% who identify themselves as American Indian or Alaska
Native i.
Winooski has a relatively young population. Essentially half (48%) of Winooski’s
population falls into the age cohort between 20-44 years old, compared to 36% in the
County and 30% in
Winooski's Age Distribution
the State. As of
2016, the city’s Percent of Population
0 5 10 15 20 25 30
median age was
Under 5 years
32, whereas 5 to 9 years
10 to 14 years
Chittenden
15 to 19 years
County’s median 20 to 24 years
age was 36 and 25 to 34 years
Age
35 to 44 years
the state’s reached 45 to 54 years
43 ii. 55 to 59 years
60 to 64 years
Source: 2012-2016 65 to 74 years
75 to 84 years
American Community
85 years and over
Survey 5-Year
Estimates. Margins of
Error included.
Another important component of age demographics is the growth rate of those over the
age of 65. While
Chittenden County Projected Population Over 65 Years
Winooski’s
25%
percent of the
Percent of Popualtion over 65 years
population over
20%
age 65 is
relatively lower
15%
than the County
and State (10%,
10%
13% and 17%
Scenario A Scenario B respectively), the
5% growth of this
2000 2010 2020 Projection 2030 Projection
demographic is
Source: Vermont Agency of Commerce and Community Development
14still a factor for consideration in planning for the City’s future. This age cohort is
projected to be just under a quarter percent of the population in 2030, more than double
the 2010 population.
Winooski has a well-educated workforce, with almost 90% (+/-5.0%) of the population
over 25 holding a high school diploma or a higher level of education, and 52.3% (+/-
10.2%) holding a bachelor’s degree or higher (American Community Survey 5-Year
Estimates, 2012-2016, Table S1501). Regarding educational attainment, Winooski is
more on par with the State than Chittenden County iii.
Educational Attainment for the
Population over 25 years old
Graduate or professional degree
Bachelor's degree
Associate's degree
Some college, no degree
High school graduate (includes
equivalency)
0% 5% 10% 15% 20% 25% 30% 35%
Winooski Chittenden County Vermont
Winooski has seen a nearly 5% increase in median household income over the last five
years (however it is important to note that inflation over this same time period was
about 6.4% iv, outpacing the income growth). Data from the 2011 American Community
Survey estimates reported a median household income of $47,292. This grew to just
over $49,596 per recent estimates for 2016 (ACS data). This growth was lower than the
rest of Chittenden County, and on par with the rest of the state. Despite this growth, the
city’s median household income remains below those of Chittenden County and
Vermont. Last but not least, Winooski’s rate of poverty is significantly higher than the
County and the State.
Residents in Margin of Chittenden Margin of Margin
Winooski Vermont
Winooski Error County Error of Error
Median Household
$49,596 +/-6,355 $66,414 +/-2,090 $56,104 +/-793
Income1
15People Whose
Income in the Last
24.6% +/-6.8% 10.9% +/-0.8% 11.3% +/-0.4%
12 Months Is Below
the Poverty Level1
1 - 2012-2016 American Community Survey 5-Year Estimates (DP03: Selected Economic
Characteristics)
Another factor to consider is the average wage of Winooski jobs, as opposed to Winooski
resident income. Only 14% v of Winooski residents work in the City (including those that
work at home), so while this is less relevant to Winooski residents it is a factor in the
economy of the City. The average wage of jobs in Winooski is $49,635 (note this is just
from covered employment and averages hourly and salaried workers). Average earnings
is $62,901 (note this includes wages, salaries, supplements (additional employee
benefit) and proprietor income). It’s not clear why this is higher in Winooski than in
Chittenden County, but could be indicating a competitive advantage in jobs in Winooski.
Chittenden
Jobs in Winooski Winooski Vermont
County
2016 Average $49,635 $51,453 $45,054
Wage1
Average Earnings2 $62,901 $59,417 $51,720
1 - Vermont Department of Labor Economic & Labor Market Information: Covered Employment
& Wages, 2016
2 – Economic Development Plan, EMSI.
Unemployment rates in Winooski were higher than Chittenden County and the State
prior and during the recession. Since the recession the rates are higher than Chittenden
County but lower than the State. Unemployment reached its highest point during the
recession in 2009 and has declined since. In fact, unemployment rates are very low
currently, and begin to speak to a labor shortage. However, underemployment is a
useful statistical measure that includes both the traditional measure of unemployment
(those who are unemployed and actively looking for work), and additional measures
including discouraged workers (who have stopped their active search for employment),
and those who work part time but would prefer to work full time. This is measured only
at the state and national levels, where it has tended to be roughly twice the
unemployment rate.
16Unemployment
14%
12%
10%
8%
6%
4%
2%
0%
2007 2008 2009 2010 2011 2012 2013 2014 2015 2016 2017
Winooski Unemployment Chittenden County Unemployment
Vermont Unemployment Vermont Underemployment
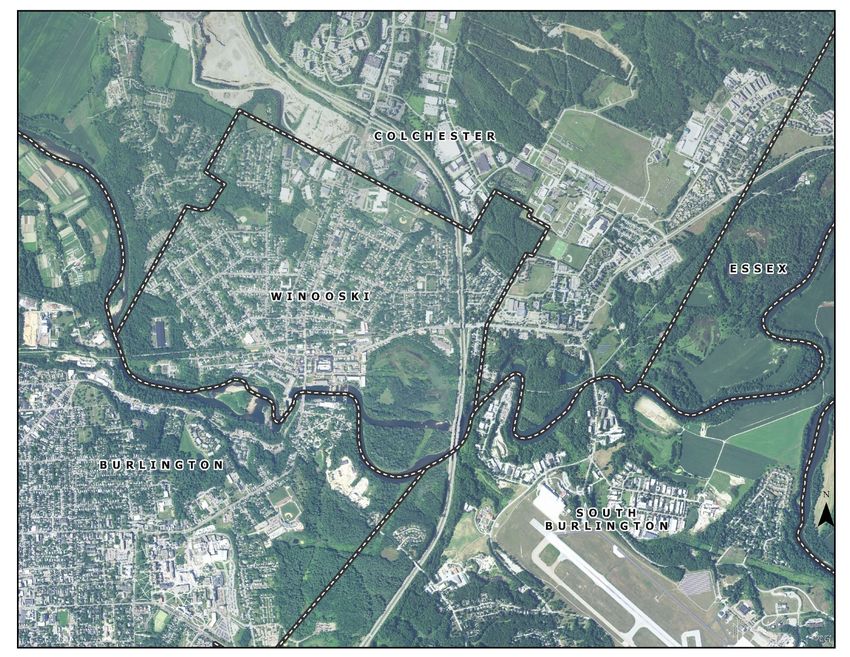
The urban fabric is unique as Winooski is the most densely populated municipality in
northern New England (Maine, New Hampshire, and Vermont) at 5,191 people per
square mile in 2010. As a comparison Chittenden County’s density is 291 people per
square mile.
17LAND USE Winooski has undergone substantial physical changes in the last decade, marking its second and more successful revitalization since the close of the mills in the 1950’s. This success can be seen in the City’s rich ethnic diversity and associated businesses and the high percentage of young professionals in the City – an age cohort looking for an urban environment with strong community bond. Future Land Use Map Existing Land Use Map (Zoning Map) 18
Downtown - Downtown has continued to develop based on the master plan for the area
approved in 2001. The purpose of the district is to provide for orderly physical and
economic growth by allowing and encouraging high density, mixed use land
development. It has become a hub for restaurants, bars, and events such as Waking
Windows that serve regional customers. There is a perception that not enough parking
exists, and there is a likely need for parking on the west side of downtown. See the
municipal infrastructure chapter for more details.

Gateways – The purpose the Gateway Districts is to create a walkable, mixed-use
development dependent on three factors: density, diversity of uses, and design.
Development and redevelopment of the Gateway Districts are intended to follow the
vision identified in the Winooski Public Design Workshop Vision Plan. The development
regulations, adopted in 2016, are established in the Winooski Gateways Form Based

19
Code (“the Code”) found in Appendix B of the Unified Land Use and Development
Regulations. The Code places greatest emphasis on design, or physical form, because of
its importance in defining neighborhood and corridor character. Interviewees for the
Economic Development Plan noted that this new code provides greater ease in
determining the right location to start a business in Winooski, and helps both residents
and developers in defining the look and feel of new city development.

Residential Neighborhoods – The purpose of the residential districts is to
accommodate safe, livable, and pedestrian friendly residential neighborhoods with
inviting streetscapes. The density increases moderately between Zoning District A and B,
while Zoning District C serves as a transition between Zoning Districts A and B and the
commercial districts. Infill development in Zoning District C will be balanced with privacy
of surrounding homes, preservation of neighborhood character and safe housing
conditions.

Commercial and Industrial – The purpose of these districts are to encourage, retain
and protect commercial and industrial businesses. The commercial land uses are largely
in the downtown and the gateway districts. Casavant Natural Area is also currently
zoned for commercial, and this should be analyzed for recreational uses. There are three
locations in the City zoned for industrial. Two of these industrial zones are largely
unused, with one being a stretch of land northeast of Gilbrook Natural Area (adjacent to
a Colchester industrial park) and the other being a wooded area west of Clifford Street
that currently houses the manufacturing operations of Country Home Products.
Components of those properties should be analyzed for recreational uses. The third
area, the Winooski Highlands Industrial Park, is home to 11 standalone buildings,
housing a diverse array of industries including a life science instrument manufacturer,
hockey training center, and soap manufacturer. The park has 3-phase power, water,
sewer, natural gas, and internet connections.

Natural and Cultural assets - Winooski has an abundance of revered natural,
recreational and cultural assets. With 22% of its land area in natural/open space and
parks the City has a good amount of area for outdoor recreation and enjoyment, wildlife
habitat and ecological services (i.e. water quality protection). While, there is much more
detail about parks and recreation in the Safe, Healthy and Connected People chapter,
and more about the economic benefits of these resources in the Economic Vitality
chapter, this section addresses the cultural and historic resources, as well as the
ecological systems.

20
Cultural & Historic Resources - Cultural assets include 81 historic sites (14 are National
Historic Sites and 67 are State Historic Sites), the Mill Museum, places of worship,
archeological resources, and community centers. The 2016 zoning re-write attempted to
connect Winooski’s historic resources protection with the State Historic Preservation
Office; unfortunately, that approach has not been effective. The City should review this
section of the Unified Land Use Regulations to ensure proper protection of the City’s
historic sites.

Flood Hazard Area – The purpose of this district is to avoid and minimize the loss of life
and property, the disruption of commerce, the impairment of the tax base, and the
extraordinary public expenditures and demands on public services that result from
flooding. Flood is a natural and increasingly common challenge, somewhat managed in

21
Winooski by the existing
dams. Development in
this area is regulated
very specifically under
the Inundation Hazard
Area Regulations
(Appendix A of the
Unified Land Use and
Development
Regulations). Photo:
Winooski River during Irene
River Corridors – These
are areas where a river
or stream naturally
moves to establish
equilibrium, plus adjacent land to provide “wiggle room” for the river’s movement. River
Corridors are a relatively new term, and protection of these areas is not required by the
State, but it is strongly encouraged and incentivized through the Emergency Relief
Assistance Fund (ERAF). When disasters happen, towns may receive assistance money
from the ERAF. Towns that protect river corridors (and the other four ERAF
requirements) will be responsible for a lower share of the match requirement for these
funds. Winooski currently has an “interim” eligibility (aka “early adopter”) because they
protect streams and rivers through setback requirements. However, once the Statewide
River Corridor dataset is updated with the local assessment data, municipalities with
interim eligibility will have two years to:
1. Adopt a River Corridor overlay or a River Corridor Protection Area overlay for
all streams draining a watershed greater than 2 square miles, and
2. Adopt a River Corridor setback of at least 50 feet from the top of bank for all
streams draining an area between ½ and 2 square miles, and regulate this setback
as a River Corridor.
While Winooski currently has regulations for the flood hazard area, it does not have
regulations to protect the River Corridor. As currently mapped the River Corridor is more
expansive than the flood hazard area. The map below is hyperlinked to the CCRPC online
river corridor map, click on it to explore this information further. To continue receiving
the best match for emergency relief assistance funds the City will need to review this
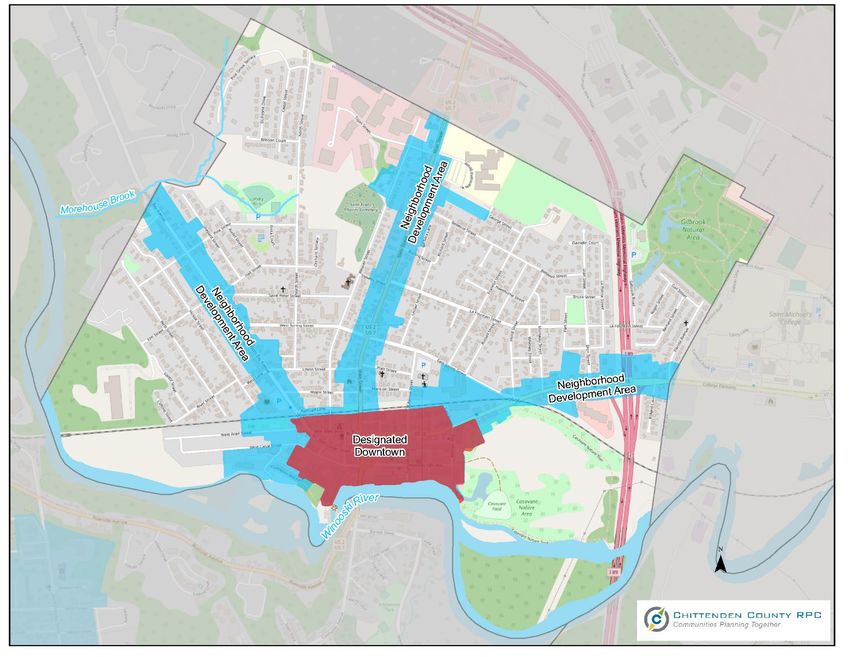
22mapped area, work with the state to make sure it is accurate and develop land use regulations to protect these areas. Wildlife Habitat, Forest Blocks & Natural Resources – Considering Winooski is a growth area, this plan calls for promotion of vegetative landscaping in new development projects and municipal improvement projects to manage storm water, protect water quality and air quality, increase carbon sequestration and establish urban place making. Secondarily this plan calls for protection of forest blocks, wildlife connectivity resources and crossings, surface waters, riparian areas and other significant habitats (e.g. wetlands) from development and fragmentation along the undeveloped parts of the Winooski River and the Gilbrook Natural Area (as shown in the maps associated with the Energy Appendix) While there are other mapped resources in the city, like primary agricultural soils, it is not the intent of this plan to protect those resources from development considering agricultural operations (outside of community gardens) are not feasible on small parcels isolated from more intact open agricultural areas. Further, mitigation of these soils through state development approval processes does not seem appropriate in such an urban environment. State Designations - Also, the City of Winooski benefits from three smart growth, economic development programs: Designated Downtown, Designated Neighborhood Development Area, and a Tax Increment Financing District. Benefits of these programs include increased competitiveness for state grant programs; tax program to increase 23
funds for public infrastructure; tax credits to lower the cost of construction; and quicker,
predictable and lower costs for state permitting. The Neighborhood Development Area is
currently on the Gateways, but the City may request that the designation be expanded
to the City’s boundaries to help alleviate state permitting hurdles, such as agricultural
soil mitigation fees.

LAND USE GOALS/OBJECTIVES

   1. Preserve the scale, character, and value of established neighborhoods by ensuring
      that new residential development is well integrated with existing development as
      called for in the Unified Land Use & Development Regulations.
   2. Review zoning to maximize opportunities for the recreational economy.

24
3. When considering residential neighborhood redevelopment allow for neighborhood
scale retail within residential neighborhoods.
4. Maintain and improve the City’s parks and open spaces for wildlife habitat and
crossings, water quality protection, flood attenuation, carbon sequestration, and
human enjoyment.
5. Promote vegetative landscaping in new development projects and municipal
improvement projects to manage storm water, protect water quality and air
quality, increase carbon sequestration and establish urban place making; and
protect forest blocks, wildlife connectivity resources and crossings, surface waters,
riparian areas and other significant habitats (e.g. wetlands) from development and
fragmentation along the undeveloped parts of the Winooski River and the Gilbrook
Natural Area.
6. Maintain the flood hazard area to protect from flooding.
7. Transform the Gateway districts using both public and private sector investment
to:
a. Capitalize on public investment in existing infrastructure
b. Stabilize and strengthen mixed-use commercial areas and residential
neighborhoods
c. Create a pedestrian-friendly and multi-modal district
d. Promote, create, and expand housing options
e. Ensure a complementary relationship between the Corridors and the
surrounding neighborhoods
8. Maintain and evolve the commercial and industrial districts as needed to retain
and grow existing businesses, and enable start-ups and tech businesses.
9. To continue receiving the best match for emergency relief assistance funds the
City will need to review the mapped River Corridor area, work with the state to
make sure it is accurate and develop land use regulations to protect these areas.
10. Protect, preserve, develop and use Winooski's historic, cultural and
architectural resources to stimulate a more meaningful environment for its citizens
and the region; maintain the architectural and historical integrity of existing
buildings or features; and ensure the compatibility of new construction or usage to
adjacent properties.
11. Review and improve the historic preservation section of the Unified Land Use
Development Regulations to ensure proper protection of these resources.
2512. Consider expansion of the Neighborhood Development Area designation to
the entire City.
26RELATIONSHIP TO ADJACENT MUNICIPALITIES AND THE REGION To be updated based on draft Burlington and Colchester new plans. Pursuant to section 4382 of Title 24, Chapter 117 of the Vermont Statutes, this plan is compatible with approved plans of neighboring municipalities and with the Chittenden County Regional Plan, titled the ECOS Plan. Existing land uses along Winooski’s common borders with Burlington, Colchester and South Burlington are established and zoning both in Winooski and neighboring communities is compatible. Proposed land uses for these areas is not inconsistent. In large measure, floodplain associated with the Winooski River determines abutting land uses along the Burlington and South Burlington interfaces. Land uses along the borders with Colchester vary: 27
•   Eastern border with Colchester – residential and open space in Winooski, and St.
    Michael’s College in Colchester. Colchester’s 2014 Town Plan states: “There are no
    plans to expand the campus westward and care has been taken to mitigate the
    impact of the existing campus on adjacent residential areas. For these reasons,
    Colchester’s proposed future land use plans are compatible with Winooski’s.” From
    Winooski’s perspective there are no changes in land uses, and therefore this Plan is
    compatible with Colchester on this border.

•   Northern border with Colchester – Winooski’s existing and future land uses include
    the school, commercial, industrial and residential; while Colchester’s existing and
    future land uses include commercial, business park, and an existing quarry.
    Colchester’s 2014 Town Plan states: “A small portion of residentially designated land
    abuts the Commercial / Industrial lands of the pre-existing quarry operation. This is
    an existing situation that will not be made worse by the proposed plan. The industrial
    area of Winooski is compatible with the Commercial / Industrial area of Colchester
    and shares the same types of uses. Through its zoning, Colchester has sought to
    mitigate any negative impacts to the public lands in Winooski by prohibiting new
    drive-up businesses within 300 feet of a school, library, or hospital. Should the public
    use in Winooski be altered, Colchester will likely consider lifting these conditions from
    current zoning. The City and the Town should work together to ensure that any
    changes within this area are compatible and conflicts are minimized.”

•   Eastern border with Colchester – Winooski’s existing and future land uses are
    residential as are Colchester’s therefore the plans are compatible on this border.

The ECOS Plan designates Winooski as an area planned for growth with two specific
planning area designations: Center and Metro. This Plan and the regional plan are
compatible.

28
IMPLEMENTATION PROGRAM The goals in each chapter of this plan provide a framework for achieving the City’s vision. While this Plan covers an eight-year timeframe from 2019 to 2027, it will be implemented via annual work programs. The City will work toward the goals of this Plan through implementation of the following more specific Plans: Economic Development Plan, Transportation Master Plan, Parking Plan, Housing Needs Assessment, Housing Targets (in development), Branding Study, Police Strategic Plan, the annual Capital Improvement Plan and the Open Space Plan and Recreation Program Plan once developed. It is important to note, starting in 2020 the Capital Improvement Plan will be developed based on an asset management program to ensure the City is addressing capital needs in a systematic and fiscally responsible manner that will improve reliability and long-term system integrity. In addition, this Plan is implemented through enforcement of the City’s Unified Land Use & Development Regulations. Monitoring and reporting of the Plan’s success will be done through the City’s Annual Report which is organized based on the City’s vision statement. While the Chittenden County Regional Planning Commission (CCRPC) reviews the Plan to ensure consistency with the state planning goals and compatibility with the Regional Plan and adjacent municipalities; they will also conduct a mid-term review during the eight-year timeframe to ensure the Plan is being implemented. Implementing this Plan will require a collective and inter-related approach. It is collective in that no one piece will bring success without the others. For example, success within the Winooski School District can be achieved by staying in the District through graduation, staying within the District requires stable housing, and stable housing can only be found with consistent work and income. Visually, these collective, inter-relationships are described in this circle of prosperity. 29
In addition, the City cannot achieve success without partnerships with a variety of
sectors: public (state, municipal and regional), business, and non-profit. Examples of
these partnerships include mutual aid agreements with adjacent municipalities, rescue
services provided by St. Michael’s, Memorandum of Understanding with the Winooski
School District, Winooski Downtown Partnership, etc.

30
ECONOMIC VITALITY

31
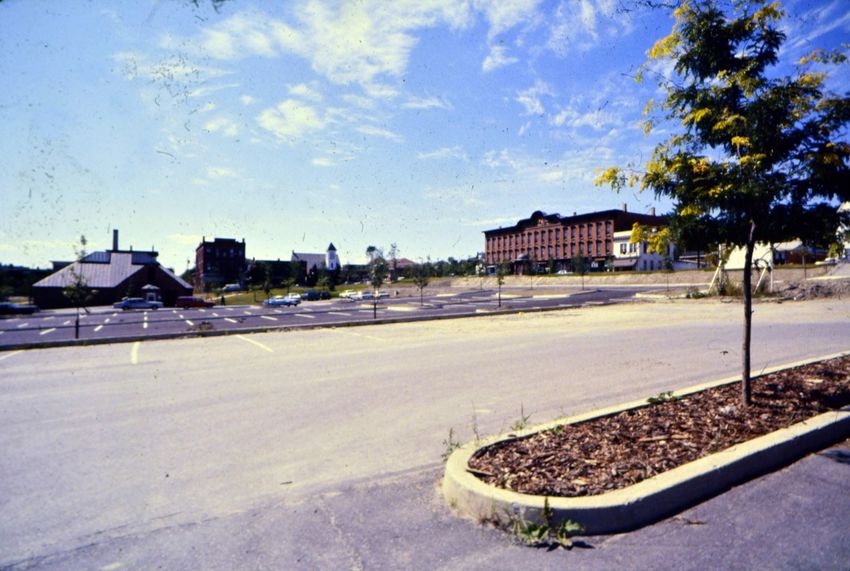
INTRODUCTION
Text largely from Winooski – “The Brooklyn of Burlington”. Public Investments Spark Revitalization. VT Agency of
Commerce and Community Development. 2018.

With a vibrant grist and woolen mill industry beginning in the late 1700s, Winooski was
Vermont’s largest center of employment by the early 1920s. At its height, the mills
employed 3,000 people. Market forces steadily shifted after World War II. By the early
1950s the last of the area’s mills had closed its doors, and the City struggled for decades
to reinvent itself.

In the 1970s, well-intended urban renewal projects demolished two downtown city
blocks for parking. By the 1980s, economic development efforts centered on conversion
of the Champlain Mill into a shopping mall but by the early 2000s, the building was
largely vacant vi.

In 2004, the city set forth an ambitious $175 million “Winooski Downtown
Redevelopment Project” aimed to infill and revitalize the fragmented downtown area vii. A
new downtown in Winooski quickly emerged and brought new housing units to
downtown, new businesses in the renovated Champlain Mill building, the Vermont
Student Assistance Corporation headquarters, a new campus for the Community College
of Vermont and Spinner Place, a 312-bed student dorm.

Site Conditions in 1999 viii:                                 Early Conceptual Plan for the Downtown ix:

Winooski now bustles with excitement and activity, with hundreds of new housing units
and downtown jobs, a popular farmer’s market and thriving night life. “The leaders and
residents of Winooski had the courage and foresight to take risks in imagining what
Winooski could become,” said Mayor Seth Leonard. “Our hard work is not finished, and

32
their continued support will be needed as we build on the strong foundation that was
established and work towards our bright future.” x

                                   Photo from Downtown Winooski

The revitalization of Downtown could not have happened without State Downtown
Designation, financing offered by the Department of Housing and Community
Development, funding from the Vermont Agency of Transportation, and the creation of a
Tax Increment Financing (TIF) District xi.

The City has also worked on improvements in other parts of the City as well. In the
Gateways, the vision established by a robust planning process was codified into Form
Based Code zoning in 2016. Private investments and improvements have already been
made on these corridors. Public infrastructure improvements in the Main Street corridor
have been supported by the City by the passage of a bond vote in May 2018. The City’s
industrial parks are also important to the economic vitality of the City and Region.

Connections to other sections of the Plan: A vital economy is critical to other aspects of
this Plan as it provides a tax base for providing City infrastructure and services, jobs for
the region and State, and a healthy downtown with activities for residents and visitors.
Also Winooski’s natural, recreational and cultural assets and programs add to a quality
of life that is attractive to residents and visitors – without this, it would not likely be a
place where businesses would want to be. As an example, river access, nature walks,
the Gilbrook Nature Area, as well as proximity to Lake Champlain, were all listed as
important assets for the benefit of local and regional residents, as well as visitors in the
Economic Development Plan.

33
ECONOMIC INSIGHTS & KEY ISSUES
A vital economy is dependent on
many factors. Winooski is an
economic leader in the region and
the state from a variety of
perspectives:
• Vibrant Downtown with an active
partnership program (Downtown
Winooski), state designation with
building improvement tax
incentives, walkable and multi-
modal transportation hub,
exemplary restaurants and many
community events and activities
for residents and visitors (i.e.
farmers market, Waking Windows,
Winooski Wednesdays, Winooski
Halloween etc).
• A ‘get to yes’ development
perspective in the Gateways to
revitalize these corridors, improve
walking and biking infrastructure,
and address the housing
shortage; as well as community support for a bond to improve Main St.
• A welcoming community and a diverse population, including New Americans opening
small businesses.
• Businesses with social missions that care for the wellbeing of their employees and the
community as a whole (e.g. Twincraft’s partnerships with CCV, VT Adult Learning and
Working Bridges).
• Staff, elected officials and volunteers dedicated to ensuring that its residents and
businesses thrive.
34Businesses & Jobs - The businesses that collectively make up Winooski’s economy are
very diverse, including but not limited to: a life science instrument manufacturer, hockey
training center, soap manufacturer, tech industries, reading solutions, local credit union,
community college, student financial services, economic support service for women,
catering, brewery, a variety of ethnic and award winning restaurants, coffee shop, small
businesses with unique/locally sourced products, and music venue. Specific insights into
employment in Winooski as identified in the Economic Development Plan include:
• There were an estimated 4,167 jobs in the City of Winooski in 2016. Job growth
within the City was 8% between 2011 and 2016, equivalent to an increase of 299
jobs.
• Local educational institutions have a strong presence in the
Winooski labor market. Postsecondary Teachers are the most
common occupations in the area by a substantial margin driven
by the operations of the Community College of Vermont, as well
as University of Vermont in Burlington and St. Michael’s College in
Colchester, and teaching assistants and administrative staff are
employed in higher numbers than elsewhere in the state.
Occupations that support the education system, including
Teaching Assistants and Administrative Staff are employed in
higher numbers than elsewhere in the state.
• Outside non-governmental industries, Winooski’s strongest
industry cluster is in Professional, Scientific, and Technical
Services, particularly Custom Computer Programming Services
which is nearly 12 times more clustered in Winooski compared to
the rest of the United States. This could mean that Winooski will
continue to attract these industries.
• Small businesses are crucial to the city’s economic vitality as 58% of businesses in
Winooski have less than 5 employees and 98% of businesses have less than 50
employees.
For more information on the economic outlook for Winooski residents see the
demographic section for income and unemployment statistics.
35Looking forward, while many things are going well for Winooski, there are some
challenges that will need to be addressed
for the City to continue to thrive. Moving
forward the City will continue to address
challenges identified in the Economic
Development Plan. For example, the City
will continue working on:
• improvements to wayfinding signage to
encourage passersby to stay,
• parking improvements to help people
locate and pay for parking more easily
• diversifying the housing stock through
continuing to allow more housing and
monitoring the diversity of the total stock.
See other chapters of this Plan for further
detail on these efforts.
In addition, a critical component of
maintaining economic vitality is to
develop relationships with existing
businesses to retain them and assist them
with growth; followed by recruitment of
new businesses. These concepts are
reflected in goals 1, 2, 5 and 6 below. Also, included in the goals below are
infrastructure and quality of life improvements important to a well-rounded environment
for economic vitality and growth.
Last but not least, it is not only important to maintain what is going well and address the
existing challenges, but to dream about what could be. The opportunity to expand the
cultural and artistic offerings with a dedicated district was mentioned several times by
interviewees in development of the Economic Development Plan and this Plan supports
this concept.
36ECONOMIC VITALITY GOALS/OBJECTIVES
Please see the Economic Development Plan City of Winooski by Camoin Associates for
a more detailed list of actions. [hyperlink]
1. Foster business development retention and expansion by
Support for small
building on regional assets, local resources, and existing
locally-owned
business environment dynamics through promotion of
businesses was
available resources and financing opportunities, advancing
expressed by
networking opportunities and commitment of local resources.
economic
2. Diversify and enhance services available to existing development plan
residents and business community to address the needs survey respondents
identified in the Economic Development Plan and pursue and the Public Works
additional planning initiatives as resources allow. Commission.
3. Maintain, manage, and reinvigorate the city’s built
Support for an Arts
and natural environment through implementation of high
Commission was provided
priority multi-modal projects, coordination of utility
by the Community Services
upgrades with private investment on the Gateways (such
Commission; and an Arts
as utility and streetscape improvements on Main Street),
District is supported by the
and work to utilize the recreation potential of publicly
Planning Commission.
owned lands.
4. Support initiatives that enhance residents’ quality
The Public Works Commission
of life, including aspects of housing, health,
supports providing the
accessibility and community spirit. See the Housing
services for growth -
and Community chapters for more detail.
adequate sewer capacity,
5. Target economic development resources towards easy transportation access to
high-priority industries that demonstrate regional and Burlington and the interstate;
local employment opportunities such as tech-based and encouraging innovations
companies, specialized manufacturing or in transportation, utilities, and
entertainment and hospitality offerings. municipal infrastructure.
6. Utilize Opportunity Zone designation to attract and support start-ups, tech industry
and commercial and real estate investment.
377. Determine city's budgetary needs based on additional The Planning revenue that may be realized by the end of TIF period in Commission supports 2025 and identify programs that may be supported by this a Tech Hub concept. additional revenue. 8. Establish and implement a wayfinding plan to encourage those driving through to stay and visit the City’s restaurants, bars, parks and cultural offerings. 9. Pursue an Arts/Cultural District as described in the Economic Development Plan. 38
MUNICIPAL
INFRASTRUCTURE

39
INTRODUCTION

With the greatest urban density in
Vermont, Winooski is an excellent
model of urban sustainable living.
The city has much of what newer
cities hope to achieve – walkability,
transit access, a thriving downtown
and infrastructure to support it.
There are challenges that come with
that success and the age of the city’s
infrastructure and built environment.
Winooski will continue to be a model
through infrastructure and
placemaking improvements.

The City’s infrastructure is
foundational to the success of the
other elements of this Plan. Only
with adequate water, wastewater
treatment, stormwater management
and transportation access can
businesses thrive and grow, can housing be maintained, improved and supported, and
can people be safe and healthy. The vision plan for Main Street developed in preparation
for the Form Based Code incapsulates the importance of the infrastructure as a support
network for businesses, housing and healthy behaviors.

A note about climate change: Our region’s climate is already changing; warmer, wetter
conditions are expected to increase this century (Chittenden County Climate Change
Trends and Impacts). These changes will be far reaching and have impacts on forests,
trees and aquatic communities, water quantity and quality, public health, the economy
and our built environment. More intense storms at a higher frequency are expected; and
improvements to our infrastructure needs to take these changes into consideration.
Preparing locally on a variety of fronts (including but not limited to electric vehicle
charging, properly sizing stormwater treatment, and emerald ash borer preparation) so
that we can be resilient in light of these changes is imperative.

40
INFRASTRUCTURE INSIGHTS & KEY ISSUES

Transportation

Winooski has a largely urban form, with a downtown core, major gateways from each
direction, and a grid street network serving its diverse neighborhoods. Connecting these
neighborhoods is a fairly complete sidewalk network and several streets marked for
bicycles. Winooski’s density also provides the opportunity to serve both the residents
and employees of the City with public transit. Within this context of a dense land use
pattern and mature transportation network, Winooski can enhance the existing
transportation system, making connections fully multimodal, and ensuring a safe and
efficient system overall. Improvements to walking and biking infrastructure will help the
City achieve goals of connectivity, relieve pressure on parking and road congestion, and
reduce energy use from transportation. For more information on Winooski’s
transportation system and actions see the Transportation Master Plan xii [add hyperlink].

While commute trips are only a subset of the total trips people make on Winooski’s
transportation network, it is helpful to get a sense of what mode people use to make this
trip. Most commuters drive alone to work. While there have been national and county-
level trends of lower transit use, likely because of lower gas prices, the data below
indicates consistency (considering the margins of error) over time in Winooski. See the
transit section below for actual 2015 transit ridership. The margins of error are too high
on bike commuters to draw any conclusions. Winooski has seen an increase in those
working at home which is consistent with trends.

                                                 2011         Margin of Error   2016    Margin of Error
Workers 16 Years and Over                        4,085             +/-287       3,835       +/-291
Drove Alone                                     72.7%              +/-5.8       65.0%       +/-4.9
Carpooled                                        9.7%              +/-4.2       9.6%        +/-3.2
Public Transit                                   6.4%              +/-2.2       8.6%        +/-2.7
Walked                                           5.3%              +/-2.3       6.5%        +/-2.8
Biked                                            2.4%              +/-1.9       1.5%        +/-1.1
Taxicab, motorcycle, or other means
                                                 0.8%              +/-1.1       2.9%        +/-2.1
Worked at home                                   2.7%              +/-1.5       6.0%        +/-1.9
Source: 2007-2011 & 2012-2016 American Community Survey 5-Year Estimates

41
This map shows how much traffic moves through Winooski’s roadway network, clearly identifying the significance of these roadways to the region. Maintenance of this infrastructure, as well as improvements to it for safe walking and biking and placemaking is a critical component of this Plan. Biking & Walking - Over 50% of respondents to the Transportation Plan survey identified bike lanes and paths as a top issue or need the City should address in the next 5-10 years; followed by sidewalks/crosswalk improvements. The Transportation Master Plan includes detailed information on current conditions of both bike and pedestrian facilities. Bicycle infrastructure on major roads and corridors is lacking, and improvements should be made in conjunction with traffic calming and streetscape improvement projects on both Main Street and East Allen. To help identify the improvements needed for walkability, the following pink street segments have no sidewalks, and the blue segments are prioritized sidewalk improvements from the Transportation Master Plan. The goal for this plan is to address the priorities identified in the Transportation Master 42
Plan and include a sidewalk on at least one side of every street.

Transit: Winooski is currently serviced by two Green Mountain Transit (GMT) bus routes:
the #2 and #9 and 30 transit stops. April and June 2015 CCTA data
indicates approximately 585 passengers board or alight CCTA buses in Winooski on an
average day. Of these daily riders, approximately three out of every four passengers
utilize one of the six bus stops summarized in the table below xiii.
There are a total of 30 transit stops within the City, and here are the top stops
(combined between the two routes):

43
GMT has conducted an evaluation of their current system and identified improvements
to the system. The analysis and approved ‘cost neutral scenario’ improvements are
included in the NextGen Transit Plan; and GMT anticipates beginning to implement these
changes in the Summer of 2019. The tables below describe the current service levels for
each route and the changes proposed in the Plan (note under the Route 2 proposed
changes that this route will be combined with Route 6). While the NextGen Plan is a
relatively short-term plan, the Chittenden County Regional Plan included a long-term
transportation scenario in its 2018 ECOS Plan/Metropolitan Transportation Plan which
includes a longer-term plan for Route 2 to run at 15-minute headways.

  Route 2 - Current and Proposed Service Levels under the NextGen Plan
                                EXISTING                      PROPOSED
                                                          Combined: 2 Essex-
                   Route 2 - Essex       Route 6 -          Shelburne via
                      Junction        Shelburne Road         Downtown
Span of Service
 Weekday           5:45 AM-12AM       6 AM-11:20 PM        5:30 AM-11 PM
 Saturday           6 AM-12 AM       6:15 AM-8:20 PM       6:30 AM-10 PM
 Sunday            8 AM-9:15 PM          No Service          8 AM-7 PM
Headways (mins)
 Weekday
  AM Peak                15                 30                   20
  Midday                 30                 30                   20
  PM Peak                15                 30                   20
  Evening               30-80             60-75                 30-60
 Saturday               30-75               60                   30
 Sunday                  75             No Service               60

  Route 9 - Current and Proposed Service Levels under the NextGen Plan
                             EXISTING                  PROPOSED

                        Route 9 - Winooski        Route 9 - Winooski
Span of Service
 Weekday                 6:45 AM-7 PM                  6 AM-11 PM
                       11:25 PM-11:52 PM
 Saturday                6:15 AM-7 PM                  7 AM-9 PM
 Sunday                    No Service                  No Service
Headways (mins)
 Weekday
  AM Peak                       30                        30
  Midday                        60                        60
  PM Peak                       30                        30

44
Evening 1 round trip 60 Saturday 60 60 Sunday No Service No Service Transportation generally (access, reliability, cost, etc.) is a challenge for some residents, and despite being in Vermont’s biggest urbanized area it is still difficult to get to jobs, medical appointments, school, social outings, etc. Parking A sign of Winooski’s success in revitalizing its downtown is the pressure on parking; while parking management is a challenge, every thriving city struggles with it. A downtown parking study conducted by Desman Design Management xiv in 2017 found that current parking supply is adequate to meet needs, and future parking utilization would likely reach 75% in the downtown. While this data shows that there is enough capacity, there are challenges: fixed obligations on the garage spaces, a lack of parking on the west side of the circle (especially under future conditions), a perception of no parking availability and unclear signage. The City has made great strides in improving the parking management system over the last few years, and intends to continue by implementing the following recommendations from the parking study: improved space management in the parking garage, enhanced wayfinding for on-street and off-street parking, explore potential shared-use off-street parking, and common technology with surrounding communities. Wastewater The City’s wastewater treatment facilities include sewer collection pipes, and an extended air wastewater treatment facility. Separation of the sewer collection system from stormwater collection was done in 1974, allowing for effective treatment of sanitary waste before discharge into the Winooski River even during large rain events. Combined collection systems remain to be a challenge for many of the nation’s older city’s including Burlington. The original wastewater treatment facility was constructed in 1970; several substantial upgrades were completed from 1979 through 1998. Currently the collection and treatment system serves nearly 8,600 residences and businesses, and runs at 45% of its flow and load design capacity. Wastewater treatment facilities are one of many contributors to phosphorus pollution in Lake Champlain, and therefore the 45
You can also read