White matter microstructure and volume correlates of premenstrual dysphoric disorder
←
→
Page content transcription
If your browser does not render page correctly, please read the page content below
Research Paper
White matter microstructure and volume correlates
of premenstrual dysphoric disorder
Xuan Gu, PhD*; Manon Dubol, PhD*; Louise Stiernman, MD; Johan Wikström, PhD;
Andreas Hahn, PhD; Rupert Lanzenberger, MD, PD; C. Neill Epperson, PhD;
Marie Bixo, PhD; Inger Sundström-Poromaa, PhD†; Erika Comasco, PhD†
Background: Premenstrual dysphoric disorder (PMDD) is a mood disorder characterized by psychological and physical symptoms. Dif-
ferences in white matter have been associated with affective and anxiety disorders, which share some symptoms with PMDD. However,
whether white matter structure differs between the brains of individuals with PMDD and healthy controls is not known, nor is its relation
to symptom severity. Methods: We performed tract-based spatial statistics and voxel-based morphometry analyses of diffusion tensor
imaging metrics and white matter volume, using 2 neuroimaging data sets (n = 67 and n = 131) and a combined whole-brain and region-
of-interest approach. We performed correlation analyses to investigate the relationship between regions with different white matter
microstructure and volume and PMDD symptom severity. Results: We found greater fractional anisotropy in the left uncinate fasciculus
(d = 0.69) in individuals with PMDD compared to controls. Moreover, the volume of the right uncinate fasciculus was higher in individuals
with PMDD compared to controls (d = 0.40). As well, the severity of premenstrual depression was positively correlated with fractional
anisotropy in the right superior longitudinal fasciculus (r = 0.35). Limitations: It is challenging to interpret group differences in diffusion
tensor imaging metrics in terms of their underlying biophysical properties. The small size of the control group in the diffusion tensor
imaging study may have prevented effects of interest from being detected. Conclusion: The findings of the present study provide evi-
dence of differential cerebral white matter structure associated with PMDD and its symptoms.
Introduction Diffusion tensor imaging (DTI) enables an assessment of
white matter microstructure in vivo by measuring the diffu-
Premenstrual dysphoric disorder (PMDD) is a mood disor- sion of water molecules in neural fibres.5 It estimates the de-
der that affects about 3%–8% of individuals who menstruate.1 gree of directionality by measuring fractional anisotropy
It is characterized by symptoms of affective lability, irritabil- (FA), and the movement of molecules as defined by mean
ity, depression and anxiety, peaking in the late luteal phase diffusivity (MD), axial diffusivity (AD) and radial diffusivity
of the menstrual cycle.2 (RD). Alterations in anisotropy and diffusivity measures
Since its recognition as a distinct psychiatric disorder in the have been associated with different affective and anxiety dis-
DSM-5,3 the etiology of PMDD has become an increasingly orders6–8 that share symptoms with PMDD. Notably, reduced
active area of research. In the search for the neural correlates FA in the superior longitudinal fasciculus (SLF), uncinate fas-
of PMDD, MRI has been employed to investigate brain struc- ciculus, inferior fronto-occipital fasciculus, forceps minor, an-
ture and function in individuals with PMDD.4 Notably, func- terior thalamic radiation, superior corona radiata, cerebellum
tional imaging studies have suggested an impairment of top– and cingulum appears to characterize these disorders.6 More-
down inhibitory circuits that comprise the corticolimbic brain over, menstrual cycle phase–dependent white matter correla-
networks,4 likely involving altered connections between the tions with gonadal hormone levels have been described in
frontal and subcortical regions. Nevertheless, whether there healthy naturally cycling individuals,9 linking FA measures
are structural alterations in corresponding white matter tracts in the hippocampus to estradiol concentrations over the men-
related to PMDD remains unexplored. strual cycle, for example.10 Thus, trait-like characteristics or
Correspondence to: Erika Comasco, Department of Neuroscience, Science for Life Laboratory, Uppsala University, 751 24 Uppsala,
Sweden; erika.comasco@neuro.uu.se
*These authors contributed equally to this work.
†
These authors contributed equally to this work.
Submitted Aug. 13, 2021; Revised Nov. 18, 2021; Accepted Dec. 20, 2021
Cite as: J Psychiatry Neurosci 2022 February 23;47(1). doi: 10.1503/jpn.210143
© 2022 CMA Impact Inc. or its licensors
J Psychiatry Neurosci 2022;47(1) E67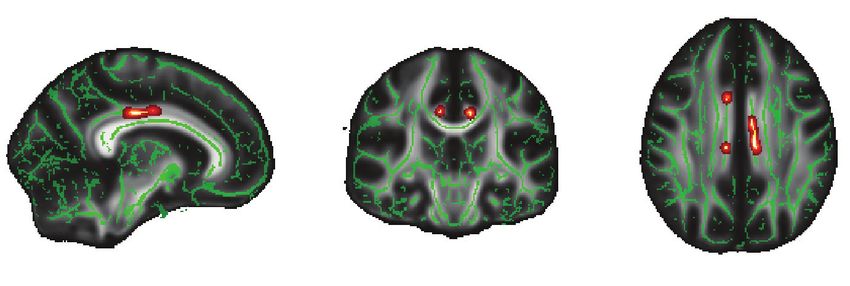
Gu et al.
maladaptive hormone-driven changes in white matter struc- dition, diagnostic symptoms had be at least mild (mean lu-
ture may occur in the brains of individuals with PMDD, teal phase score greater than 3.0, with at least 2 days greater
which could relate to functional imaging findings.9 than 4.0) and disappear during the follicular phase (mean
The present studies were aimed at determining whether follicular phase score less than 2.0).
white matter structure is altered in individuals with PMDD We ruled out psychiatric comorbidities using the Mini-
compared to healthy controls, using DTI data analyzed with International Neuropsychiatric Interview. 13 We also as-
tract-based spatial statistics (study I), and voxel-based mor- sessed and confirmed monitoring of the menstrual cycle phase
phometry (VBM; study II). We compared FA, diffusivity met- using serum progesterone and estradiol concentrations meas
rics (MD, AD and RD) and white matter volumes in individ- ured at the same time as the brain scan. We assessed premen-
uals with PMDD and controls who were scanned during the strual symptom severity during the scan month using the
symptomatic phase of the menstrual cycle, using a combined DRSP scale. We assessed mean total DRSP scores for the late lu-
whole-brain and region-of-interest approach. In accordance teal phase (obtained during the final 5 days of the scan month)
with the neuroimaging literature on PMDD,4 as well as DTI and the 8 items related to the core affective PMDD symptoms
findings related to the menstrual cycle9 and affective and according to the DSM-5 (depression, hopelessness, guilt, being
anxiety disorders,6 we expected white matter structure to be easily hurt, mood swings, anxiety, irritability, conflicts).11
altered in individuals with PMDD compared to controls. Spe- Six participants (5 with PMDD, 1 control) were excluded
cifically, we expected to find differences in the following from the analyses because of technical issues (n = 3), exces-
white matter tracts: anterior thalamic radiation, cerebellum, sive head motion (n = 2) or a brain tumour (n = 1), for a total
cingulum, corticospinal tract, fornix, genu of the corpus callo- sample of 57 individuals with PMDD and 10 controls
sum, inferior fronto-occipital fasciculus, inferior longitudinal (Appendix 1, Figure S1, available at www.jpn.ca/lookup/
fasciculus, superior corona radiata, SLF and uncinate fascicu- doi/10.1503/jpn.210143/tab-related-content).
lus. We also sought to determine whether differential white
matter metrics were associated with symptom severity in MRI acquisition
individuals with PMDD. All participants underwent MRI scanning, including DTI, in
the luteal phase of their menstrual cycle, on a 3.0 T whole-
Methods body scanner (Achieva dStream, Philips Medical Systems)
equipped with a 32-channel head coil. We acquired DTI data
Study I: white matter microstructure using a whole-brain echo planar imaging sequence with the
following parameters: repetition time 3628 ms; echo time
Participants 83 ms; field of view 224 mm × 224 mm; matrix 128 × 128;
The DTI study was carried out at the Departments of Obstet- voxel size 1.75 × 1.75 × 2 mm3; slice thickness 2 mm; flip
rics and Gynecology at Uppsala University Hospital (site 1), a ngle 90°; 48 diffusion-sensitive directions with b =
between December 2016 and December 2019. In total, 62 indi- 800 mm2/s; 1 volume with b = 0 mm2/s; 60 slices without an
viduals with PMDD and 11 healthy, naturally cycling indi- interslice gap; and acquisition time 7 min, 48 s. Across par
viduals with regular menstrual cycles (24–35 days) were re- ticipants, the mean signal-to-noise ratio in white matter was
cruited using advertisements in local newspapers, local 40.3 for b = 0 mm2/s and 22.9 for b = 800 mm2/s.
message boards, social media and student websites. Exclu-
sion criteria were as follows: steroid hormone treatment (in- Data preprocessing
cluding hormonal contraceptives) or treatment with psycho- We performed preprocessing of the DTI data and further
tropic drugs in the previous 3 months, breastfeeding, analyses using the FMRIB Software Library (FSL version
pregnancy, an ongoing psychiatric disorder other than 6.0.4; www.fmrib.ox.ac.uk/fsl/index.html) and the default
PMDD, clinically relevant findings on physical examination recommended parameters. We corrected for head motion
or blood testing, and contraindications for MRI. and eddy current distortions by registering all volumes to the
Study procedures complied with the Declaration of Hel- first volume using the FSL function eddy_correct.14,15 We
sinki and were approved by the ethics committee of Uppsala used the FSL function BET16 (f = 0.4, g = 0) to create the brain
University (Dnr. 2016/184 and 2016/312). We obtained writ- mask from the b0 image. We performed diffusion tensor fit-
ten informed consent from all participants after they had ting and DTI metric (FA, MD, AD) calculations using the FSL
been given oral and written information about the study. function dtifit. We performed RD calculation using the
All participants filled in daily prospective symptom ratings FSL function fslmaths, with RD = (λ2+λ3)/2, where λ2 and λ3
over 2 consecutive menstrual cycles using the Daily Record were the 2 smaller eigenvalues. After a visual quality check,
of Severity of Problems (DRSP) scale.11 We defined a diagno- we excluded 2 participants from subsequent analyses be-
sis of PMDD based on DSM-5 criteria: an increase of more cause of severe head motion.
than 50% in at least 5 of 11 symptoms (among them at least Tract-based spatial statistics allows for the voxel-based
1 core PMDD symptom) between the follicular phase (days 6 analysis of DTI data and reduces the effects of local misalign-
to 12) and the luteal phase (days −7 to −1).12 To meet the cri- ment by projecting all voxels onto the nearest location on a
teria for a diagnosis of PMDD, participants had to have skeleton approximating white matter tract centres.17,18 The
marked symptoms in the luteal phase that caused substan- tbss_1_preproc script in FSL19 slightly eroded FA images and
tial distress or interference with their usual activities. In ad- zeroed the end slices. All FA images were then aligned to the
E68 J Psychiatry Neurosci 2022;47(1)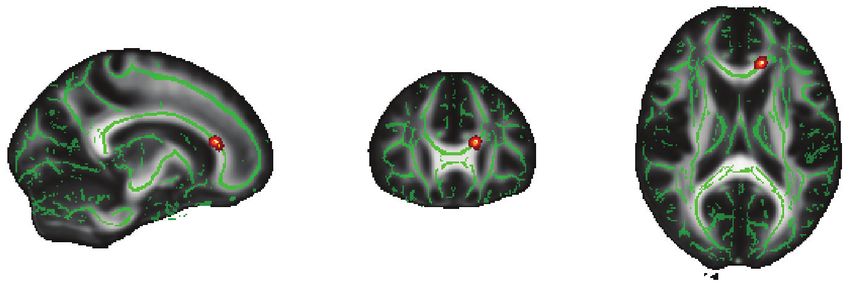
White matter and PMDD
FMRIB58 FA standard space using the tbss_2_reg script.20,21 Study II: white matter volume
With the tbss_3_postreg script applied to the nonlinear trans-
formations previously generated to each brain, we built the Participants
mean FA image and created the mean FA skeleton. Finally, The VBM study was based on 2 neuroimaging data sets col-
with the tbss_4_prestats script, we thresholded the mean FA lected at the Departments of Obstetrics and Gynecology at
skeleton image at the chosen threshold of 0.2 and created the Uppsala University (site 1) and the Umeå Centre for Functional
skeletonized FA data for all brains by projecting the FA data Brain Imaging (site 2) in Sweden. In total, we recruited 94 indi-
onto the mean FA skeleton. viduals with PMDD (62 from site 1 and 32 from site 2) and
We applied the nonlinear registration transformations de- 43 controls (11 from site 1 and 32 from site 2) with regular men-
rived from the processing of FA maps to MD, AD and RD im- strual cycles, as described for study I. Exclusion criteria, confir-
ages by running the script tbss_non_FA. We then projected mation of PMDD diagnosis and monitoring of the menstrual
warped MD, AD and RD data onto the mean FA skeleton. cycle were identical to what has been described for study I.
All procedures were approved by the ethics committees of
Statistical analysis Uppsala University (Dnr. 2016/184 and 2016/312) and Umeå
We performed between-group comparisons of DTI metrics University (2016–111–31M, 2017–266–32M), and we obtained
using the permutation-based, nonparametric “randomize” written informed consent from all participants.
tool in FSL,22 with threshold-free cluster enhancement23 and Six participants (5 PMDD, 1 control) were excluded from
family-wise error (FWE) correction across voxels. We set the the analyses because of technical issues (n = 4), a brain tumour
number of permutations to 5000 and used a threshold of (n = 1) or claustrophobia (n = 1), for a total sample of 89 indi-
p < 0.1 to define significant clusters, given the exploratory viduals with PMDD and 42 controls (Appendix 1, Figure S1).
nature of the study. To account for potentially confounding
factors, we included age as a covariate in the analyses.24 MRI acquisition
We performed group comparisons on the skeletonized FA, All participants underwent T1-weighted MRI scanning dur-
MD, AD and RD images. To define white matter tracts of ing the luteal phase of their menstrual cycle.
interest, we used 9 masks (dorsal and ventral cingulum bun- At site 1, we acquired high-resolution MRI data with a
dle, corticospinal tract, fornix, genu of the corpus callosum, 3.0 T whole-body scanner (Achieva dStream, Philips Medical
superior cerebellar peduncle, superior corona radiata, SLF Systems) equipped with a 32-channel head coil. We acquired
and uncinate fasciculus) from the Johns Hopkins University the data using a magnetization-prepared rapid gradient echo
ICBM-DTI-81 atlas25 and 3 masks (inferior fronto-occipital sequence with the following parameters: repetition time
fasciculus, inferior longitudinal fasciculus and anterior 8.3 ms; echo time 3.8 ms; voxel size 0.94 × 0.94 × 1 mm3;
thalamic radiation) from the Johns Hopkins University white matrix 256 × 256; flip angle 8°; 220 transversal slices; acquisi-
matter tractography atlas.26 tion time 3 min, 50 sec.
Because of previously reported asymmetry in white matter At site 2, we acquired high-resolution MRI data with a
microstructure,27 we tested the regions of interest separately 3.0 T scanner (Discovery MR750, General Electric) equipped
for each hemisphere. To account for multiple testing across with a 32-channel head coil. We acquired the data using a
regions of interest, we applied false discovery rate (FDR) cor- 3-dimensional fast spoiled gradient echo sequence with the
rection on the region-of-interest statistics, using a relaxed following parameters: repetition time 8.2 ms; echo time
threshold of q < 0.1, given the exploratory nature of the 3.2 ms; voxel size 0.48 × 0.48 × 1 mm3; matrix 512 × 512; flip
study. We also ran exploratory analyses at the whole-brain angle 12°; 176 transversal slices; acquisition time 8 min, 11 s.
level on the entire skeletonized FA, MD, AD and RD images.
We calculated Cohen d effect sizes 28 in Matlab R2020b Data preprocessing
(MathWorks) for clusters with significant between-group dif- We carried out MRI preprocessing in SPM12 (Wellcome Trust
ferences in DTI metrics. Effect sizes are given as the mean of Centre for Neuroimaging) implemented in Matlab R2019b
Cohen d values in each of the significant clusters. (MathWorks). First, all images were manually reoriented
To investigate whether FA was related to PMDD symptom using the anterior commissure as origin (0, 0, 0). Then, using
severity in clusters (k = 6) that differed between individuals the segment routine in SPM12, the reoriented images were
with PMDD and controls, we performed partial correlation spatially normalized into Montreal Neurological Institute
analyses, adjusting for age.24 We used the Anderson–Darling (MNI) space and corrected for intensity variations before be-
test to assess normal distribution. We used Pearson and ing segmented into grey matter, white matter, cerebrospinal
Spearman correlations for normally and non-normally dis- fluid, bone, soft tissue and background based on voxel inten-
tributed scores, respectively. Because 3 participants did not sities from MNI tissue probability maps.29 After segmentation,
provide complete symptom ratings, 54 individuals with the pipeline applied a modulation process on the white matter
PMDD were included in these analyses. We used Bonferroni probability maps to compensate for the effects of spatial nor-
correction for multiple comparisons of the 8 DRSP scores malization on volumetric data (the original voxels were pro-
(p < 0.006, Bonferroni corrected). We conducted correlation jected into their new location in the warped images). Finally,
analyses, as well as group comparison of demographic and modulated white matter probability maps were smoothed
clinical characteristics, using the SPSS version 27 (SPSS Inc., using an 8 mm full-width at half maximum Gaussian kernel,
IBM SPSS Statistics) and Matlab R2020b. resulting in a voxel size of 1.5 × 1.5 × 1.5 mm3.
J Psychiatry Neurosci 2022;47(1) E69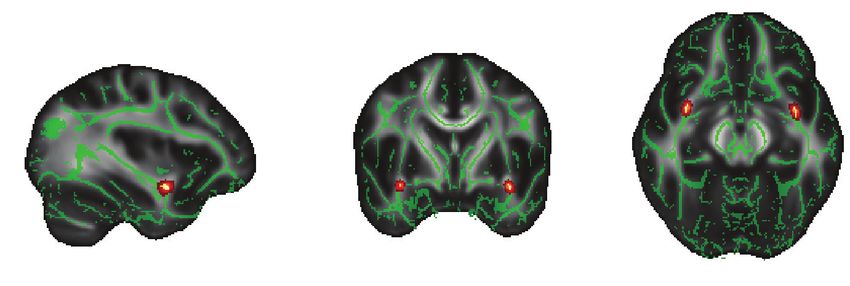
Gu et al.
We followed a quality assessment procedure, including correlation analyses between DRSP scores and white matter
isual inspection and automated quality control, using the
v volume in individuals with PMDD from site 1, for whom
CAT12 toolbox in SPM12 (http://dbm.neuro.uni-jena.de/ DRSP ratings in the scanning month were available (n = 55).
vbm/check-sample-homogeneity) to detect artifacts and ana- We used the total DRSP score and the 8 items related to the
tomic outliers. Based on brain segmentation, the mean core affective PMDD symptoms tested in study I, and we
(± standard deviation) total white matter volume was 0.41 ± considered total intracranial volume and age as confound-
0.04 L. The mean (± standard deviation) total intracranial vol- ing covariates. We carried out these analyses in SPSS ver-
ume was 1.51 ± 0.11 L. sion 26 (SPSS Inc.), and set the significance threshold at p <
0.05, corrected for multiple testing (8 DRSP scores: p < 0.006,
Statistical analysis Bonferroni corrected).
We carried out between-group comparisons of white matter
volume using the nonparametric, permutation-based, Results
threshold-free cluster enhancement method in SPM12, using
5000 permutations and a significance threshold of pFWE < 0.1 Descriptive characteristics
across voxels. We included total intracranial volume, age and
site as confounding covariates, because of their potential The demographic and psychometric characteristics of partici-
influence on volumetric measures. pants from both studies are presented in Table 1.
We conducted VBM voxel-wise group comparisons of Across both studies, individuals with PMDD were
white matter probability maps within the predefined bilat- slightly older than controls. In the DTI study, individuals
eral regions of interest used in study I. To account for mul- with PMDD had higher progesterone levels than controls;
tiple testing across regions of interest, we applied FDR cor- in the VBM study, individuals with PMDD reported a
rection, using a relaxed threshold of q < 0.1, given the psychiatric history more often than controls. Individuals
exploratory nature of the study. As well, VBM exploratory with PMDD and controls did not differ in terms of body
analysis consisted of a voxel-wise group comparison con- mass index, total intracranial volume, menstrual cycle
ducted within a mask of white matter defined by an abso- length or estradiol levels.
lute threshold set at 0.1. We generated Cohen d effect-size
maps in SPM12 using the “transform and threshold SPM Between-group differences in white matter microstructure
maps” module from the CAT12 toolbox. Effect sizes are
given as the mean of Cohen d values within a significant Within a priori–defined regions of interest, with effect sizes
cluster. indicating strong differences, we found higher FA in individ-
To investigate whether differences in white matter vol- uals with PMDD versus controls in the left dorsal cingulum
ume between individuals with PMDD and controls were re- bundle (d = 0.71), the right dorsal cingulum bundle (d = 0.83),
lated to PMDD symptom severity during the cycle in which the left genu of the corpus callosum (d = 0.87), the right SLF
they were scanned, we performed nonparametric partial (d = 0.75), the left uncinate fasciculus (d = 0.69) and the right
Table 1: Participant characteristics
Diffusion tensor imaging (study I)* Voxel-based morphometry (study II)*
Characteristic Controls (n = 10) PMDD (n = 57) Controls (n = 42) PMDD (n = 89)
Age, yr 30.30 ± 6.70 35.14 ± 6.31§ 28.00 ± 6.00 33.00 ± 7.00§
Body mass index, kg/m2 22.94 ± 3.11 24.45 ± 4.34 23.80 ± 3.80 24.10 ± 4.00
Total intracranial volume, L 1.47 ± 0.10 1.47 ± 0.10 1.52 ± 0.11 1.50 ± 0.10
Menstrual cycle length, d 27 ± 2 28 ± 2 28 ± 2 28 ± 2
Psychiatric history† 4 (40.0) 24 (42.1) 7 (16.6) 34 (39.1)¶
Depressive disorder 3 (75.0) 18 (75) 6 (85.7) 27 (79.4)
Anxiety disorder 1 (25.0) 6 (25) 1 (14.3) 6 (17.6)
Eating disorder 0 (0) 3 (12.5) 0 (0) 4 (11.8)
Estradiol, pmol/L‡ 286.39 ± 210.13 414.00 ± 251.37 434.50 ± 47.40 411.10 ± 239.80
Progesterone, nmol/L‡ 9.26 ± 15.06 21.25 ± 16.06§ 18.70 ± 15.00 21.90 ± 15.30
DRSP, total score§ NA 61.67 ± 18.39 NA 61.80 ± 18.20
DRSP = Daily Record of Severity of Problems; NA = not applicable; PMDD = premenstrual dysphoric disorder.
*Values are mean ± standard deviation or n (%). Differences between groups were assessed using the Mann–Whitney test for continuous variables and the Fisher exact test for
categorical variables.
†The percentage of participants who reported a psychiatric history is based on the full sample; participants could report more than 1 disorder. Percentages for depressive, anxiety and
eating disorders is based on the number of participants who reported a psychiatric history. In study II, 2 participants in the PMDD group did not provide information about previous
psychiatric disorders.
‡Hormone data were available for a subset of 9 controls and 55 individuals with PMDD in the diffusion tensor imaging study, and 39 controls and 85 individuals with PMDD in the voxel-
based morphometry study.
§DRSP scores were available for a subset of 54 individuals with PMDD in the diffusion tensor imaging study, and 55 in the voxel-based morphometry study.
¶Significant group difference at p < 0.05.
E70 J Psychiatry Neurosci 2022;47(1)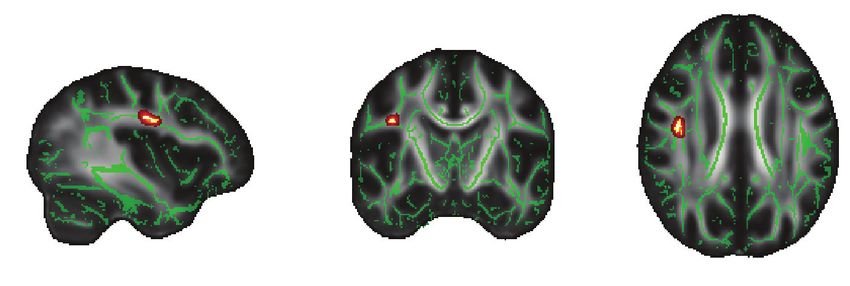
White matter and PMDD
uncinate fasciculus (d = 0.67; Figure 1A and B and Table 2). Between-group differences in white matter volume
Of these, the cluster in the left uncinate fasciculus survived
FDR correction. At the whole-brain level, we noted no addi- After FDR correction across the tested regions of interest, we
tional significant differences in FA between groups. found that individuals with PMDD had greater white matter
For diffusivity metrics, we found no significant difference volume in the right uncinate fasciculus compared to controls
in RD between groups. As illustrated in Appendix 1, (Figure 2 and Table 2). Effect sizes in the significant cluster
Figures S2 and S3, MD and AD were higher in individuals indicated moderate differences (d = 0.40). At the whole-brain
with PMDD than controls in different regions of interest level, and in the other regions of interest, we found no differ-
(Appendix 1, Table S1). ences in white matter volume between groups.
A B
Dorsal cingulum bundle
0.75
Control
Mean fractional anisotropy
PMDD
0.70
0.65
*
Genu of the corpus callosum 0.60
0.55
0.50
0.45
Left dCB Right dCB GCC Right SLF Left UF Right UF
Superior longitudinal fasciculus
C
Right SLF Right SLF
0.70 0.70
Fractional anisotropy
Fractional anisotropy
Uncinate fasciculus 0.65 0.65
0.60 0.60
0.55 0.55
2 4 6 2 4 6
Depression Anxiety
PMDD > control, pFWE < 0.1
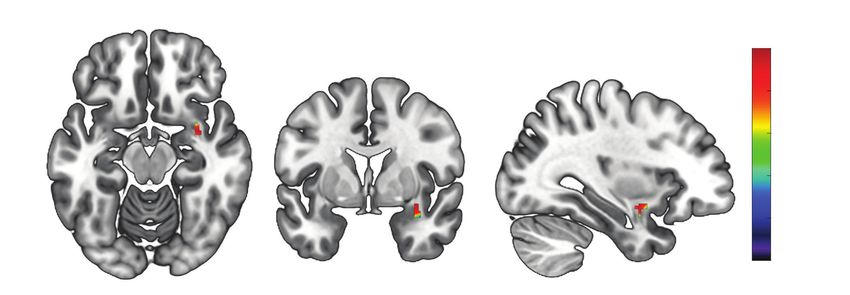
Figure 1: Fractional anisotropy results in regions of interest. (A) Results from tract-based spatial statistics showing between-group differences
in fractional anisotropy. Depicted in red–yellow are the 6 clusters in which we found greater fractional anisotropy in individuals with premen-
strual dysphoric disorder compared to controls. The clusters are overlaid onto the mean fractional anisotropy skeleton (green) and displayed
in 3-dimensional view at their peak Montreal Neurological Institute coordinates, in the standard radiology orientation (left–right flip). For visual-
ization, results were thickened using the tbss_fill command in FSL. Results are visualized at a threshold of pFWE < 0.1, corrected for multiple
comparisons across voxels with threshold-free cluster enhancement. (B) Between-group differences in fractional anisotropy in significant or
trend clusters at p < 0.1 (left dorsal cingulum bundle p = 0.031; right dorsal cingulum bundle p = 0.070; genu of the corpus callosum p =
0.095; right superior longitudinal fasciculus p = 0.031; left uncinate fasciculus p = 0.024; right uncinate fasciculus p = 0.081). Error bars show
1 standard deviation across participants. *False discovery rate corrected across regions of interest at q < 0.1. (C) Correlation between scores
on the Daily Record of Severity of Problems scale and fractional anisotropy values in clusters with a significant group difference at p < 0.1.
We found positive associations between fractional anisotropy values from the right superior longitudinal fasciculus and Daily Record of Sever-
ity of Problems scores for depression (r = 0.350, p = 0.010) and for anxiety at a trend level (r = 0.262, p = 0.058). dCB = dorsal cingulum
bundle; FWE = family-wise error; GCC = genu of the corpus callosum; PMDD = premenstrual dysphoric disorder; SLF = superior longitudinal
fasciculus; UF = uncinate fasciculus.
J Psychiatry Neurosci 2022;47(1) E71Gu et al.
Table 2: Between-group differences in fractional anisotropy and white matter volume in regions of interest*
Mean value ± SD MNI coordinates
Cluster size, of peak voxel,
Tract of interest voxels PMDD Controls TFCE p value Cohen d x, y, z
Fractional anisotropy, PMDD > controls
Left dorsal cingulum bundle 57 0.65 ± 0.06 0.61 ± 0.06 0.031 0.71 −9, −21, 33
Right dorsal cingulum bundle 26 0.59 ± 0.03 0.54 ± 0.03 0.070 0.83 9, 9, 31
Genu of the corpus callosum 15 0.69 ± 0.04 0.64 ± 0.04 0.095 0.87 −14, 30, 16
Right superior longitudinal fasciculus 115 0.60 ± 0.03 0.57 ± 0.03 0.031 0.75 39, −10, 29
Left uncinate fasciculus 30 0.58 ± 0.05 0.53 ± 0.04 0.024† 0.69 −35, −1, −13
Right uncinate fasciculus 12 0.62 ± 0.05 0.58 ± 0.05 0.081 0.67 34, 2, −12
White matter volume, PMDD > controls
Right uncinate fasciculus 110 0.24 ± 0.05 0.22 ± 0.05 0.010† 0.40 36, 0, −14
MNI = Montreal Neurological Institute; PMDD = premenstrual dysphoric disorder; SD = standard deviation; TFCE = threshold-free cluster enhancement.
*Threshold-free cluster enhancement voxel-wise comparisons of fractional anisotropy and white matter volume between individuals with PMDD and healthy controls in tracts of interest.
Mean raw values of fractional anisotropy and white matter volume were extracted from significant clusters and are presented for each group. Results are corrected for multiple
comparisons using the family-wise error rate at p < 0.1 across voxels.
†q < 0.1, corrected for false discovery rate across regions of interest.
p value
0.010
0.016
0.025
0.040
0.063
0.100
Figure 2: Between-group differences in white matter volume in the uncinate fasciculus. Threshold-free cluster enhancement voxel-wise com-
parisons showing higher white matter volume in individuals with premenstrual dysphoric disorder compared to healthy controls. The significant
cluster (peak at x, y, z = 36, 0, −14; k = 110 voxels; pFWE = 0.010; threshold-free cluster enhancement) has been overlaid onto a Montreal
Neurological Institute standard template. The colour bar indicates p values after FWE correction across voxels. FWE = family-wise error.
Correlations between symptom severity and white matter Discussion
metrics
The present studies sought to investigate whether white
In individuals with PMDD, FA values were not correlated matter structure is altered in individuals with PMDD com-
with total DRSP scores or individual core affective symptoms pared to healthy controls, using DTI and VBM analyses.
after correction for multiple testing. However, at the uncor- We compared DTI metrics and white matter volumes in
rected level, we found trend-level positive associations be- individuals with PMDD and healthy controls scanned dur-
tween FA values in the right SLF and individual DRSP items ing the symptomatic phase of the menstrual cycle, in
such as depression (r = 0.35, p = 0.010) and anxiety (r = 0.26, 2 neuroimaging studies. An additional purpose of these
p = 0.058; Figure 1C). White matter volume in the differential studies was to determine whether differential white matter
cluster of the right uncinate fasciculus did not correlate with metrics were associated with symptom severity in individ-
symptom severity. uals with PMDD.
E72 J Psychiatry Neurosci 2022;47(1)White matter and PMDD
Our findings defined, for the first time, the brain structural Individuals with PMDD also had higher FA in the mid
correlates of PMDD using tract-based spatial statistics and DTI cingulate subdivision of the dorsal cingulum bundle com-
metrics of white matter microstructure, as well as VBM metrics pared to controls. The cingulum is the most important white
of white matter volume. We observed greater FA in individ matter structure in the limbic system, linking the cingulate
uals with PMDD compared to controls in the bilateral dorsal gyrus to subcortical regions, as well as to frontal, parietal and
cingulum bundle, the bilateral uncinate fasciculus, the left medial temporal areas.37 It plays an important role in emotion
genu of the corpus callosum and the right SLF. Interestingly, regulation, attention, motivation and working memory. This
AD differed between individuals with PMDD and controls in finding is of relevance to PMDD, especially considering previ-
the same direction and in regions that overlapped with the FA ous functional MRI studies on emotion processing.35,38 Specif
findings, indicating that differences in FA in these regions were ically, lower brain activation during emotion processing was
likely driven by differences in AD. We detected greater white found in the anterior cingulate cortex in individuals with
matter volume in individuals with PMDD than controls in the PMDD, independent of menstrual cycle phase38 or solely in the
right uncinate fasciculus. We also reported trend-level positive luteal phase.35 Because altered function of the corticolimbic
associations between FA values in the right SLF and symptom system is one of the core findings of neuroimaging studies on
severity in individuals with PMDD, reflecting the relationship PMDD,4 a greater microstructural coherence of the white mat-
between white matter structure and premenstrual mood. ter tract interconnecting the cingulate gyrus with the frontal
Taken together, these results are of relevance to PMDD, be- and subcortical regions may represent compensatory mechan
cause these tracts bridge cortical and subcortical areas, particu- isms resulting from poor top–down communication between
larly corticolimbic connections, and thus could align with the cognitive and emotional circuits. This could also relate to dif-
hypothesis of altered top–down control in PMDD.30 ferential resting-state activity in the default mode network,
Functional neuroimaging studies suggest an impaired top– which remains understudied in PMDD39 and whose key nodes
down process in the affective networks in PMDD.4 This could largely overlap with the termination regions of the cingulum.40
relate to reduced white matter integrity in tracts that connect The right SLF was also characterized by higher FA meas
cortical control areas and subcortical regions of the limbic ures in component II terminating in the dorsolateral prefron-
system in PMDD. Such a relationship would be in line with tal cortex41 in individuals with PMDD. This finding was in
DTI studies in psychiatric disorders, pointing to lower FA in line with those of a study that provided evidence for in-
patients with schizophrenia, mood disorders and autism.31–33 creased FA in bipolar disorder in the right SLF.42 However, it
Conversely, our findings of higher white matter integrity in contrasted with the results of a meta-analysis that showed
the brains of individuals with PMDD suggest that compensa- that the majority of studies of FA in emotional disorders re-
tory neuroadaptive mechanisms might counteract the dys- ported reduced FA in the left SLF. The SLF connects the pre-
regulation of corticolimbic regions. Indeed, the etiology of frontal cortex in each cerebral hemisphere with the parietal
this hormone-dependent disorder is likely to diverge from lobe.43 Interestingly, several reports of variations in the func-
the etiology of other psychiatric disorders, in light of the tion of the prefrontal cortex and parietal regions have been
cyclical aspect of PMDD symptomatology. Moreover, al- made in PMDD, although the direction of effect seems to de-
though the present DTI findings were limited by the small pend on the specific paradigms used in each functional MRI
size of the control group, the VBM results obtained from a study.4 In addition, evidence from resting-state functional
larger group of individuals with PMDD and controls fol- MRI points to stronger connectivity involving the executive
lowed the same direction, as did the correlations with symp- control network, which links the dorsolateral prefrontal cortex
tom severity, supporting the validity of these findings. and parietal cortex,44 in individuals with PMDD.45 Hence, the
We detected higher FA and white matter volume in indi- greater FA found in the right SLF in individuals with PMDD
viduals with PMDD in the uncinate fasciculus (significant in the present study may relate to stronger functional connec-
after correction for multiple testing), a white matter tract that tivity, and to differential brain reactivity previously reported
connects the prefrontal cortex and the anteromedial temporal in brain networks involving frontal and parietal regions in
lobe,34 including connections between regions of the limbic individuals with PMDD. In line with such findings, we found
system, such as the amygdala and the orbitofrontal cortex. a positive correlation at a trend level between FA values in the
The amygdala is one of the key regions hypothesized to play right SLF and the severity of anxiety and depression, 2 key
a role in the pathophysiology of PMDD, in the context of an symptoms experienced by individuals with PMDD.
altered top–down inhibitory process.4 For instance, compared Furthermore, the genu of the corpus callosum was among
to controls, individuals with PMDD show enhanced reactiv- the areas highlighted by the DTI findings. The corpus callo-
ity to social stimuli in the amygdala during the symptomatic sum connects the left and right cerebral hemispheres and is
luteal phase.35 As well, greater reactivity to negative emo- involved in interhemispheric communication.46 The genu
tional stimuli in the amygdala and the orbitofrontal cortex consists of a high density of thin fibres that cross over to form
has been reported in individuals with PMDD in the late the forceps minor, which connects the homologous medial
luteal phase.36 Therefore, the differential FA and white matter and lateral prefrontal associative areas.47 Although there is no
volume we found in the uncinate fasciculus in individuals consensus on the specific functions of this callosal subregion,
with PMDD compared with controls may relate to the func- it is thought to be relevant to emotion regulation. Neuro
tional variations reported in the amygdala and orbitofrontal imaging studies support this hypothesis, showing a positive
cortex in individuals with PMDD.4 association between emotion regulation abilities and FA in
J Psychiatry Neurosci 2022;47(1) E73Gu et al.
the forceps minor in healthy participants.48 In addition, across Conclusion
emotional disorders, reduced FA in the forceps minor and
genu of the corpus callosum characterizes patients compared The present findings provide the first evidence of differen-
to controls,6 although it seems to be of particular relevance to tial cerebral white matter structure associated with PMDD.
bipolar disorder.6,49,50 In individuals with PMDD, differential These findings suggest that structural modifications in
reactivity of the medial and dorsolateral prefrontal areas to white matter tracts that ensure communication between cor-
emotional tasks has been reported,4 a finding that could tical and subcortical limbic and paralimbic regions may be
relate to the higher FA in the genu of the corpus callosum we involved in the pathophysiological mechanisms of PMDD.
found in individuals with PMDD compared to controls. This primary evidence of white matter variations in PMDD
calls for independent replication and further investigation
Limitations into the structure of the specific networks involved in the
symptomatology of this mood disorder.
Although DTI metrics provide us with unique insights into Acknowledgements: Computation of the permutation tests in
white matter microstructure, variations in FA and diffusiv- TBSS was enabled by resources in project sens2021510 provided by
ity metrics should be interpreted with caution. Commonly the Swedish National Infrastructure for Computing at UPPMAX,
interpreted as a marker of white matter integrity, FA is partially funded by the Swedish Research Council through grant
under the influence of multiple microstructural features that agreement no. 2018-05973. The authors would also like to thank
the research nurses at the Uppsala University Hospital MR centre
cannot be disentangled at the voxel level (e.g., degree of and Department of Women’s and Children’s Health of Uppsala
myelination, internal axonal structure, axon packing, water University for their participation in data collection.
content and orientation of large macromolecules and mem- Affiliations: From the Department of Neuroscience, Science for Life
branes in the tissues).51 Moreover, although the degree of Laboratory, Uppsala University, Sweden (Gu, Dubol, Comasco); the De-
myelination correlates with FA, it is not possible to disen- partment of Clinical Sciences, Umeå University, Umeå, Sweden
tangle the effects of axon count and myelin while interpret- (Stiernman, Bixo); the Department of Surgical Sciences, Neuroradiology,
ing FA changes, because they are strongly interrelated.52 As Uppsala University, Sweden (Wikström); the Department of Psychiatry
and Psychotherapy, Medical University of Vienna, Austria (Hahn,
for the diffusivity metrics AD and RD, which contribute to Lanzenberger); the Department of Psychiatry, University of Colorado
define FA, interpretation in terms of underlying biophysical School of Medicine, USA (Epperson); the Department of Women’s and
properties is also challenging.52 Animal experiments have Children’s Health, Uppsala University, Sweden (Sundström-Poromaa).
suggested that astrocytes, myelin and oligodendrocytes Funding: This study was supported by the EU FP7-People-Cofund
make the greatest contribution to any white matter voxel (INCA 600398), the Swedish Research Council (2015-00495; 2016-
measurements in human MRIs.53 With respect to white mat- 01439; 2020-01801), the Swedish Society of Medicine (SLS-573171, SLS-
ter volume measures derived from T1-weighted images, 597211, SLS-789101) and the Swedish Brain Foundation (2020-0255).
a postmortem quantitative MRI study showed that they are Competing interests: R. Lanzenberger received support from
presumably dependent on myelin content.54 Therefore, the Siemens Healthcare for clinical research using PET/MR, conference
speaker honoraria and travel grants within the last 3 years from
greater FA and white matter volume found in individuals
Bruker BioSpin MR and Heel, and he has been a shareholder of the
with PMDD in the present study was most likely to reflect start-up company BM Health GmbH since 2019. C.N. Epperson has
more numerous, myelinated and coherently oriented white received research grant support from Sage Therapeutics; he has
matter fibres. served on an advisory board for Sage Therapeutics and has received
Combining DTI and VBM analyses of white matter is likely honoraria and travel funding from Sage Therapeutics. I. Sundström-
Poromaa was supported by a grant from the Swedish Research Council
to provide complementary information about white matter (2020-01801) and the Brain Foundation (F2020-0255), has served occa-
structure. The direction of effect in the uncinate fasciculus sionally on advisory boards for Gedeon Richter and received honor
was consistent across imaging modalities in the present aria as an invited speaker for Bayer Health Care, Gedeon Richter,
study. This contributed to overcoming the limitation of small Peptonics, Shire/Takeda, and Sandoz. E. Comasco receives funds
from SciLifeLab. No other competing interests declared.
sample size in study I, which was underpowered to detect
moderate effect sizes.55 Contributors: I. Sundström-Poromaa and E. Comasco designed the
One possible consequence of the small sample was the study. J. Wikström and M. Bixo acquired the data, which X. Gu,
M. Dubol, L. Stiernman, A. Hahn, R. Lanzenberger and N.
lower progesterone concentrations found in the control Epperson analyzed. X. Gu, M. Dubol and E. Comasco wrote the
group compared to the PMDD group in the DTI study article, which L. Stiernman, J. Wikström, A. Hahn, R. Lanzenberger,
(study I). Indeed, the reduced variability in menstrual cycle N. Epperson, M. Bixo and I. Sundström-Poromaa reviewed. All
day at scanning and therefore in progesterone concentrations authors approved the final version to be published and can certify
imparted by the small control group in study I could explain that no other individuals not listed as authors have made substan-
tial contributions to the paper.
this difference.
The exploratory nature of this study should be noted when Data availability: Data are available upon request.
considering the number of tracts of interest investigated, be- Content licence: This is an Open Access article distributed in accor-
cause only the left uncinate fasciculus remained significant dance with the terms of the Creative Commons Attribution (CC BY-
after FDR correction of the DTI findings. Finally, the use of NC-ND 4.0) licence, which permits use, distribution and reproduc-
tion in any medium, provided that the original publication is
tract-based spatial statistics and threshold-free cluster en- properly cited, the use is noncommercial (i.e., research or educa-
hancement provided improved sensitivity compared to tradi- tional use), and no modifications or adaptations are made. See:
tional voxel-level approaches.18,23 https://creativecommons.org/licenses/by-nc-nd/4.0/
E74 J Psychiatry Neurosci 2022;47(1)White matter and PMDD
References 24. Sexton CE, Walhovd KB, Storsve AB, et al. Accelerated changes in
white matter microstructure during aging: a longitudinal diffusion
1. Halbreich U, Borenstein J, Pearlstein T, et al. The prevalence, im- tensor imaging study. J Neurosci 2014;34:15425-36.
pairment, impact, and burden of premenstrual dysphoric disorder 25. Mori S, Oishi K, Jiang H, et al. Stereotaxic white matter atlas based
(PMS/PMDD). Psychoneuroendocrinology 2003;28:1-23. on diffusion tensor imaging in an ICBM template. Neuroimage
2. American Psychiatric Association. Diagnostic and statistical manual 2008;40:570-82.
of mental disorders. Fifth edition. Arlington (VA): American Psychiat- 26. Hua K, Zhang J, Wakana S, et al. Tract probability maps in stereo-
ric Association Publishing; 2013. taxic spaces: analyses of white matter anatomy and tract-specific
3. Epperson CN, Steiner M, Hartlage SA, et al. Premenstrual dys- quantification. Neuroimage 2008;39:336-47.
phoric disorder: evidence for a new category for DSM-5. Am J 27. Honnedevasthana Arun A, Connelly A, Smith RE, et al. Character
Psychiatry 2012;169:465-75. isation of white matter asymmetries in the healthy human brain using
4. Dubol M, Epperson CN, Lanzenberger R, et al. Neuroimaging pre- diffusion MRI fixel-based analysis. Neuroimage 2021;225:117505.
menstrual dysphoric disorder: a systematic and critical review. 28. Cohen J. Statistical power analysis for the behavioral sciences. Cam-
Front Neuroendocrinol 2020;57:100838. bridge (MA): Academic Press; 2013.
5. Le Bihan D. Looking into the functional architecture of the brain 29. Ashburner J, Friston KJ. Voxel-based morphometry — the meth-
with diffusion MRI. Nat Rev Neurosci 2003;4:469-80. ods. Neuroimage 2000;11:805-21.
6. Jenkins LM, Barba A, Campbell M, et al. Shared white matter alter- 30. Comasco E, Sundström-Poromaa I. Neuroimaging the menstrual
ations across emotional disorders: a voxel-based meta-analysis of cycle and premenstrual dysphoric disorder. Curr Psychiatry Rep
fractional anisotropy. Neuroimage Clin 2016;12:1022-34. 2015;17:77.
7. Dillon DG, Gonenc A, Belleau E, et al. Depression is associated
31. Koshiyama D, Fukunaga M, Okada N, et al. White matter micro-
with dimensional and categorical effects on white matter path-
structural alterations across four major psychiatric disorders: mega-
ways. Depress Anxiety 2018;35:440-7.
analysis study in 2937 individuals. Mol Psychiatry 2020;25:883-95.
8. Olson EA, Cui J, Fukunaga R, et al. Disruption of white matter
32. Podwalski P, Szczygiel K, Tyburski E, et al. Magnetic resonance
structural integrity and connectivity in posttraumatic stress disor-
diffusion tensor imaging in psychiatry: a narrative review of its
der: a TBSS and tractography study. Depress Anxiety 2017;34:437-45.
potential role in diagnosis. Pharmacol Rep 2021;73:43-56.
9. Dubol M, Epperson CN, Sacher J, et al. Neuroimaging the men-
33. White T, Nelson M, Lim KO. Diffusion tensor imaging in psychiat-
strual cycle: a multimodal systematic review. Front Neuroendocrinol
ric disorders. Top Magn Reson Imaging 2008;19:97-109.
2021;60:100878.
34. Bhatia K, Henderson L, Yim M, et al. Diffusion tensor imaging in-
10. Barth C, Steele CJ, Mueller K, et al. In-vivo dynamics of the human
vestigation of uncinate fasciculus anatomy in healthy controls: de-
hippocampus across the menstrual cycle. Sci Rep 2016;6:32833.
scription of a subgenual stem. Neuropsychobiology 2017;75:132-40.
11. Endicott J, Nee J, Harrison W. Daily record of severity of problems
(DRSP): reliability and validity. Arch Womens Ment Health 2006;9:41-9. 35. Gingnell M, Ahlstedt V, Bannbers E, et al. Social stimulation and
corticolimbic reactivity in premenstrual dysphoric disorder: a pre-
12. Eisenlohr-Moul TA, Girdler SS, Schmalenberger KM, et al. Toward liminary study. Biol Mood Anxiety Disord 2014;4:3.
the reliable diagnosis of DSM-5 premenstrual dysphoric disorder:
the Carolina Premenstrual Assessment Scoring System (C-PASS). 36. Protopopescu X, Tuescher O, Pan H, et al. Toward a functional
Am J Psychiatry 2017;174:51-9. neuroanatomy of premenstrual dysphoric disorder. J Affect Disord
2008;108:87-94.
13. Sheehan DV, Lecrubier Y, Sheehan KH, et al. The Mini-
International Neuropsychiatric Interview (MINI): the development 37. Bubb EJ. The cingulum bundle: anatomy, function, and dysfunc-
and validation of a structured diagnostic psychiatric interview for tion. Neurosci Biobehav Rev 2018;92:104-127.
DSM-IV and ICD-10. J Clin Psychiatry 1998;59:22-33. 38. Comasco E, Hahn A, Ganger S, et al. Emotional fronto‐cingulate cor-
14. Jenkinson M, Smith S. A global optimisation method for robust tex activation and brain derived neurotrophic factor polymorphism
affine registration of brain images. Med Image Anal 2001;5:143-56. in premenstrual dysphoric disorder. Hum Brain Mapp 2014;35:4450-8.
15. Jenkinson M, Bannister P, Brady M, et al. Improved optimization 39. Syan SK, Minuzzi L, Smith M, et al. Brain structure and function in
for the robust and accurate linear registration and motion correc- women with comorbid bipolar and premenstrual dysphoric disor-
tion of brain images. Neuroimage 2002;17:825-41. der. Front Psychiatry 2018;8:301.
16. Smith SM. Fast robust automated brain extraction. Hum Brain 40. van den Heuvel M, Mandl R, Luigjes J, et al. Microstructural orga-
Mapp 2002;17:143-55. nization of the cingulum tract and the level of default mode func-
tional connectivity. J Neurosci 2008;28:10844-51.
17. Bach M, Laun FB, Leemans A, et al. Methodological considerations
on tract-based spatial statistics (TBSS). Neuroimage 2014;100:358-69. 41. Makris N, Kennedy DN, McInerney S, et al. Segmentation of sub-
components within the superior longitudinal fascicle in humans: a
18. Smith SM, Jenkinson M, Johansen-Berg H, et al. Tract-based spatial quantitative, in vivo, DT-MRI study. Cereb Cortex 2005;15:854-69.
statistics: voxelwise analysis of multi-subject diffusion data.
Neuroimage 2006;31:1487-505. 42. Versace A, Almeida JRC, Hassel S, et al. Elevated left and reduced
right orbitomedial prefrontal fractional anisotropy in adults with
19. Jenkinson M, Beckmann CF, Behrens TE, et al. FSL. Neuroimage bipolar disorder revealed by tract-based spatial statistics. Arch Gen
2012;62:782-90. Psychiatry 2008;65:1041.
20. Andersson J, Jenkinson M, Smith S. Non-linear optimisation. Oxford: 43. Schmahmann JD, Smith EE, Eichler FS, et al. Cerebral white mat-
FMRIB, University of Oxford; 2007. Report no TR07JA1. ter: neuroanatomy, clinical neurology, and neurobehavioral cor
21. Andersson J, Jenkinson M, Smith S. Non-linear registration. Oxford: relates. Ann N Y Acad Sci 2008;1142:266.
FMRIB, University of Oxford; 2007. Report no TR07JA2. 44. Seeley WW, Menon V, Schatzberg AF, et al. Dissociable intrinsic
22. Winkler AM, Ridgway GR, Webster MA, et al. Permutation infer- connectivity networks for salience processing and executive con-
ence for the general linear model. Neuroimage 2014;92:381-97. trol. J Neurosci 2007;27:2349-56.
23. Smith SM, Nichols T. Threshold-free cluster enhancement: ad- 45. Petersen N, Ghahremani DG, Rapkin AJ, et al. Resting-state func-
dressing problems of smoothing, threshold dependence and local tional connectivity in women with PMDD. Transl Psychiatry
isation in cluster inference. Neuroimage 2009;44:83-98. 2019;9:339.
J Psychiatry Neurosci 2022;47(1) E75Gu et al.
46. Gazzaniga MS. Cerebral specialization and interhemispheric com-
munication: does the corpus callosum enable the human condi-
tion? Brain 2000;123:1293-326.
47. Raybaud C. The corpus callosum, the other great forebrain com-
missures, and the septum pellucidum: anatomy, development, and
malformation. Neuroradiology 2010;52:447-77.
48. Pisner DA, Smith R, Alkozei A, et al. Highways of the emotional
intellect: white matter microstructural correlates of an ability-based
measure of emotional intelligence. Soc Neurosci 2017;12:253-67.
49. Cyprien F, de Champfleur NM, Deverdun J, et al. Corpus callosum
integrity is affected by mood disorders and also by the suicide
attempt history: a diffusion tensor imaging study. J Affect Disord
2016;206:115-24.
50. Zhang R, Jiang X, Chang M, et al. White matter abnormalities of
corpus callosum in patients with bipolar disorder and suicidal ide-
ation. Ann Gen Psychiatry 2019;18:20.
51. Beaulieu C. The basis of anisotropic water diffusion in the nervous
system—a technical review. NMR Biomed 2002;15:435-55.
52. Curran KM, Emsell L, Leemans A. Quantitative DTI measures. In:
Diffusion tensor imaging. Berlin: Springer; 2016: 65-87.
53. Walhovd KB, Johansen-Berg H, Karadottir RT. Unraveling the se-
crets of white matter — bridging the gap between cellular, animal
and human imaging studies. Neuroscience 2014;276:2-13.
54. Stüber C, Morawski M, Schäfer A, et al. Myelin and iron concen-
tration in the human brain: a quantitative study of MRI contrast.
Neuroimage 2014;93:95-106.
55. Faul F, Erdfelder E, Buchner A, et al. Statistical power analyses using
G*Power 3.1: tests for correlation and regression analyses. Behav Res
Methods 2009;41:1149-60.
E76 J Psychiatry Neurosci 2022;47(1)You can also read