Where do we stand, where do we go? - CRYPTOASSET ADOPTION & VOLATILITY View From The Citadel Deep Dive Series
←
→
Page content transcription
If your browser does not render page correctly, please read the page content below
View From The Citadel
Deep Dive Series

CRYPTOASSET ADOPTION & VOLATILITY

Where do we stand, where
do we go?
April 2023

Prepared by:
André Dragosch
                               research@deutschedigitalassets.com
Head of Research
Deutsche Digital Assets GmbH       www.deutschedigitalassets.com
DEUTSCHE DIGITAL ASSETS: CRYPTOASSET ADOPTION & VOLATILITY/ 2

Executive
Summary
This report examines the global adoption rates of cryptoassets, highlighting key trends and
factors that contribute to their growth. Developing countries lead the way in adoption rates, with
male millennials around the age of 35 being the most likely cryptoasset owners. Factors such as
inflation and money supply growth have an impact on adoption rates, with institutional investors
like high-net-worth individuals and financial advisors being the most likely to invest.
Retail adoption rates vary between 5% and 24%, while institutional adoption rates range from
28% to 57%. Switzerland and the Netherlands exhibit the highest adoption rates in Europe,
while France and the United Kingdom have the lowest. The pace of adoption has accelerated
post-Covid, with the growth rate of retail cryptoasset users averaging around 87% per year
since 2017.
In conclusion, the global adoption of cryptoassets is evolving rapidly, with a clear shift towards
digital and decentralized currencies. While certain demographic groups and countries are
more likely to adopt these assets, the growth rate of adoption tends to cycle and is typically
highest around market cycle tops. As such, it is important for investors and policymakers to
closely monitor these trends and adjust their strategies accordingly.

              Current State of Adoption
              Global cryptoasset adoption rates are currently around 19% for retail and
              57% for institutional investors.

              Outlook for Future Adoption
              Social dynamics and the associated economic benefits of cryptoassets will
              continue to drive global adoption in the future.

              Structural Decline in Volatility
              As adoption progresses, more heterogeneous types of investors are bound
              to lead to a continuous decline in cryptoasset volatility.
DEUTSCHE DIGITAL ASSETS: CRYPTOASSET ADOPTION & VOLATILITY/ 3

Introduction
“Creative Destruction is the essential fact about capitalism.” Joseph A. Schumpeter

Technological adoption is not always liked. Taxi drivers tend to dislike Uber. Hotel owners tend to
dislike Air BnB. Cinema owners tend to dislike Netflix. In fact, technologies usually have far-
reaching socio-economic consequences which can have both positive and negative effects for
societies. Old incumbent business models get “disrupted” and put out of business in consequence
of new ways of doing things. The process of “creative destruction” as Austrian economist Joseph
Schumpeter has once phrased it, naturally creates winners and losers which is why technological
adoption usually evolves rather slowly at the beginning before becoming mainstream, once the
so-called “critical mass” is achieved.
Think of the automobile for example: At the beginning of the 20th century, the main mode of
transportation was by horse such that there was a high adoption rate of horse carriages. With the
advent of mass-produced automobiles via the assembly line that was brought forth by Henry Ford,
horse carriage producers were at risk of going out of business and, in consequence, were vocally
against the adoption of automobiles as transportation technology. Eventually, despite a history of
horse transportation spanning thousands of years, automobiles became the dominant mode of
transportation to this day.
The automobile adoption example also highlights another important aspect of technological
adoption: Just because mankind has used horses for transportation in the preceding millennials,
does not necessarily imply that horses as transportation technology can never be disrupted. In
other words, a high time period of technological usage does not guarantee that it will not be
disrupted and replaced at some point in the future.
Age is no guarantor for survival in the technological sphere.
The same goes for those business models that the current financial system is focused on: Bitcoin
could potentially disrupt international cross-border payments, gold as a store-of-value and
potentially even the US Dollar as global reserve currency. Ethereum could potentially disrupt
centralized exchanges, banking institutions as well as the way we transfer assets in general. Other
cryptoassets have similarly bold implications for the financial system. These technologies all have
in common that they introduce a peer-to-peer based financial architecture that is apolitical and
censorship-resistant, and where control over assets is decentralized. They are fairly new (Bitcoin
was just introduced in 2009) and compete with technologies and financial architectures that have
gradually been established over the last centuries. It is no wonder that the majority of the
population is still suspicious of these newcomer technologies and that incumbent institutions tend to
dislike them as well.
Nonetheless, we will demonstrate in this research piece that not only cryptoasset adoption has
grown very rapidly in the last years but also that this trend is likely going to continue in the future
which is why every professional investor should engage with this topic.
The next chapter takes a look behind the reasons of technological adoption, both from a socio-
dynamic and economic point of view. The subsequent chapter performs a meta-study of different
surveys and reports on global cryptoasset adoption. Chapter 4 tries to forecast future
developments while chapter 5 tries to link cryptoasset adoption with volatility. Chapter 6
concludes.
DEUTSCHE DIGITAL ASSETS: CRYPTOASSET ADOPTION & VOLATILITY/ 4

Reasons for technological adoption

Social dynamics of adoption

Network Effect
A network effect in economics is the phenomena by which the value or utility a user obtains from a
good or service depends on the number of users of comparable products. It is also known as
network externality or demand-side economies of scale. Most of the time, positive network effects
lead to a user getting more value out of a product when other users join the same network.
Direct or indirect network effects are possible. When a product or technology is adopted by
numerous users, there are direct network effects that result, indicating that the use of the product by
various users is complementary. This effect is distinct from price-related benefits, such as a benefit
to current customers brought on by price reductions when more users sign up. Social networking
sites like Twitter, Facebook, Airbnb, Uber, and LinkedIn as well as telecommunications tools like
the phone and instant messaging services like MSN, AIM, or QQ all exhibit direct network
effects.
When there are "at least two different customer groups that are interdependent, and the utility of
at least one group grows as the other group(s) grow," indirect (or cross-group) network effects
occur. The rise of compatible software, for instance, may increase the value of hardware to
consumers.
Hence, technological adoption can be self-fulfilling driven by network effects.

Lindy Effect
According to the Lindy effect, commonly referred to as Lindy's Law, the lifespan of some non-
perishable items, such as ideas or technologies, will increase in direct proportion to their age in
the future. Accordingly, the Lindy effect postulates that something has a longer remaining life
expectancy the longer it has endured to exist or be employed in the present. A greater likelihood
of continuing to exist in the future and resistance to change, obsolescence, or competition are
implied by longevity. The mortality rate falls over time in areas where the Lindy effect is present.
The idea was formally conceived by comedians in Lindy's Delicatessen in New York City, hence
its name. Mathematicians and statisticians have since theorized about the Lindy effect.
Items that are "non-perishable," or don't have a "unavoidable expiration date," are affected by the
Lindy effect.
Humans, for instance, are brittle; in industrialized nations, the life expectancy at birth is roughly 80
years. As a result, the Lindy effect does not apply to individual human lifespan. For example, while
the Lindy effect would predict that both scenarios would have an equal likelihood of occurring, a
5-year-old person dying within the next five years is unlikely, while a 70-year-old person dying
within the next 70 years is highly likely.
Hence, the probability of technological adoption increases with an increase in lifespan of the
technology itself.
DEUTSCHE DIGITAL ASSETS: CRYPTOASSET ADOPTION & VOLATILITY/ 5

Dunning-Kruger Effect
The tendency of people with low skill in a particular field to give too positive judgments of this
competence is known as the Dunning-Kruger effect. This is frequently seen as a cognitive bias,
which is the systematic propensity to think and judge things incorrectly. Insofar as they consistently
manifest in various circumstances, biases are systemic. They are called tendencies because they
deal with particular propensities or inclinations that can be seen in groups of people but aren't
always displayed in actions. The Dunning-Kruger effect primarily affects persons who have little
expertise in a certain field and are attempting to gauge their level of proficiency in that field.
Technological adoption can be affected by the Dunning-Kruger Effect in the first stages of
adoption where people tend to underestimate the capabilities of a new technology and dismiss
them as irrelevant for them. This can hamper the speed of adoption at first but accelerate adoption
at a later stage when people had time to investigate the new technology.

Bottom Line
Network effects, the Lindy Effect and the Dunning-Kruger Effect will increase the likelihood of
continuing technological adoption of cryptoassets.

     Box 1: Thiers’ Law/Reverse Grashham’s Law
     Financial historian Adam Fergusson noted that during the great inflation in the Weimar
     Republic in 1923, as the official money became so worthless that essentially no one
     would take it, people just stopped accepting it in exchange for goods. As a result, any
     form of cash that was supported by value started to circulate.
     Zimbabwe's hyperinflation started to exhibit comparable traits in 2009.
     In a high inflation environment, people will choose to accept the money they believe
     has the highest long-term value if given the option, and they will refuse to accept money
     they believe has a poor long-term value. They will tend to keep the money with a higher
     perceived value in their hands and give the poor money to others if they are not given
     the option and are forced to accept all money, good and bad. This has the effect that
     poor money with low or no intrinsic value circulates more frequently while hard money
     gradually fades out of circulation due to hoarding.
     In other words, in the absence of legal tender regulations, the buyer will only offer
     money with the lowest commodity value (bad money), because the creditor must accept
     such money at face value, whereas the seller will only accept money of a specified
     value (good money) in the presence of legal tender laws.
     In honor of French politician and historian Adolphe Thiers, economist Peter Bernholz has
     dubbed this phenomenon—that good money drives away bad money anytime the latter
     is practically worthless— "Thiers' Law”, sometimes also referred to as “Reverse
     Grashham’s Law”.
     Theirs’ Law is an empirical example for an accelerated monetary adoption of hard
     media of exchange due to high inflation which could also be applicable to the
     adoption of scarce cryptocurrencies.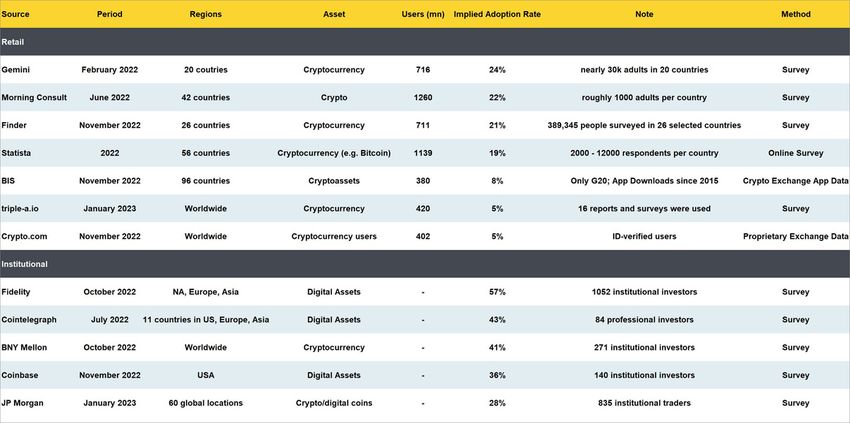
DEUTSCHE DIGITAL ASSETS: CRYPTOASSET ADOPTION & VOLATILITY/ 6

Economic reasons for technological
adoption
The reasons for technological adoption are manifold but are mostly of economic nature.
One of the primary economic reasons for technological adoption is the potential for increased
efficiency and productivity. New technologies often enable businesses to produce goods and
services more quickly and at a lower cost, which can lead to higher profits and improved
competitiveness. For example, the introduction of automated assembly lines and robotic systems in
manufacturing has dramatically increased the speed and efficiency of production, reducing labor
costs and increasing output. This has allowed companies to offer goods at lower prices, thus
increasing demand and expanding their customer base.
Another economic driver of technological adoption is the potential for innovation and new market
opportunities. As technologies advance and new ideas emerge, businesses are able to create
new products and services that were previously impossible or too costly to produce. This creates
new markets and opportunities for growth, leading to increased revenue and profits. For example,
the rise of smartphones and mobile applications has created a new market for app developers,
leading to the growth of an entirely new industry that did not exist a few decades ago.
In addition, technological adoption can lead to improved quality of life for consumers, which in
turn can drive economic growth. For example, the widespread adoption of personal computers
and the internet has transformed the way people live and work, enabling remote work, e-
commerce, and online education. These technological advancements have made it easier for
people to access goods and services, which has increased demand and expanded the market for
businesses.
Finally, technological adoption can have a positive impact on the environment and sustainability.
New technologies can help reduce waste, improve energy efficiency, and reduce greenhouse
gas emissions, all of which can have significant economic benefits. For example, the development
of renewable energy technologies has enabled businesses to reduce their reliance on fossil fuels,
leading to cost savings and reduced environmental impact.
In conclusion, the economic reasons behind technological adoption are varied and complex, but
they all stem from the potential for increased efficiency, innovation, and improved quality of life.
The adoption of new technologies has enabled businesses to produce goods and services more
quickly and at a lower cost, create new markets and opportunities for growth, and improve
environmental sustainability. As technology continues to evolve, it will undoubtedly continue to
play a crucial role in shaping the economy and driving economic growth.

Bottom Line
In general, the economic reasons behind technological adoption mostly center around a
potential for increased efficiency, innovation, and improved quality of life – all of which are
associated with the adoption of cryptoassets.
DEUTSCHE DIGITAL ASSETS: CRYPTOASSET ADOPTION & VOLATILITY/ 7

The economics of crypto adoption
In the context of cryptoassets and blockchain technologies, the economic reasons also center
mostly around higher productivity and efficiency gains. For instance, Bitcoin combines the temporal
salability of gold with the spatial salability of fiat monies like the US Dollar.
To put it more simply, gold as a scarce commodity allows holders to transfer value across time by
maintaining their purchasing power over time (=”temporal salability”). A drawback of gold is that it
was not convenient to transfer gold over long distances without a significant loss of its face value
due to transportation costs (=”spatial salability”) which is why fiat money like the US Dollar with
only a claim on physical gold historically started to circulate as a substitute and eventually
disrupted gold as a payment technology. The issue with fiat monies is that they do not possess
temporal salability like gold since they have no intrinsic value and tend to lose purchasing power
over time through inflation.
Bitcoin solves both the issue of temporal salability as a scarce asset and spatial salability of fiat
money due to its electronic payment capabilities. So, there is an economic rationale behind the
adoption of Bitcoin.

                       Gold                                    Fiat Money
                       ''temporal                              ''spatial
                       salability''                            salability''

Another important economic reasons is that it is simply cheaper for users to send Bitcoin to one
another than to rely on traditional financial system infrastructure, especially when it comes to cross-
border payments.
Think of remittances for example: It takes a couple of seconds to send Bitcoins via the Lightning
Network from a user in the US to a user in El Salvador for a fraction of a Cent. At the same time,
traditional bank transfers can take up to several weeks in order to arrive at the recipient in another
country, especially when that recipient is located in a developing country.
The reason is that traditional financial payment rails like SWIFT are antiquated networks with many
intermediaries involved which increase the overall cost structure and the overall processing time.
Other cryptoassets such as Ethereum also offer potential for increased efficiency and cost-savings
in the realm of security clearing and settlement. Imagine the following steps that are involved in a
securities’ order via the traditional financial system: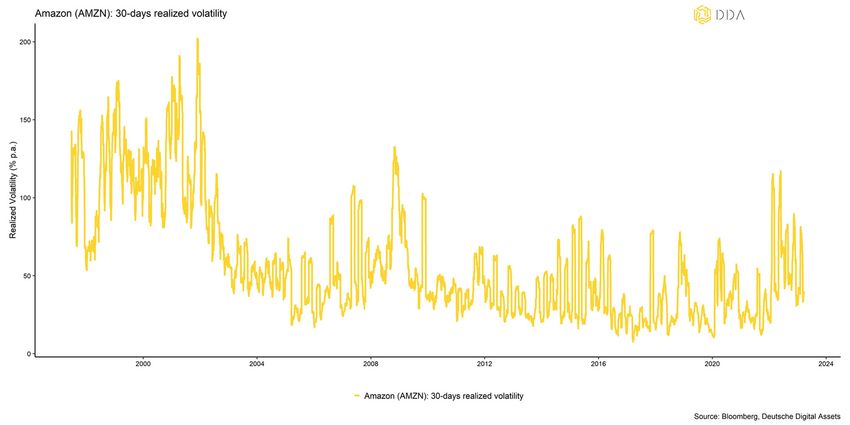
DEUTSCHE DIGITAL ASSETS: CRYPTOASSET ADOPTION & VOLATILITY/ 8

 1. Investor places an order with a broker/dealer
 2. Broker/dealer firm sends the order to an exchange or market for execution
 3. The transaction is matched between buying and selling parties
 4. The market’s automated systems send trade information to the respective clearing corporation
 5. The clearing corporation confirms the trade details between participating firms to create a
    guarantee on the completion of the transaction
 6. The clearing corporation steps in as central counterparty, assuming responsibility to make the
    trade whole should either buyer or seller not be able to meet obligations
 7. The clearing corporation issues a trade summary to the buyer and seller, indicating net
    money and net securities owed for settlement
 8. The clearing corporation sends instructions to the Depository Trust company, detailing net
    positions to be settled
 9. Depository Trust Company transfers securities electronically from the selling firm’s account to
    the clearing corporation’s account with the Trust Company, and then from the clearing
    corporation’s account to the buying firm’s account
10. Firms instruct their settling banks to settle funds to, or receive funds from, depository trust
    corporation to complete the transaction.
Not only is the abovementioned process rather complex but it also involves some element of risk
due to counterparty and settlement risks as settlement usually occurs after t + 2 days later.
In contrast, consider the following exemplary process involved in buying a tokenized security:
  1. Investor sends stablecoin to smart contract address in order to buy tokenized security.
  2. Security token is automatically transferred to investor wallet via smart contract that is triggered
     via receipt of stablecoin (delivery-versus-payment)
This example highlights that sending any type of value, monetary and/or asset, can be as easy
and instant as sending an Email which can have significant disruptive potential for the financial
services industry.
Due to its complete automation and frequent settlement times (in the case of Ethereum, a block is
validated every ~12 seconds), final settlement can be achieved significantly faster than in
traditional financial markets and trading is enabled 24/7/365. There are even more cost-
savings and efficiency gains involved in post-trade processes, e.g. in tax filings, regulatory filings,
reportings and asset custody.
Moreover, the abovementioned trade and settlement process can not only be applied to the
purchase of financial securities but also real tangible assets such as tokenized real estate, fine art
or commodities.
Ethereum has also established itself as the prime cryptoasset for issuing Non-Fungible Tokens
(NFTs) which represent unique, immutable, and transferable entries in the blockchain. NFTs build
the basis for unique digital assets and enable the development of new digital ecosystems based
on transferable values, e.g. in the metaverse. Examples are the Otherdeeds NFTs that represent
unique digital land plots in the metaverse which are based on Ethereum.
Moreover, Ethereum has become the prime platform for the establishment of Decentralized
Applications (dApps) of all sorts that can be programmed and automized on the Ethereum
blockchain.
Other cryptoassets such as Uniswap or Avalanche enable the exchange of assets without central
counterparty (Decentralized Exchange – DEX) or borrowing & lending without bank/financial
intermediary (Decentralized Finance – DeFi) on a fully automated basis. This has the potential to
disrupt and revolutionize the traditional financial industry.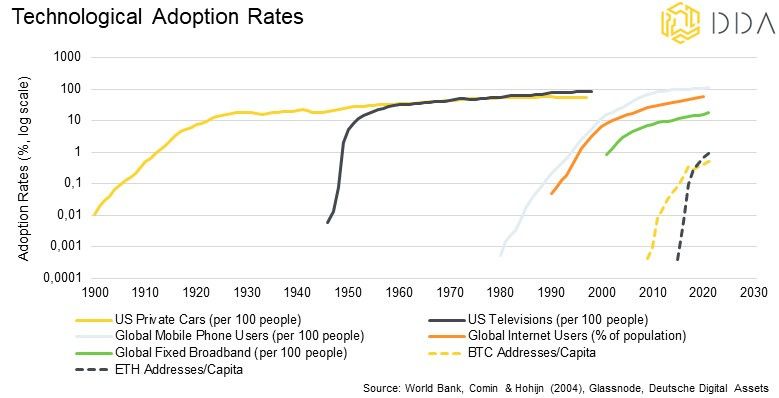
DEUTSCHE DIGITAL ASSETS: CRYPTOASSET ADOPTION & VOLATILITY/ 9

Bottom Line
Bottom Line: There is a strong economic rationale behind the adoption of cryptoassets. In the
case of Bitcoin, it is the combination of “temporal salability” of gold with the “spatial
salability” of fiat currencies. Other cryptoassets such as Ethereum have the potential to
significantly increase operational efficiency with respect to asset transferability and provide a
platform for other digital ecosystems via NFTs or Decentralized Applications (dApps).
Moreover, the establishment of Decentralized Exchanges (DEXs) and Decentralized Finance
(DeFi) platforms have the potential to disrupt and revolutionize the traditional financial
industry.

     Box 2: Network Valuation
     The approaches to network valuation usually center around the number of users in a
     given network. The logic behind it is that the utility and value of a network is somewhat
     proportional to the overall number of network participants.
     For instance, according to Metcalfe's law, a telecommunications network's worth is
     proportional to the square of the number of users who are connected to the system
     (n^2). Metcalfe's law was first put forth in this form by George Gilder in 1993 and is
     credited to Robert Metcalfe in relation to Ethernet. It was first articulated in terms of
     "compatible communicating devices" around 1980 rather than users (e.g., fax
     machines, telephones). This law was originally intended to describe Ethernet
     connections, and it wasn't until later, with the globalization of the Internet, that it applied
     to people and networks.
     In general, there have been different relationships proposed between network value
     and the number of users.
                       Sarnoff’s Law: Network Value = Number of users
             Zipf’s Law: Network Value = Number of users * log(number of users)
                      Metcalfe’s Law: Network Value = Number of users^2
     One of the most-widely used valuation relationship today is still Metcalfe’s Law which
     assumes a parabolic relationship between the number of users and the value of the
     network. This contrasts to Sarnoff’s Law which only assumes a linear relationship
     between the number of users and the value of the network.
    The following charts show the relationships between the market cap of both Bitcoin and
    Ethereum and their value transferred throughout the network (addresses * transfer
Bankvalue).
     LendingAs Channel
               can be seen, there is a tight relationship between network activity and the
    valuation of the respective network.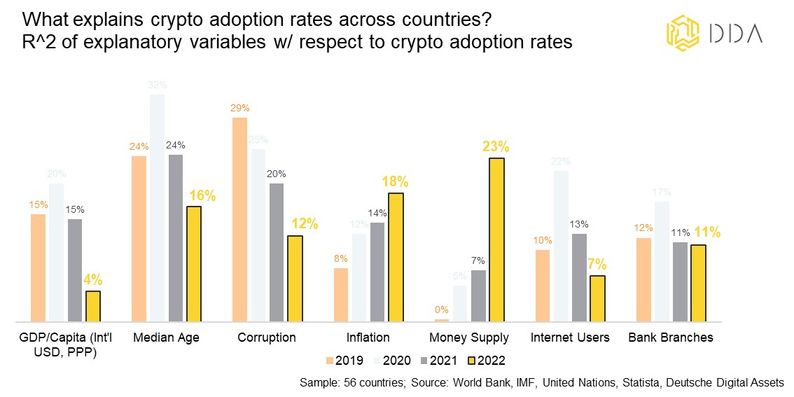
DEUTSCHE DIGITAL ASSETS: CRYPTOASSET ADOPTION & VOLATILITY/ 10

Crypto Adoption: Where do we
stand?

   Stylized facts on global cryptoasset adoption

         Adoption rates are generally higher in developing countries relative to developed
         countries; 8 out 10 countries within the top 10 of countries with the highest
         adoption rates are developing countries according to the IMF definition
         Demographically, most of the studies identify male millennials around the age of
         35 most likely as cryptoasset owners; cryptoasset ownership is usually lower with
         female and/or, elderly parts of the population
         Different socio-economic factors can explain the variations in crypto adoption
         rates across countries, with inflation and money supply growth becoming
         increasingly significant
         Among institutional investors, HNWIs and financial advisors are more likely to
         invest into cryptoassets while Pension funds and E&Fs are usually the least likely
         types of investors
         Depending on the study, global cryptoasset adoption rates vary between 5% and
         24% for retail individuals and 28% to 57% for institutional investors
         Within Europe, Switzerland and the Netherlands tend to exhibit the highest
         cryptoasset adoption rates while France and the United Kingdom tend to exhibit
         the lowest cryptoasset adoption rates
         The pace of global cryptoasset adoption has significantly picked up post-Covid,
         especially in 2021
         Growth rate of adoption evolves in cycles and tends to be highest around market
         cycle tops
         Growth rate of retail cryptoasset users has averaged around 87% p.a. since 2017

Current state of global crypto adoption
The current state of crypto asset adoption globally varies significantly from country to country.
While some countries have embraced crypto assets and created a friendly regulatory
environment, others remain skeptical or outright hostile to the technology.
In countries such as the United States, the United Kingdom, and Switzerland, the adoption of
crypto assets has been on the rise. These countries have created regulatory frameworks that allow
for the growth and development of the crypto asset industry. For example, in the United States,
although the Securities and Exchange Commission (SEC) has recently created uncertainty
surrounding unsolicited security offerings, it has been working to clarify regulations around crypto
assets, allowing for more institutional investment in the space. Similarly, Switzerland has
established itself as a hub for blockchain and crypto innovation, with its Crypto Valley becoming a
global leader in the field.
DEUTSCHE DIGITAL ASSETS: CRYPTOASSET ADOPTION & VOLATILITY/ 11 In contrast, other countries, such as China and India, have taken a more cautious approach to crypto assets. In China, the government has banned initial coin offerings (ICOs) and has cracked down on cryptocurrency exchanges and mining, citing concerns over fraud and financial instability. In India, the Reserve Bank of India has prohibited banks from dealing with crypto- related businesses, citing concerns over money laundering and terrorism financing. Despite the varying levels of adoption and regulation, the overall trend towards adoption of crypto assets globally has been positive. The growth rate of global retail cryptoasset adoption has averaged ~87% p.a. and these are just ID-verified users (see chart above). In general, cryptoasset adoption is usually evolving in a pro-cyclical fashion, experiencing higher growth rates in bull markets than in bear markets. We have seen the highest growth rates during the peaks of the last two bull markets in December 2017 and May 2021, respectively. The number of ID-verified cryptoasset users currently stands at approximately 420 mn people world-wide. This should be regarded as a lower-bound estimate. Earlier studies on global ID- verified users have also made estimations on the total user count such as the one by the Cambridge Centre for Alternative Finance. For instance, total user count was reported to be 2 to 9 times larger than the ID-verified user count between 2016 and 2020. Based on these earlier estimates, current total user count is probably around 650 mn users world-wide. The reason is that many investment options do not involve a form of KYC and ID-verification. Users might use anonymous third-party wallets and receive cryptoassets from other users. Another way is to earn cryptoassets via anonymous mining, through IT-development activity or simply exchange it on a Peer-to-Peer basis without any exchange involved. Bottom Line Cryptoasset adoption evolves in cycles and is usually highest around market cycle peaks. The growth rate of global retail cryptoasset adoption has averaged ~87% p.a. (ID-verified users). Cryptoasset adoption has significantly picked up post-2020.
DEUTSCHE DIGITAL ASSETS: CRYPTOASSET ADOPTION & VOLATILITY/ 12

Using blockchain data to estimate global adoption
Although the open ledger of a blockchain allows for public access to its entire transaction history,
determining the network's user base is generally not an easy task.
Consider the following blockchain metrics for Bitcoin for example (source: Glassnode):
    Cumulative net new entitites: 34.5 mn
    Total non-zero addresses: 45 mn
    Total UTXOs: 138.5 mn
    Total addresses: 1105 mn
Even today, the number of addresses in the Bitcoin network are still most frequently used as a
proxy for the total number of Bitcoin users and holders.
Yet it is commonly known that this strategy is flawed, mostly because there is no direct link
between users and Bitcoin addresses:
  1. Bitcoin addresses can store money from several people (e.g. exchange addresses).
  2. Several Bitcoin addresses that are holding BTC can be owned and managed by a single
     entity.
Most of these issues have not been resolved so far and experts still have to resort to estimations
despite the availability of detailed blockchain data. This could change in the future, due to the
ongoing practice of “address tagging” that will allow for a better differentiation of wallet
addresses.

Bottom Line
Despite its unparalleled public transparency, blockchain data do not provide an optimal view
on the extent of global cryptoasset adoption, mostly because there is no direct link between
users and addresses.
DEUTSCHE DIGITAL ASSETS: CRYPTOASSET ADOPTION & VOLATILITY/ 13
A meta survey of global cryptoasset adoption
Nonetheless, a more promising avenue to determine the current global adoption rate of
cryptoassets has been to conduct surveys in several countries. We have conducted a meta study
of the most recent investor surveys, both for retail and institutional investors. The results are
displayed in the table below.
It turns out that global retail cryptoasset adoption rates vary between 5% and 24% while
institutional cryptoasset adoption rates vary between 28% and 57%. For the retail space, we think
that the study conducted by Statista appears to reflect the amount of global adoption most
accurately since it covers a wide array of countries (56 countries) and covers a representative
sample on a per-country basis (2000 – 12000 respondents per country). According to this
survey, the highest adoption rates are currently found in Nigeria, Thailand and Turkey, while the
lowest adoption rates are found in France, China and Israel:
Global Crypto Adoption Rates
Source: Statista, Deutsche Digital AssetsDEUTSCHE DIGITAL ASSETS: CRYPTOASSET ADOPTION & VOLATILITY/ 14 Adoption rates in percentage terms can hide the relative importance of individual countries in absolute terms. For instance, although China has only an adoption rate of 9% based on the Statista survey, the sheer size of the Chinese population implies that approximately 127 mn Chinese people hold cryptoassets. In absolute terms, India represents by far the biggest market with approximately 351 mn individuals holding cryptoassets. Applying the different surveyed adoption rates as reported by Statista to the respective country populations, we estimate that approximately 1.1 bn people world-wide are already holding or using cryptoassets such as Bitcoin (~19% of global population). Bottom Line Based on a variety of surveys, global retail cryptoasset adoption rates vary between 5% and 24% while institutional cryptoasset adoption rates vary between 28% and 57%. Cryptoasset adoption in Europe Cryptoasset adoption in Europe has been on the rise in recent years, with countries taking different approaches to regulation and adoption. The European Union has been working to establish a comprehensive framework for crypto assets, while individual countries have been developing their own regulatory environments and fostering growth in the industry. In January 2021, the European Union introduced a new regulatory framework for crypto assets, known as the Markets in Crypto-Assets (MiCA) regulation. The aim of MiCA is to provide a clear regulatory framework for the issuance, trading, and custody of crypto assets, and to promote investor protection and market integrity. MiCA has been well received by industry participants, who have praised the clarity and certainty it provides. The vote on the MiCA regulation has recently been postponed due to minor technical issues until April 2023 when it is expected to pass the European Parliament. This is bound create a transparent and safe regulatory environment for cryptoassets within the EU. Individual countries in Europe have also been working to establish their own regulatory environments for crypto assets. Switzerland, for example, has established itself as a hub for blockchain and crypto innovation, with its Crypto Valley becoming a global leader in the field. The country has a progressive regulatory framework for crypto assets, which has attracted numerous crypto startups and investors. This might explain the significantly higher rates of adoption in Switzerland compared to other jurisdictions. Other European countries, such as Germany and France, have also taken steps to establish clear regulatory frameworks for crypto assets. In Germany, a new law passed in December 2020 allowing institutional funds to invest up to 20% of their assets in crypto assets, while in France, a new regulatory framework for initial coin offerings (ICOs) has been established. Within Europe, we can observe the highest retail adoption rates in the Netherlands (20%), Switzerland (20%), and Greece (18%) while France (9%), the United Kingdom (11%), and Sweden (11%) exhibit the lowest rates of adoption, according to the survey conducted by Statista.
DEUTSCHE DIGITAL ASSETS: CRYPTOASSET ADOPTION & VOLATILITY/ 15

European Crypto Adoption Rates

                                                                                   Source: Statista, Deutsche Digital Assets

Bottom Line
In Europe, retail cryptoasset adoption is currently highest in the Netherlands (20%),
Switzerland (20%), and Greece (18%) while France (9%), the United Kingdom (11%), and
Sweden (11%) exhibit the lowest rates of adoption.

What explains different adoption rates?
The differences in adoption rates across countries are believed to be attributable to a number of
factors but the entry of new cryptoasset users appears to be mostly driven by increases in prices
(BIS, 2022). This hypothesis is also supported by the data on global ID-verified users which
shows the highest rates of user growth during bull market cycle peaks (see chart above).
Variations across countries can also be explained by demographic differences since cryptoasset
adoption is significantly more pronounced in younger (and male) parts of the population which is
usually less risk averse (BIS, 2022). Since the average age of the population is significantly lower
in developing countries relative to developed countries, lower average age could explain
significantly higher adoption rates in these countries. Thus, there appears to be an inverse
correlation of age and cryptoasset adoption across countries.
Other typical explanations found in the academic literature are bank penetration (number of bank
branches per 100k people) and the number of internet users (as % of the population) but more
recent studies do not find a significant influence of these variables on the entry of new cryptoasset
users.
The following chart shows the % of variation in cryptoasset adoption rates across countries
explained by the respective metric over time:
DEUTSCHE DIGITAL ASSETS: CRYPTOASSET ADOPTION & VOLATILITY/ 16 As can be seen in the chart above, in the earlier years, median age and the perceived degree of corruption within countries were able to explain a large part of variations in cryptoasset adoption rates across countries. On average, a younger population was associated with higher rates of adoption, especially in 2020. This supports the notion by other studies that crypto adoption is usually higher with the more risk-seeking younger parts of the population. The perceived degree of corruption used to explain a significant part of variation across countries but has gradually declined in importance over time. A high degree of perceived corruption might be associated with other circumstances such as low trust in government or the ability to expropriate wealth. Cryptoassets as a trustless, unconfiscatable, censorship-resistant asset might provide a more secure way to transfer and store wealth in such an environment. More recently, different inflation and money supply growth rates across countries were able to explain an increasing part of crypto adoption variation across countries. The coefficients are also positive implying that higher levels of inflation/money supply growth are associated with higher rates of cryptoasset adoption rates across countries and vice versa. This supports the notion that scarce cryptoassets such as Bitcoin increasingly appear to be seen as hedge against inflation/monetary debasement, especially in developing countries like Argentina where inflation rates are significantly higher than in developed countries. Please note that cryptoassets also include stablecoins backed by major currencies such as the US Dollar which are traditionally used as a store-of-value in developing countries. That being said, the higher degree of explanatory power of either inflation and money supply growth seems to be skewed by high inflation countries (Argentina = AG and Turkey = TU) that happen to show high rates of crypto adoption. In contrast, countries like Nigeria (NG) or Thailand (TH) that exhibit one of the highest adoption rates currently do not show significantly higher rates of inflation/money supply growth.
DEUTSCHE DIGITAL ASSETS: CRYPTOASSET ADOPTION & VOLATILITY/ 17

Bottom Line
All in all, there are different factors that can explain why there are differences in cryptoasset
adoption rates across countries. However, these factors are dynamic and seem to change in
relevance over time. This is also consistent with the changing characteristics of cryptoassets
and the different investment narratives over time.

Retail vs institutional adoption
Based on the Statista survey, the retail cryptoasset adoption rate has increased from 10% in 2019
to 19% in 2022. Similarly, institutional adoption rates have increased from 22% in 2019 to 57%
in 2022, based on a global survey of institutional investors conducted by Fidelity.
DEUTSCHE DIGITAL ASSETS: CRYPTOASSET ADOPTION & VOLATILITY/ 18

In terms of demographics, most retail surveys identify male millennials, around the age of 35, to
be most likely to hold cryptoassets. The preferred cryptoassets identified in those surveys are
usually Bitcoin (BTC) and Ethereum (ETH), followed by Dogecoin (DOGE). For instance, based
on the latest Cryptocurrency Adoption survey conducted in November 2022 by Finder,
approximately 36% of global respondents who already hold cryptoassets have indicated that
they hold Bitcoin (BTC), followed by 24% who indicated that they hold Ethereum (ETH).
Among institutional investors, most surveys identify High Net Worth Individuals (HNWIs) and
Financial Advisors as being most likely to invest into cryptoassets, while Pension funds as well
Endowments & Foundations are potentially less likely to invest into cryptoassets.

Bottom Line
Both retail and institutional cryptoasset adoption rates have significantly increased since
2019. Most retail surveys identify male millennials, around the age of 35, to be most likely to
hold cryptoassets. Most surveys identify High Net Worth Individuals (HNWIs) and Financial
Advisors among institutional investors as being most likely to invest into cryptoassets, while
Pension funds as well Endowments & Foundations are potentially less likely to invest into
cryptoassets.

Crypto Adoption: Where are we going?
In order to forecast where cryptoasset adoption is going to develop in the future, it makes sense to
analyse historical developments in the past. In this regard, several remarks with respect to the
historical developments of technological adoption are in order:
According to the model first introduced by Rogers (1962), technological adoption usually follows
a pattern with 5 distinctive groups of adopters:
  1. Innovators (2.5%)
  2. Early Adopters (13.5%)
  3. Early Majority (34%)
  4. Late Majority (34%)
  5. Laggards (16%)
Based on this model, in most countries today, we are still in the early stages of cryptoasset
adoption with only Innovators and Early Adopters (~16% of the population) using cryptoassets
according to most retail surveys. This is particularly true for developed countries.
Technological adoption usually follows an “S-curve” which represents a logistic growth function:
The exponential growth of a small population creates the lower curve of the S. As the population
gets close to its carrying capacity and its growth rate decreases, the upper curve of the S is
produced.
It is important to note that the “take-off phase” happens between phase 2 and 4 when the
majority of the population is “captured” by the new technology. This implies that high growth rates
of global cryptoasset adoption are still ahead.
However, another important remark to make is that cryptoasset adoption has so far grown faster
than many preceding technological innovations before that. In other words, it took less time to
reach a similar adoption rate for both Bitcoin and Ethereum compared to the internet or mobile
phones on a global basis.
DEUTSCHE DIGITAL ASSETS: CRYPTOASSET ADOPTION & VOLATILITY/ 19

There is a general tendency for new technologies to reach saturation faster than preceding
technologies.
Consider the following examples for the US:

The aforementioned examples demonstrate that the amount of time needed for widespread
technological adoption has decreased throughout time. At least as far as the US is concerned, but
certainly the rest of the world should exhibit a similar pattern, albeit possibly not at the same rate
of acceleration.
DEUTSCHE DIGITAL ASSETS: CRYPTOASSET ADOPTION & VOLATILITY/ 20

This implies that closing the existing digital divide in terms of access to cutting-edge
information technologies should take a lot shorter time than, say, radio or electricity did.
Of course, a lot of this depends on the unique social, political, economic, and cultural
conditions of each nation and region but it generally implies that cryptoasset adoption
could also be faster than the internet itself.

To answer this question more specifically, we have estimated a simple model for Bitcoin
adoption based on the global mobile phone adoption rate.
In a first step, we have estimated the relationship between the price of Bitcoin and its
adoption rate based on non-zero Bitcoin addresses per capita on a global basis as a
proxy for its adoption rate.

In a second step, we have aligned the starting point of the historical mobile phone
adoption curve with that of Bitcoin and estimated the model price for Bitcoin:

                                                                                Chart N13

As can be seen in the chart shown above, the price of Bitcoin and non-zero addresses
per capita have initially grown faster than the historical mobile adoption curve would
suggest.

That being said, assuming that Bitcoin adoption would take a similar path as global
mobile phone adoption, this implied a model price of around ~100k USD by the end of
2023 and ~733k USD by the end of 2025.

As a matter of course, neither adoption nor price will evolve in a straight linear fashion
but will exhibit cycles of lower and higher growth rates over time as mentioned in the
previous chapter.
Nonetheless, it is generally valid to say that global cryptoasset adoption is still in the
early stages since the current rate of adoption, based on non-zero addresses per capita
for Bitcoin, is around 0.5% which is comparable to the global rate of adoption of
mobile phones in the year 1993 or the % of global internet users in the year 1995.
DEUTSCHE DIGITAL ASSETS: CRYPTOASSET ADOPTION & VOLATILITY/ 21 This is also true for the relative market capitalizations for both Bitcoin and Ethereum relative to established traditional financial assets: For instance, the current market capitalization of Gold is approximately 25 times larger and global m2 money supply is even more than 200 times larger than the current market capitalization of Bitcoin. These examples highlight that the potential upside for further adoption of cryptoassets is potentially still quite significant. Bottom Line There is still significant upside for global cryptoasset adoption as we are still at the early stages of the adoption curve. The historical path of global mobile phone adoption also implies significant upside price potential for Bitcoin. Cryptoasset market caps are also still relatively small compared to traditional assets such as equities or bonds.
DEUTSCHE DIGITAL ASSETS: CRYPTOASSET ADOPTION & VOLATILITY/ 22
Cryptoasset adoption and
volatility
In order to understand the link between cryptoasset adoption and price volatility from a theoretical
point of view, it is useful to look at how investor behavior and price discovery in financial markets
work in general.
The Efficient Market Hypothesis (EMH) has long been the dominant theory in finance, suggesting
that market prices reflect all available information and that it is impossible to consistently beat the
market. However, the emergence of the Fractal Market Hypothesis (FMH) challenges this notion
by arguing that markets exhibit patterns of self-similarity and non-randomness, i.e. trends.
The FMH builds upon the concept of fractals, which are complex patterns that repeat at different
scales. In financial markets, this means that the same patterns can be observed across different time
frames, from seconds to years. Proponents of the FMH argue that these fractal patterns provide
evidence of market inefficiencies that can be exploited by skilled investors.
In contrast, the EMH assumes that markets are efficient, meaning that asset prices reflect all
available information and that it is impossible to consistently outperform the market without taking
on additional risk. Proponents of the EMH argue that any patterns or anomalies observed in the
market are simply the result of random noise and not evidence of market inefficiencies.
The main difference between both types of hypotheses is the fact the FMH has more realistic
assumptions than the EMH:
EMH FMH
Imperfect and
Information set Perfect and symmetric
asymmetric
Types of investors Homogenous Heterogenous
Investment horizon Homogenous Heterogenous
With respect to the adoption of cryptoassets, the FMH might give us a better understanding how
higher adoption and a more heterogenous investor base might affect cryptoasset volatility in the
future.
Consider a retail day trader and a pension fund for example:
A day trader might consider a large intra-day price decrease as a reason to close the positions for
the day. In contrast, a pension fund investment manager might use the price decrease as a buying
opportunity to increase exposure. Disagreement between these two types of investors (day trader
versus pension fund) with respect to the underlying asset actually creates a market of buyer and
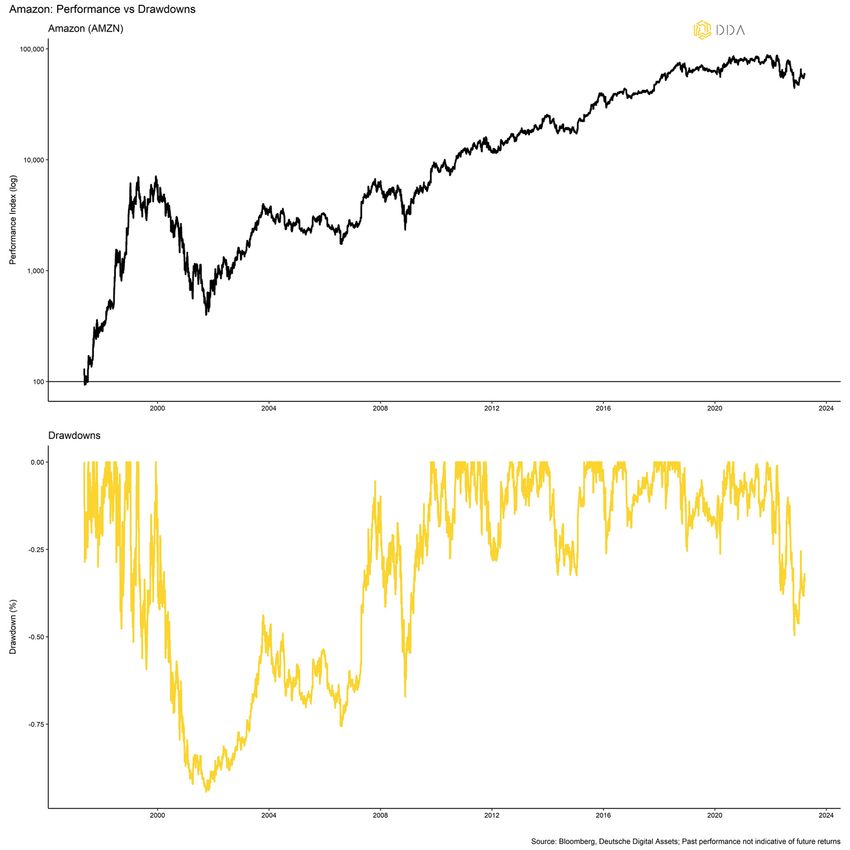
seller and therefore stability.DEUTSCHE DIGITAL ASSETS: CRYPTOASSET ADOPTION & VOLATILITY/ 23 Now consider the extreme case of only day traders (homogenous investors) in the market with symmetric and perfect information, i.e. all have the same amount and all available information. This would imply that all these investors would buy and sell at the same moment in time as they would all agree on the underlying asset simultaneously. The price would theoretically fluctuate between 0 and infinity! This homogeneity and group-think among investors would create instability and therefore higher volatility in the market. These simplified examples go a long way in explaining that a more heterogenous investor base through wider adoption is bound to create more disagreement between buyers and sellers, which creates stability and should have a dampening effect on volatility in the long term. From a historical point of view, most investors dismiss the fact that companies that are very widely adopted among investors & consumers today used to be as risky as cryptoassets today in terms of volatility and drawdowns. For instance, Amazon Inc. (AMZN) stocks lost approximately 90% of their value during the “Dot- Com” crisis in the early 2000s.
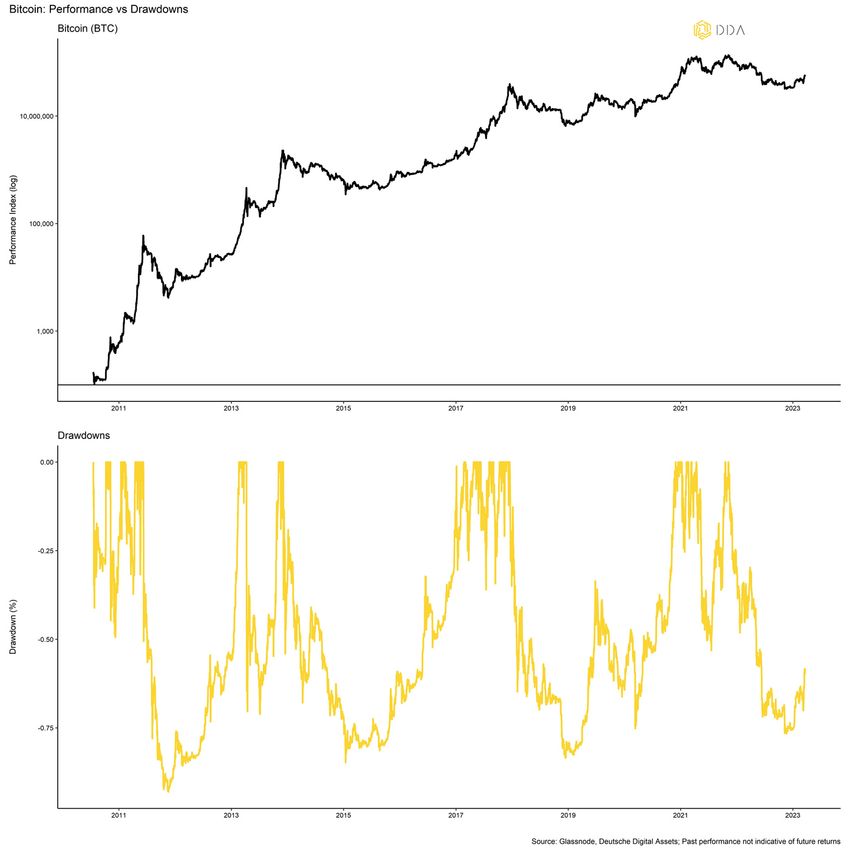
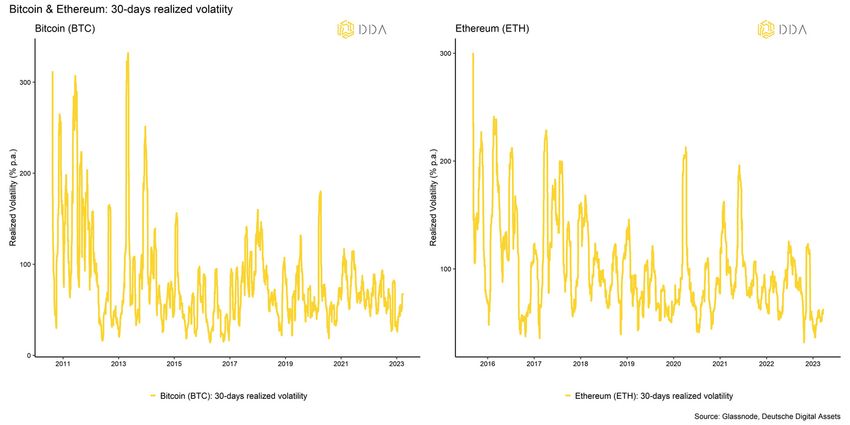
DEUTSCHE DIGITAL ASSETS: CRYPTOASSET ADOPTION & VOLATILITY/ 24

Back then, the internet and online retailing were still in its infancy and stocks such as Amazon were
considered high risk among investors. As the technological adoption of the internet and the volume
of online retailing grew over time the drawdowns of Amazon stocks also structurally declined over
time.
Similarly today, cryptoassets such as Bitcoin (BTC) and Ethereum (ETH) are considered to be high
risk among traditional investors.

However, we expect bear market cycles and drawdowns for cryptoassets to be structurally less
pronounced than in the past and this pattern appears to be playing out already. Bitcoin
drawdowns have gradually been less severe over time.
The same is true for volatility. We also expect with increasing rates of adoption and a more
“fractal” market structure of investors that volatility is going to continue to decrease over the coming
years. Historically speaking, this was the pattern that we observed with Mega Cap growth stocks
today as well. For instance, Amazon stocks (AMZN) had a realized 30-days volatility of above
200% p.a. during the turn of millennium, whereas currently the stock price usually fluctuates less
than 50% p.a.
DEUTSCHE DIGITAL ASSETS: CRYPTOASSET ADOPTION & VOLATILITY/ 25

Bottom Line
Continuing adoption is bound to lead to more heterogenous investor base. According to the
Fractal Market Hypothesis (FMH), increasing “disagreement” among investors should lead
to more market stability and should have a dampening effect on volatility over time. The
historical example of Amazon Inc. highlights that very risky assets can exhibit a structural
decline in volatility and drawdowns over time with more adoption by consumers and
investors.
DEUTSCHE DIGITAL ASSETS: CRYPTOASSET ADOPTION & VOLATILITY/ 26

Conclusion
Cryptocurrency, or cryptoasset, adoption rates vary across the globe, with developing countries
leading the way. In fact, according to the IMF definition, eight out of ten countries with the
highest adoption rates are developing countries.
When it comes to demographics, male millennials around the age of 35 are most likely to be
cryptoasset owners. However, ownership tends to be lower among females and/or the elderly
population.
Different socio-economic factors can explain why crypto adoption rates vary across countries.
For example, inflation and money supply growth have become increasingly significant.
Institutional investors also have varying levels of interest in cryptoassets. High-net-worth
individuals and financial advisors are more likely to invest, while pension funds and endowments
are usually the least likely.
Global cryptoasset adoption rates for retail individuals vary between 5% and 24%, while rates
for institutional investors range from 28% to 57%, depending on the study.
Within Europe, Switzerland and the Netherlands exhibit the highest cryptoasset adoption rates,
while France and the United Kingdom have the lowest.
The pace of global cryptoasset adoption has significantly picked up post-Covid, especially in
2021. The growth rate of adoption evolves in cycles, with the highest growth rates typically
occurring around market cycle tops.
The growth rate of retail cryptoasset users has averaged around 87% per year since 2017. As
the world becomes more digital and decentralized, it will be interesting to see how these trends
evolve over time.
DEUTSCHE DIGITAL ASSETS: CRYPTOASSET ADOPTION & VOLATILITY/ 27

References and Notes
Auer, R., Cornelli, G., Doerr, S., Frost, J., & Gambacorta, L. (2023). Crypto trading and Bitcoin prices:
evidence from a new database of retail adoption. BIS Working Papers, No 1049

BNY Mellon (2022). Institutional Investing 2.0. Migration to Digital Assets Accelerates. 2022 Survey of
Global Institutional Clients. Asset Managers, Asset Owners and Hedge Funds. Retrieved from
https://www.bnymellon.com/content/dam/bnymellon/documents/pdf/insights/migration-digital-
assets-survey.pdf
Bohlen, Joe M.; Beal, George M. (1957). "The Diffusion Process". Special Report No. 18. 1: 56–77.
Böhme, R., Christin, N., Edelman, B. and Moore, T. (2015). Bitcoin: Economics, technology, and
governance. Journal of economic Perspectives, 29(2), pp.213-38.

Coinbase (2022). Institutional Investor 2022 Digital Assets Outlook Survey. Retrieved from
https://coinbase.bynder.com/m/7aa9f2eda4c12b2e/original/2022-Institutional-Investor-Digital-
Assets-Outlook-Survey.pdf

Cointelegraph (2022). Institutional Demand for Cryptocurrencies. Global Survey 2022. Retrieved from
 https://research-backend.cointelegraph.com/uploads/attachments/cl9h93fan0x79r4qnd5oaco71-
institutional-demand-report-0-21.pdf
Crypto.com (2022). 2022 Year Review and 2023 Year Ahead. Retrieved from
https://content-hub-static.crypto.com/wp-content/uploads/2022/12/Public-2022-Year-Review-
2023-Year-Ahead-1.pdf
Dragosch, A. (2021). Modelling Bitcoin Value with Abundance. Avantgarde Digital Research Blog.
Retrieved from https://medium.com/@andre-dragosch/modeling-bitcoin-value-with-abundance-
20aa35fd4e5e

Dragosch, A. (2022). Cryptoassets and the Macroeconomy. Can macro factors explain the price of
Bitcoin? Deutsche Digital Assets GmbH. https://deutschedigitalassets.com/insights/news/cryptoassets-
and-the-macroeconomy-can-macro-factors-explain-the-price-of-bitcoin/

Dragosch, A. (2022). Cryptoassets in The New Inflation Regime: Is Bitcoin an inflation hedge? Deutsche
Digital Assets GmbH. https://deutschedigitalassets.com/insights/news/cryptoassets-in-the-new-
inflation-regime-is-bitcoin-an-inflation-hedge/

"Dunning-Kruger effect". www.britannica.com. Archived from the original on 30 November 2021.
Retrieved 7 January 2023.
Peters, E. E. (1994). Fractal market analysis: applying chaos theory to investment and economics (Vol.
24). John Wiley & Sons.
DEUTSCHE DIGITAL ASSETS: CRYPTOASSET ADOPTION & VOLATILITY/ 28

References and Notes
Eliazar, I. (2017). "Lindy's Law". Physica A: Statistical Mechanics and Its Applications. 486: 797–805.
Fidelity (2019). Press Release: “New Research from Fidelity finds institutional investments in digital assets
are likely to increase over the next five years.” Retrieved from
 https://s2.q4cdn.com/997146844/files/doc_news/archive/59439969-390c-4354-94a9-
772219d0b8b9.pdf

Fidelity (2020). The Institutional Investor Digital Assets Survey. 2020 Review. By Ria Bhutoria. Retrieved
from
 https://www.fidelitydigitalassets.com/sites/default/files/documents/institutional-investors-digital-asset-
survey.pdf

Fidelity (2021). The Institutional Investor Digital Assets Study. By Jack Neureuter. Retrieved from
 https://www.fidelitydigitalassets.com/sites/default/files/documents/2021-digital-asset-study_0.pdf
Fidelity (2022). Institutional Investor Digital Assets Survey: Key Findings. Fidelity Digital Assets Research.
Retrieved from
https://www.fidelitydigitalassets.com/sites/default/files/documents/2022_Institutional_Investor_Digita
l_Assets_Study.pdf
Finder (2022). Finder Cryptocurrency Adoption Index. By Richard Laycock. Retrieved from
https://www.finder.com/finder-cryptocurrency-adoption-index (date: 10/01/2023)
Gemini (2022). Global state of crypto report. Retrieved from https://www.gemini.com/gemini-2022-
state-of-crypto-global.pdf
J.P. Morgan (2023). The e-Trading Edit. Insights from the Inside. Retrieved from
 https://www.jpmorgan.com/solutions/cib/markets/etrading-trends (date: 18/03/2023)
Mandelbrot, B. (1984). The fractal geometry of Nature. Freeman. p. 342.
Metcalfe, R. (2013). "Metcalfe's Law after 40 Years of Ethernet". Computer. 46 (12): 26–31.

Morning Consult (2022). The Crypto Report: Our Analysts on the State of Cryptocurrency. Retrieved
from https://go.morningconsult.com/rs/850-TAA-
511/images/220630_State_of_Cryptocurrency_Report.pdf

Nakamoto, S. (2008). Bitcoin: A Peer-to-Peer Electronic Cash System. Retrieved from
https://bitcoin.org/bitcoin.pdf
Shapiro, C. (1999). Information rules: a strategic guide to the network economy. Varian, Hal R. Boston,
Mass.: Harvard Business School Press.

Statista (2022). Global Consumer Survey. Cryptocurrency adoption in 56 different countries worldwide
2019-2022. By Raynor de Best, Mar 7, 2023. Retrieved from
https://www.statista.com/statistics/1202468/global-cryptocurrency-ownership/ (date:
10/03/2023)

Taleb, N. N. (2012). Antifragile: Things That Gain from Disorder. Random House.
You can also read