What Is the Best Discipline to Predict Overall Triathlon Performance? An Analysis of Sprint, Olympic, Ironman 70.3, and Ironman 140.6 - Frontiers
←
→
Page content transcription
If your browser does not render page correctly, please read the page content below
ORIGINAL RESEARCH
                                                                                                                                                       published: 05 May 2021
                                                                                                                                             doi: 10.3389/fphys.2021.654552

                                                What Is the Best Discipline to Predict
                                                Overall Triathlon Performance?
                                                An Analysis of Sprint, Olympic,
                                                Ironman® 70.3, and Ironman® 140.6
                                                Caio Victor Sousa1, Samuel Aguiar 2, Rafael Reis Olher 3, Rafael Cunha4,
                                                Pantelis Theodoros Nikolaidis5, Elias Villiger 6, Thomas Rosemann 6 and Beat Knechtle6,7*
                                                1
                                                 Bouvé College of Health Sciences, Northeastern University, Boston, MA, United States, 2Department of Physical Education,
                                                University Center of Federal District – UDF, Brasilia, Brazil, 3Department of Physical Education, University Center of Planalto
                                                Central Apparecido dos Santos – UNICEPLAC, Brasilia, Brazil, 4Strength and Conditioning Laboratory, Faculty of Physical
                                                Education, University of Brasilia – UnB, Brasilia, Brazil, 5School of Health and Caring Sciences, University of West Attica,
                                                Athens, Greece, 6Institute of Primary Care, University Hospital Zurich, Zurich, Switzerland, 7Medbase St. Gallen
                            Edited by:
                                                Am Vadianplatz, St. Gallen, Switzerland
                  Luca Paolo Ardigò,
             University of Verona, Italy

                       Reviewed by:             Objective: To analyze the proportion of dedication in each triathlon discipline (swimming,
                  Emilson Colantonio,
                                                cycling, and running) and the importance of each separate discipline to predict overall
  Universidade Federal de São Paulo,
                                Brazil          performance of elite triathletes across different triathlon distances.
                         Paul Stapley,
   University of Wollongong, Australia          Methods: Data from 2015 to 2020 (n = 16,667) from official races and athletes in Sprint,
                  *Correspondence:              Olympic distance, IM 70.3 (Half-Ironman distance), and IM 140.6 (Full-Ironman distance)
                        Beat Knechtle           competitions were included. The proportion of each discipline was calculated individually
            beat.knechtle@hispeed.ch
                                                and compared using general linear models by event distance, sex, and performance level.
                   Specialty section:           Automatic linear regression models were applied for each distance considering overall
         This article was submitted to          performance as the dependent variable.
                   Exercise Physiology,
               a section of the journal         Results: A within-distance analysis showed that the best predictor for Sprint is cycling, for
               Frontiers in Physiology          Olympic is swimming, for IM 70.3 is cycling, and for IM 140.6 is running. A between-distance
         Received: 16 January 2021              analysis revealed that swimming is a better predictor in Olympic distance than in other
           Accepted: 12 April 2021
           Published: 05 May 2021               triathlon distances. Cycling is a poor predictor for overall performance in IM 140.6, and the
                             Citation:          importance of running to predict overall performance is the highest in IM 140.6 and diminishes
      Sousa CV, Aguiar S, Olher RR,             with decreasing race distance.
    Cunha R, Nikolaidis PT, Villiger E,
 Rosemann T and Knechtle B (2021)               Conclusion: Each discipline represents a different relative portion and importance to
What Is the Best Discipline to Predict          predict overall performance depending on the triathlon distance. Swimming is the most
      Overall Triathlon Performance?
      An Analysis of Sprint, Olympic,           important predictor discipline in Sprint- and Olympic-distance triathlon, cycling in IM 70.3,
Ironman® 70.3, and Ironman® 140.6.              and running in IM 140.6.
           Front. Physiol. 12:654552.
    doi: 10.3389/fphys.2021.654552              Keywords: swimming, cycling, running, half-distance, full-distance, endurance, ultra endurance

Frontiers in Physiology | www.frontiersin.org                                           1                                                May 2021 | Volume 12 | Article 654552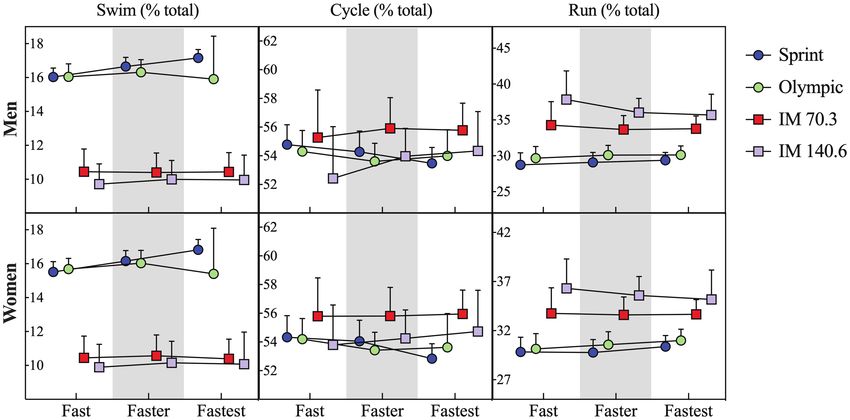
Sousa et al.                                                                                                      Prediction of Triathlon Performance

INTRODUCTION                                                              the contribution of each discipline to overall performance in
                                                                          professional triathletes is missing.
A triathlon is a multidisciplinary sport that includes swimming,              Therefore, considering that the elite triathlete has the highest
cycling, and running (Bentley et al., 2002). Triathlons started           performance density (Lepers et al., 2013), this study aimed to
in the late 1970s with the traditional Ironman (IM) distance              investigate the proportion of dedication in each triathlon
of 3.8 km swimming, 180 km cycling, and 42 km running                     discipline and the importance of each discipline to predict
(Lepers, 2008). This traditional IM distance has a total of               overall performance across different triathlon distances to
140.6 miles, and it will be called as IM 140.6 throughout this            elite athletes.
manuscript. Since then, new triathlon distances were created
to make it less exclusive and more popular for spectators (Scott,
2004; Markus and Arimany, 2019). For instance, the traditional            MATERIALS AND METHODS
IM distance takes about 8 h for elite male triathletes to finish,
whereas the now-popular Olympic distance (also known as                   Ethical Approval
standard distance) covers 1.5 km swimming, 40 km cycling,                 This study was approved by the Institutional Review Board
and 10 km running and takes less than 1 h 50 min for an                   of Kanton St. Gallen, Switzerland, with a waiver of the requirement
elite male athlete to finish, and a regular single event has a            for informed consent of the participants as the study involved
larger appeal to spectators in comparison with IM (Scott, 2004;           the analysis of publicly available data.
Markus and Arimany, 2019).
    Later, the IM 70.3 was created to cover half the IM 140.6
distance, composed of 1.9 km swimming, 90 km cycling, and                 Data Collection and Processing
21.1 km running (Jäckel et al., 2020). Yet another race distance          The present analysis included data from elite athletes competing
with half the Olympic distance was created and named as                   from 2015 to 2020. Only athletes ranked as professionals were
Sprint triathlon (also known as Short triathlon), with 0.75 km            considered. Data for Sprint- and Olympic-distance triathlons
swimming, 20 km cycling, and 5 km running (Markus and                     are publicly available and were retrieved from the World
Arimany, 2019). There are specific differences between the                Triathlon Series (WTS) events (WTS, 2020). Data of IM 70.3
distinct race distances. Shorter triathlon distances require more         and IM 140.6 are also publicly available and were retrieved
power and speed, whereas longer distances require more                    for all official IM events (Ironman®, 2020). All data were
endurance and strategy (Bentley et al., 2008; Sharma and                  downloaded using a custom python script to record “event,”
Périard, 2020). Longer triathlon distances also require extra             “event year,” “age,” “sex,” “nationality,” “swimming time,” “cycling
planning for in-race hydration and nutrition (Bentley et al.,             time,” “running time,” and “overall time.”
2008; Sharma and Périard, 2020). Therefore, the training and                  Events with unstandardized race distances (weather conditions)
preparation for each triathlon distance involve more than just            were excluded from our analyses. Only official race finishers
a longer training volume.                                                 were included. No partial data were analyzed in the present
    The contribution in time that each discipline has within              study. Raw race time data in h:min:s were converted to min.
each triathlon distance is different, which may change the                The proportion of time spent in each discipline was calculated
training strategy to focus on a different discipline depending            individually by the formula “discipline time/overall time × 100.”
on the planned triathlon distance. In addition, shorter triathlon         The sample was further divided into performance tertiles. The
distances (e.g., Sprint- and Olympic-distance triathlon) have             tertiles were specified by sex and race distance. Considering
legal drafting in the cycling portion, which can significantly            that all athletes included in this sample were professional
change a race dynamic. For example, faster swimmers can                   triathletes, the performance tertiles were named as “fast,” “faster,”
start cycling in a leading peloton, which causes some athletes            and “fastest,” being the “fastest” with lower race times, and
to swim faster than planned in order to closely follow a fast             “fast” with higher race times.
pack of athletes (Gadelha et al., 2020). Different triathlon
distances show a difference in race dynamics, and the contribution        Statistical Analysis
of each discipline varies.                                                Data were tested for normality and homogeneity with
    The contribution of a given discipline across various distances       Kolmogorov–Smirnov and Levene’s tests, respectively. Automatic
and importance to predict overall performance can help coaches,           regression linear models were applied for each triathlon distance
and athletes tailor specific goals for a specific event (Figueiredo       to determine the importance of each discipline to predict overall
et al., 2016). It has been shown that the split disciplines               performance (dependent variable). Different general linear models
contribute differently to overall race performance regarding              were applied with swimming, cycling, running, and overall
the length of a triathlon race (Figueiredo et al., 2016; Scorcine         performance as the dependent variables. Independent factors
et al., 2017). It has been shown that running was the most                were “sex,” “event distance,” and “performance.” “Sex” was always
predictive split discipline in Olympic-distance triathlon (Gadelha        included as a fixed factor with two levels (men/women), “event
et al., 2020), whereas cycling was the most predictive in IM              distance” was included as a random factor with four levels
distance triathlon (Sousa et al., 2019b). However, to the best            (Sprint, Olympic, IM 70.3, and IM 140.6), and “performance”
of our knowledge, an analysis including different triathlon               was always included as a fixed factor with three levels (fast,
distances from Sprint to IM distance triathlon to determine               faster, and fastest).

Frontiers in Physiology | www.frontiersin.org                         2                                        May 2021 | Volume 12 | Article 654552
Sousa et al.                                                                                                                        Prediction of Triathlon Performance

   Performance levels were defined as race time tertiles relative                     triathlon in comparison with all other triathlon distances,
to their event distance and sex. The methods of least significant                     cycling was a poor predictor for overall performance in IM
difference were used for pairwise comparisons. Additional                             140.6, and the importance of running to predict overall
regression models were applied considering a subcohort of                             performance was the highest in IM 140.6 and reduced with
the fastest athletes (based on the first tertile) to determine                        decreasing race distance (Figure 1).
the most influent combination of disciplines over overall triathlon                       General linear models showed that “event distance” (F = 592.0;
performance. The standardized coefficient from each predictor                         p < 0.001; pη2 = 0.998) and interaction “event distance × sex”
(independent variables) was interpreted as a measure of                               (F = 33.3; p < 0.001; pη2 = 0.006) showed significant effects
importance and influence to determine the dependent variable                          for swimming. No significant effect was identified for “sex”
(overall performance). Statistical significance was defined as                        (F = 1.3; p = 0.336; pη2 = 0.299). Post-hoc results indicate that
p < 0.05. All statistical analyses were carried out with Statistical                  all triathlon distances were different from each other, with
Software for the Social Sciences (IBM® SPSS v.25, Chicago,                            Sprint- and Olympic-distance races showing a higher proportion
IL, United States).                                                                   for swimming, in comparison with IM 70.3 and IM 140.6
                                                                                      (Figure 2A). Similar results were identified for cycling, with
                                                                                      a significant “event distance” effect (F = 25.4; p = 0.012;
RESULTS                                                                               pη = 0.962) and interaction (F = 31.0; p < 0.001; pη = 0.006).
                                                                                        2                                                      2

                                                                                      No significant effect was identified for “sex” (F = 0.035;
After excluding non-finishers and incomplete data, a total of                         p = 0.863; pη2 = 0.011). Post-hoc results indicate that all triathlon
10,176 men and 6,491 women were included in the present                               distances were different from each other, with IM 70.3 showing
analysis (n = 16,667). The number of athletes from each                               the highest proportion of cycling in comparison with all others
triathlon distance, event year, and sex is displayed in Table 1.                      (Figure 2B). For running, “event distance” (F = 61.3; p = 0.003;
                                                                                      pη = 0.984) and interaction (F = 75.9; p < 0.001; pη = 0.013)
                                                                                        2                                                       2
    All four regression models showed high accuracy values to
predict overall performance (Sprint: 97.2%; Olympic: 98.5%;                           showed significant effects. No significant effect was identified
IM 70.3: 96.4%; and IM 140.4: 92.0%). A within-distance                               for “sex” (F = 0.101; p = 0.772; pη2 = 0.032). Post-hoc results
analysis showed that the better predictor for Sprint was cycling,                     indicate that all triathlon distances were different from each
for Olympic was swimming, for IM 70.3 was cycling, and for                            other, with an increasing proportion of running with increasing
IM 140.6 was running. A between-distance analysis revealed                            distance, with the Sprint distance being the lowest and IM
that swimming was the better predictor in Olympic-distance                            140.6, the highest (Figure 2C).

TABLE 1 | Sample of professional triathletes from different events between 2015 and 2020.

                                                          Men                                                                Women

                         Sprint                 Olympic         IM 70.3       IM 140.6            Sprint           Olympic            IM 70.3            IM 140.6

2015                       237                    298           1,042           581                221                282               631                359
2016                       164                    288           1,132           628                139                248               684                320
2017                       138                    264             970           531                120                167               580                334
2018                       141                    218             919           539                128                179               491                316
2019                       180                    180           1,195           520                167                143               696                276
2020                        –                      –               –             17                 –                  –                 –                  10

           ®
IM, Ironman .

 FIGURE 1 | Importance (and coefficient) of swimming, cycling, and running to predict overall triathlon performance in Sprint, Olympic, IM 70.3, and IM 140.6. IM,
 Ironman .®

Frontiers in Physiology | www.frontiersin.org                                     3                                              May 2021 | Volume 12 | Article 654552
Sousa et al. Prediction of Triathlon Performance
A B C
FIGURE 2 | Proportion of time spent in (A) swimming, (B) cycling, and (C) running in different triathlon distances by elite triathletes. Data expressed as mean and
®
standard deviation (±). IM, Ironman ; #, difference (p < 0.05) compared to other triathlon distances.
TABLE 2 | Overall performance (minutes) of men and women across different triathlon distances by performance tertiles.
Sprint Olympic IM 70.3 IM 140.6
Men Fast 57.4 ± 1.5 116.4 ± 3.0 270.1 ± 25.8 596.1 ± 58.3
Faster 54.8 ± 0.5 110.8 ± 1.1 244.5 ± 4.0 529.5 ± 9.8
Fastest 52.9 ± 0.8 107.0 ± 1.8 230.1 ± 5.8 493.5 ± 15.9
Women Fast 63.2 ± 1.5 128.2 ± 3.6 294.2 ± 14.4 633.8 ± 36.5
Faster 60.5 ± 0.6 122.0 ± 1.2 272.3 ± 4.1 581.9 ± 9.7
Fastest 58.2 ± 0.8 117.2 ± 2.5 256.4 ± 6.4 544.5 ± 18.5
®
Data expressed as mean ± standard deviation. IM, Ironman .
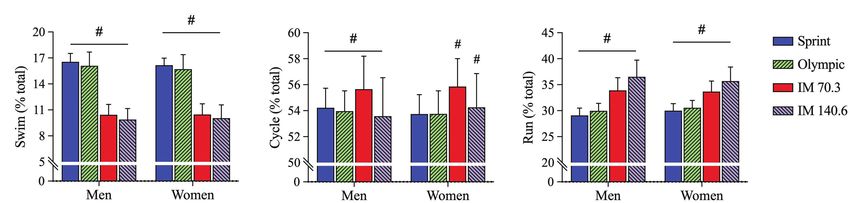
As expected, the significant effects for “performance” and Olympic-distance triathlon, and swimming also represented a
“event distance” were identified for both men and women larger portion in Sprint- and Olympic-distance triathlon relative
(p < 0.001). Pairwise comparison confirmed the “fastest” triathletes to total race time in comparison with IM 70.3 and IM 140.6;
with the lowest race times, and IM 140.6 with highest race (2) cycling represented the larger proportion relative to overall
times (Table 2). The models considering “performance” and race time and was also the better predictor for overall race
“race distance” as independent factors showed that “event distance” time in IM 70.3; and (3) the running discipline proportion
had a significant effect over the proportion of swimming (men: and the ability to predict overall performance increased with
F = 575.2; p < 0.001; pη2 = 0.997; women: F = 318.2; p < 0.001; increasing race distance.
pη = 0.994), cycling (men: F = 10.5; p = 0.008; pη = 0.840;
2 2
women: F = 17.1; p = 0.002; pη2 = 0.895), and running (men: Swimming as the Best Predictor
F = 65.8; p < 0.001; pη2 = 0.971; women: F = 104.1; p < 0.001; in Olympic-Distance Triathlon
pη = 0.981) disciplines. Conversely, “performance” was not
2
The first important finding was that swimming was the better
significant for any triathlon discipline (Figure 3). predictor for overall performance in Olympic-distance triathlon.
The subcohort with the fastest athletes had all models Swimming was the discipline representing the smallest portion
significantly (p < 0.001; R2 > 0.9). The analyses showed that the in all triathlon distances (Scorcine et al., 2017), but its
combination “Bike + Run” is the most influent combination in importance was different depending on the triathlon event.
all triathlon distances, and the least influent is “Swim + Run” In draft-legal triathlons (i.e., Sprint and Olympic), a slow
in Sprint, IM 70.3, and IM 140.6. The combination “Swim + Bike” swim may result in a slower peloton or a lonely cycling
is the least influent in Olympic triathlon. See Table 3 for details. portion. Cycling within a peloton requires lower oxygen
uptake and lower heart rate for a higher power output
(Edwards and Byrnes, 2007). Thus, athletes cycling within
DISCUSSION a fast peloton can save energy while drafting and get into
better conditions in the running portion (Ofoghi et al., 2016).
This is the first study to analyze the proportion of time spent In IM 70.3 and IM 140.6, where drafting is not allowed,
in each triathlon discipline and its importance to predict overall the athlete does not need to push harder than planned to
performance across different triathlon distance events using a stay within the first pack because the cycling portion
large sample. The main findings of this study were (1) swimming has no leading or chasing pelotons (Barbosa et al., 2019;
was the better predictor for overall performance in Jäckel et al., 2020).
Frontiers in Physiology | www.frontiersin.org 4 May 2021 | Volume 12 | Article 654552Sousa et al. Prediction of Triathlon Performance
FIGURE 3 | Proportion of time spent in swimming, cycling, and running in different triathlon distances by elite men and women triathletes in different performance
®
tertiles. Data expressed as mean and standard deviation (±). IM, Ironman .
TABLE 3 | Influence of the discipline combination over overall performance in to predict overall race time. For IM 70.3 and IM 140.6, our
the fastest triathletes in Sprint, Olympic, IM 70.3, and IM 140.6.
results showed that cycling was not a good predictor for overall
Sprint Olympic IM 70.3 IM 140.6
race time. IM 70.3 and IM 140.6 are events where drafting
is prohibited, allowing athletes to pace according to their own
Swim + Bike 0.316 0.346 0.364 0.374 ability and strategy (Barbosa et al., 2019; Jäckel et al., 2020).
Swim + Run 0.282 0.350 0.264 0.331 Though athletes hardly have extraordinary cycling performances
Bike + Run 0.446 0.465 0.460 0.468
because of the running portion that follows cycling, athletes
cycle fast enough only to keep sight of the leaders but save
®
Data expressed in standardized coefficient (beta). IM, Ironman .
enough energy for a competitive run (Angehrn et al., 2016;
Knechtle et al., 2019).
Nevertheless, our results showed that swimming does not
Our results are different from the previous research showing
represent a good predictor of overall performance in Sprint
that cycling was the best predictor for overall race time in
triathlons. Although Sprint triathlons are draft-legal races and
IM 140.6 (Sousa et al., 2019b). However, that study only
swimming represents a relatively high portion of the race, the
included the very best male performances (under 8 h), which
shorter swimming distance (an average of 9.7 min) may allow
represented only a small portion of elite athletes (Sousa et al. Prediction of Triathlon Performance
with a slowing down in pace (Knechtle et al., 2019). It is Our results require caution when applying to non-professional
noteworthy that a slower running split should account for athletes (i.e., recreational athletes and age group athletes),
more than just the in-race running distance (i.e., 5 km, 10 km, since all professional athletes are relatively good in all triathlon
21.1 km, and 42.195 km), but also the greater physical demand disciplines, whereas most non-professional athletes have one
of the previous disciplines, exposure to heat (in some events), or more disciplines that could be considered as a weakness.
dehydration, carbohydrate reposition, and psychological distress Additionally, transition times were summed to cycling and
(Dallam et al., 2005). running in this analysis, and transition can have independent
Our results corroborate previous results showing that running importance to overall performance, especially in shorter races.
was of intermediate importance to predict overall race time A limitation is that drafting is allowed in cycling in the
in Olympic and IM 70.3 (Ofoghi et al., 2016; Jäckel et al., shorter triathlon races (i.e., Sprint- and Olympic-distance
2020). This study is, however, the first to show a similar trend triathlon). Additionally, in-race factors were not considered
in Sprint triathlon. Conversely, this is also the first study to for this analysis and should be further explored in future
show that running was the better predictor of overall race studies. For instance, Short- and Olympic-distance triathlons
time in IM 140.6. In any triathlon distance, running is the usually take place in short bike course, requiring an elevated
discipline to be performed with previous swimming and cycling power output variability when existing numerous turns with
fatigue (O’Toole and Douglas, 1995). Our results show that, a need to remain with the peloton. However, in IM triathlons,
in IM 140.6, this accumulated fatigue significantly increases the courses usually have less turns allowing a more stable
the importance of running to overall performance. An explanation power output.
of this discovery might be that running is weight-bearing
locomotion in contrast to the other two disciplines in which
body weight is supported by either the bicycle or the water. CONCLUSION
Accordingly, a longer duration of a running event might result
in increased fatigue related to body weight. In conclusion, each discipline represents a different relative
portion and importance to predict overall race time depending
on the triathlon distance. Swimming represents a larger portion
Sex Differences in Sprint and Olympic relative to total race distance in comparison
The present analyses did not find any significant effect of
with longer races (IM 70.3 and IM 140.6) and is also a better
sex over the contribution of each discipline (%) to overall
predictor for overall race time in Olympic-distance triathlons.
performance in all four triathlon distances. The literature
Cycling represents the larger proportion relative to total race
is consistently showing that males are faster than females
distance and is the better predictor for overall race time in
across all triathlon distances (Lepers, 2019; Gadelha et al.,
IM 70.3. The proportion of the running discipline to overall
2020), and in all three triathlon disciplines (Lepers et al.,
race time and its ability to predict overall performance is low
2013; Lepers, 2019). Nevertheless, our results show that
in Sprint triathlons and increases with the increasing race
performance difference does not change the relative
distance, being the better overall performance predictor in
contribution and importance of each discipline to overall
IM 140.6.
performance. However, it is noteworthy that women are
becoming increasingly faster in ultra-triathlons (Sousa et al.,
2019c), closing the performance sex gap in long-distance
open-water swimming events (Nikolaidis et al., 2018). DATA AVAILABILITY STATEMENT
The raw data supporting the conclusions of this article will
Practical Applications and Limitations be made available by the authors, without undue reservation.
As for practical applications, athletes who are very good
swimmers have a better chance of success in an Olympic-
distance triathlon for two main reasons: (1) swimming represents AUTHOR CONTRIBUTIONS
a larger proportion of the race in comparison with longer
triathlon distances (i.e., IM 70.3 and IM 140.6) and (2) faster All authors contributed to the study conception and design.
swimming can put the athlete within the faster cycling peloton. Material preparation and data collection were performed by EV,
Additionally, athletes whose best discipline is cycling have PN, and BK. Data analysis was performed by CS. Data
better chances of success in Sprint and IM 70.3, since cycling interpretation was conducted by CS, SA, RO, and RC. The first
represents the longer portion relative to other distances, and draft of the manuscript was written by CS and BK. All authors
for IM 70.3, drafting is illegal. Athletes whose best discipline commented on previous versions of the manuscript. All authors
is running might do better in longer races, especially in IM contributed to the article and approved the submitted version.
140.6. Finally, for coaches and recreational athletes, this study
becomes important to be able to direct the training of athletes
so that they can prioritize or increase the potential of the ACKNOWLEDGMENTS
modalities according to the type of race that the athlete plans
to compete or specialize. We thank Patricia Villiger for her work in editing English grammar.
Frontiers in Physiology | www.frontiersin.org 6 May 2021 | Volume 12 | Article 654552Sousa et al. Prediction of Triathlon Performance
Lepers, R. (2019). Sex difference in triathlon performance. Front. Physiol. 10:973.
REFERENCES doi: 10.3389/fphys.2019.00973
Lepers, R., Knechtle, B., and Stapley, P. J. (2013). Trends in triathlon performance:
Angehrn, N., Rust, C. A., Nikolaidis, P. T., Rosemann, T., and Knechtle, B.
effects of sex and age. Sports Med. 43, 851–863. doi: 10.1007/s40279-013-
(2016). Positive pacing in elite IRONMAN triathletes. Chin. J. Physiol. 59,
0067-4
305–314. doi: 10.4077/CJP.2016.BAE418
Markus, G., and Arimany, A. (2019). “ITU triathlon history” in Triathlon
Barbosa, L. P., Sousa, C. V., Sales, M. M., Olher, R. D. R., Aguiar, S. S.,
Medicine (Cham: Springer).
Santos, P. A., et al. (2019). Celebrating 40 years of ironman: how the
Nikolaidis, P. T., Di Gangi, S., de Sousa, C. V., Valeri, F., Rosemann, T., and
champions perform. Int. J. Environ. Res. Public Health 16:1019. doi: 10.3390/
Knechtle, B. (2018). Sex difference in open-water swimming-The triple crown
ijerph16061019
of open water swimming 1875–2017. PLoS One 13:e0202003. doi: 10.1371/
Bentley, D. J., Cox, G. R., Green, D., and Laursen, P. B. (2008). Maximising
journal.pone.0202003
performance in triathlon: applied physiological and nutritional aspects of
O’Toole, M. L., and Douglas, P. S. (1995). Applied physiology of triathlon.
elite and non-elite competitions. J. Sci. Med. Sport 11, 407–416. doi: 10.1016/j.
Sports Med. 19, 251–267. doi: 10.2165/00007256-199519040-00003
jsams.2007.07.010
Ofoghi, B., Zeleznikow, J., Macmahon, C., Rehula, J., and Dwyer, D. B. (2016).
Bentley, D. J., Millet, G. P., Vleck, V. E., and McNaughton, L. R. (2002).
Performance analysis and prediction in triathlon. J. Sports Sci. 34, 607–612.
Specific aspects of contemporary triathlon. Sports Med. 32, 345–359. doi:
doi: 10.1080/02640414.2015.1065341
10.2165/00007256-200232060-00001
Pfeiffer, B., Stellingwerff, T., Hodgson, A. B., Randell, R., Pöttgen, K., and
Chollet, D., Hue, O., Auclair, F., Millet, G., and Chatard, J. C. (2000). The
Jeukendrup, A. E. (2012). Nutritional intake and gastrointestinal problems
effects of drafting on stroking variations during swimming in elite male
during competitive endurance events. Med. Sci. Sports Exerc. 44, 344–351.
triathletes. Eur. J. Appl. Physiol. 82, 413–417. doi: 10.1007/s004210000233
doi: 10.1249/MSS.0b013e31822dc809
Dallam, G. M., Jonas, S., and Miller, T. K. (2005). Medical considerations in
Scorcine, C., Pereira, R., Madureira, F., and Colantonio, E. (2017). Contribution
triathlon competition. Sports Med. 35, 143–161. doi: 10.2165/00007256-
of swimming, cycling and running in the final performance in different distances
200535020-00004
of triathlon races. MOJ Sports Med. 1, 125-128. doi: 10.15406/mojsm.2017.01.00027
Edwards, A. G., and Byrnes, W. C. (2007). Aerodynamic characteristics as
Scott, W. A. (2004). Ironman triathlon case history. Curr. Sports Med. Rep. 3,
determinants of the drafting effect in cycling. Med. Sci. Sports Exerc. 39,
163–164. doi: 10.1249/00149619-200406000-00011
170–176. doi: 10.1249/01.mss.0000239400.85955.12
Sharma, A. P., and Périard, J. D. (2020). “Physiological requirements of the
Etxebarria, N., Mujika, I., and Pyne, D. B. (2019). Training and competition
different distances of triathlon” in Triathlon Medicine (Cham: Springer),
readiness in triathlon. Sports 7:101. doi: 10.3390/sports7050101
5–17.
Figueiredo, P., Marques, E. A., and Lepers, R. (2016). Changes in contributions
Sousa, C. V., Aguiar, S. D. S., Olher, R. D. R., Sales, M. M., de Moraes, M. R.,
of swimming, cycling, and running performances on overall triathlon
Nikolaidis, P. T., et al. (2019a). Hydration status after an ironman triathlon:
performance over a 26-year period. J. Strength Cond. Res. 30, 2406–2415.
a meta-analysis. J. Hum. Kinet. 70, 93–102. doi: 10.2478/hukin-2018-0096
doi: 10.1519/JSC.0000000000001335
Sousa, C. V., Barbosa, L. P., Sales, M. M., Santos, P. A., Tiozzo, E., Simões, H. G.,
Gadelha, A. B., Sousa, C. V., Sales, M. M., dos Santos Rosa, T., Flothmann, M.,
et al. (2019b). Cycling as the best sub-8-hour performance predictor in full
Barbosa, L. P., et al. (2020). Cut-off values in the prediction of success in
distance triathlon. Sports 7:24. doi: 10.3390/sports7010024
olympic distance triathlon. Int. J. Environ. Res. Public Health 17:9491. doi:
Sousa, C. V., Nikolaidis, P. T., and Knechtle, B. (2019c). Ultra-triathlon—pacing,
10.3390/ijerph17249491
performance trends, the role of nationality, and sex differences in finishers
®
Ironman (2020). Ironman World Championship Results. Available at: https://
www.ironman.com/im-world-championship-results (Accessed March 20, 2020).
and non-finishers. Scand. J. Med. Sci. Sports 30, 556–563. doi: 10.1111/
sms.13598
Jäckel, K., Sousa, C. V., Villiger, E., Nikolaidis, P. T., and Knechtle, B. (2020). WTS (2020). World Triathlon Series Results. Available at: https://wts.triathlon.
The age-related performance decline in ironman 70.3. Int. J. Environ. Res. org/results (Accessed February 15, 2020).
Public Health 17:2148. doi: 10.3390/ijerph17062148
Jeukendrup, A. E., Jentjens, R. L., and Moseley, L. (2005). Nutritional considerations
in triathlon. Sports Med. 35, 163–181. doi: 10.2165/00007256-200535020-00005 Conflict of Interest: The authors declare that the research was conducted in
Knechtle, B., Kach, I., Rosemann, T., and Nikolaidis, P. T. (2019). The effect the absence of any commercial or financial relationships that could be construed
of sex, age and performance level on pacing of ironman triathletes. Res. as a potential conflict of interest.
Sports Med. 27, 99–111. doi: 10.1080/15438627.2018.1546703
Knechtle, B., Knechtle, R., Stiefel, M., Zingg, M. A., Rosemann, T., and Rust, C. A. Copyright © 2021 Sousa, Aguiar, Olher, Cunha, Nikolaidis, Villiger, Rosemann and
(2015). Variables that influence ironman triathlon performance - what changed Knechtle. This is an open-access article distributed under the terms of the Creative
in the last 35 years? Open Access J. Sports Med. 6, 277–290. doi: 10.2147/ Commons Attribution License (CC BY). The use, distribution or reproduction in
OAJSM.S85310 other forums is permitted, provided the original author(s) and the copyright owner(s)
Lepers, R. (2008). Analysis of Hawaii ironman performances in elite triathletes are credited and that the original publication in this journal is cited, in accordance
from 1981 to 2007. Med. Sci. Sports Exerc. 40, 1828–1834. doi: 10.1249/ with accepted academic practice. No use, distribution or reproduction is permitted
MSS.0b013e31817e91a4 which does not comply with these terms.
Frontiers in Physiology | www.frontiersin.org 7 May 2021 | Volume 12 | Article 654552You can also read